February 10th, 2021 2022 Chevrolet Bolt EUV Reveal - February 14, 2021

Page created by Joe Gonzales
 
CONTINUE READING
February 10th, 2021 2022 Chevrolet Bolt EUV Reveal - February 14, 2021
February 10th, 2021
2022 Chevrolet Bolt EUV
Reveal – February 14, 2021
February 10th, 2021 2022 Chevrolet Bolt EUV Reveal - February 14, 2021
INFORMATION RELEVANT TO THIS PRESENTATION
                                                       This presentation and related comments by management may include “forward-looking statements” within the
meaning of the U.S. federal securities laws. Forward-looking statements are any statements other than statements of historical fact. Forward-looking statements represent
our current judgement about possible future events and are often identified by words such as “aim”, “anticipate,” “appears,” “approximately,” “believe,” “continue,”
“could,” “designed,” “effect,” “estimate,” “evaluate,” “expect,” “forecast,” “goal,” “initiative,” “intend,” “may,” “objective,” “outlook,” “plan,” “potential,” “priorities,” “project,”
“pursue,” “seek,” “should,” “target,” “when,” “will,” “would,” or the negative of any of those words or similar expressions. In making these statements we rely upon
assumptions and analysis based on our experience and perception of historical trends, current conditions and expected future developments, as well as other factors we
consider appropriate under the circumstances. We believe these judgements are reasonable, but these statements are not guarantees of any future events or financial
results, and our actual results may differ materially due to a variety of important factors, many of which are described in our Annual report on Form 10-K and our other
filings with the Securities and Exchange Commission. We caution readers not to place undue reliance on forward-looking statements. Forward-Looking statements speak
only as of the date they are made, and we undertake no obligation to update publicly or otherwise revise any forward-looking statements, whether as a result of new
information, future events or other factors that affect the subject of these statements, except where we are expressly required to do so by law.

                                 See our most recent Annual Report on Form 10-K and our other filings with the Securities and Exchange Commission for a description of
certain non-GAAP measures used in this presentation, including EBIT-adjusted, EPS-diluted-adjusted, ETR-adjusted, ROIC-adjusted and adjusted automotive free cash flow,
along with a description of various uses for such measures. This presentation also includes GMF’s return on tangible common equity, which is used by GMF’s management
and can be used by investors to measure GMF’s contribution to GM’s enterprise profitability and cash flow. Return on tangible common equity is calculated as GMF’s net
income attributable to common shareholder for the trailing four quarters divided by GMF’s average tangible common equity for the same period. Our calculation of these
non-GAAP measures are set forth within these reports and the Select Supplemental Financial Information section of this presentation and may not be comparable to
similarly titled measures of other companies due to potential differences between companies in the method of calculation. As a result, the use of these non-GAAP measures
has limitations and should not be considered superior to, in isolation from, or as a substitute for, related U.S. GAAP measures. When we present our total company EBIT-
adjusted, GMF is presented on EBT-adjusted basis.

                       In this presentation and related comments by management, references to “record” or “best” performance (or similar statements) refer to General
Motors Company, as established in 2009 on a continuing operations basis. In addition, certain figures included in the charts and tables in this presentation may not sum
due to rounding.

                                                                                                                                                                                            2
February 10th, 2021 2022 Chevrolet Bolt EUV Reveal - February 14, 2021
GENERATE PROFITABLE GROWTH
AS WE EXECUTE OUR VISION OF ZERO CRASHES, ZERO EMISSIONS AND ZERO CONGESTION

             FUTURE OF MOBILITY
> $27B+ allocated to EV & AV investment through 2025 with   > Leading truck & SUV market share, with growing large
  more than $7B planned in 2021                               pickup market share
> Defining EV franchise success                             > Leveraging our heritage, iconic brands and industry-leading
      > #1 EV market share in North America                   customer loyalty
      > Margins similar to or higher than ICE               > Highly cash generative business to fund EV/AV growth
      > Selling 1M+ EVs globally by mid-decade                opportunities

> Customer knowledge, leading design and engineering        > Top priority is to invest in new and existing businesses,
                                                              including investments to accelerate EV & AV growth
> Vehicle validation, safety, testing and manufacturing
  expertise

                                                                                                                            3
February 10th, 2021 2022 Chevrolet Bolt EUV Reveal - February 14, 2021
OUR ULTIUM PLATFORM WILL HELP PUT EVERYONE IN AN EV

             30    New EVs by 2025 globally                         2/3          Available in North America

                     Select Upcoming North American Launches

      LYRIQ        HUMMER EV Full-Size Pickup         Bolt EV       Crossovers          Origin           EV600
    CELESTIQ        HUMMER EV Full-Size SUV          Bolt EUV
  Full-Size SUV        Full-Size Pickup          Full-Size Pickup
   Crossovers                                      Crossovers
Low Roof Entries                                Low Roof Entries

                   Several key high-volume entries by 2023
                                                                                                                 4
February 10th, 2021 2022 Chevrolet Bolt EUV Reveal - February 14, 2021
DRIVING THE NEXT GENERATION OF MOBILITY

 GMC HUMMER EV                                                 Cadillac LYRIQ
      Available late 2021                                      Available H1 2022
  The world’s first zero                                       Aimed at the heart of
  emissions, zero limits                                       the 2M+ global luxury
  all-electric supertruck                                      SUV market segment

  Vehicle Intelligence
       Platform (VIP)
                                                               Super Cruise
                                                               Available on 22 models
Available on 29 models
                                                               by 2023 – innovating
by 2023 – the system
                                                               the future of driving
enables the adoption of
functionality upgrades
throughout the lifespan
of the vehicle

                                                                                        5
February 10th, 2021 2022 Chevrolet Bolt EUV Reveal - February 14, 2021
WIDE ARRAY OF BRANDS EXPANDING INTO NEW MARKETS

           BrightDrop                               Cruise
Offers a system of first-                           Entered a long-term
to-last mile products,                              strategic relationship
software and services                               with Microsoft; Cruise
including the EV600 and                             is currently testing in
the EP1 electric pallet –                           San Francisco without
which enabled FedEx                                 backup drivers
Express      couriers    to
handle        significantly
more packages per day
in a pilot program

         GM Defense                                 GM Hydrotec
Delivered first infantry                            Collaboration     with
squad vehicle to the U.S.                           Navistar validates our
Army in October 2020,                               hydrogen fuel cell
just 120 days from                                  technology
contract award in June

                                                                              6
February 10th, 2021 2022 Chevrolet Bolt EUV Reveal - February 14, 2021
FINANCIAL PERFORMANCE

       2022 GMC HUMMER EV   7
February 10th, 2021 2022 Chevrolet Bolt EUV Reveal - February 14, 2021
CY PERFORMANCE

                                                                                                                 EPS-Diluted-Adj.; EBIT-Adj. & Margin
              EPS-DILUTED-ADJ.                                ADJ. AUTO FREE CASH FLOW
                                                                                                                 >   Higher primarily due to full-size pickup truck and SUV
                                                                                                                     pricing and performance, non-recurrence of the 2019
                                                                                                                     strike, cost actions and strong used car prices,
                                                                                                                     partially offset by the production downtime due to
                                                                                                                     the pandemic and the Takata airbag-inflator recall
           $4.82                 $4.90                                                                           >   EPS-diluted-adjusted includes $0.12 impact from PSA,
                                                                            +$1.5B YOY                               Lyft, and Lordstown Motors (LMC) in CY-20 and $0.12
           CY-19
                   1
                                 CY-20                                                                               impact from PSA and Lyft in CY-19
                                                                                                                 >   EPS-diluted-adjusted includes ($0.59) impact from
                                                                                                                     Takata recall in CY-20
                                                                                                                 Adj. Auto Free Cash Flow
    EBIT-ADJ. 2 & EBIT-ADJ. MARGIN 2                               SHARE & DELIVERIES                            >   Higher primarily due to the non-recurrence of the
                                                                                                                     2019 strike, retimed CapEx and other cost actions in
                                                                                                                     2020, partially offset by the impact of the pandemic
                                                                                                                 Share & Deliveries
            6.1%                  7.9%                                     Market Share flat YOY                 >   GMNA: Market share increased YOY primarily due to
                                                                                                                     performance of full-size pickups and SUVs
            $8.4                 $9.7                                                                            >   China: Market share decreased YOY primarily driven
                                                                           Deliveries (0.9)M YOY                     by the relative strength in segments of the
                   1
                                                                                                                     commercial vehicle industry in which GM does not
           CY-19                 CY-20                                                                               participate

1 CY-19   EPS-diluted-adj. and EBIT-adj. lower by an estimated $1.89 and $3.6B as a result of the 2019 strike.                                                                8
2   See slide 28 for description of special items.
February 10th, 2021 2022 Chevrolet Bolt EUV Reveal - February 14, 2021
CY EBIT-ADJUSTED

                                                                                  CY-2019   CY-2020
 In $B
                                                                                                                                            $9.7
                 1   $9.1                                                                                                               1
          $8.2                                                                                                                   $8.4

                                                                    $2.1          $2.7

                                      ($0.2)     ($0.5)                                                        ($0.7)   ($0.6)
                                                                                            ($1.0)    ($0.9)

              GMNA                           GMI                     GM Financial                Cruise          Corp/Elims      Total Company

1 CY-19   EBIT-adj. lower by an estimated $3.6B as a result of the 2019 strike.                                                                    9
February 10th, 2021 2022 Chevrolet Bolt EUV Reveal - February 14, 2021
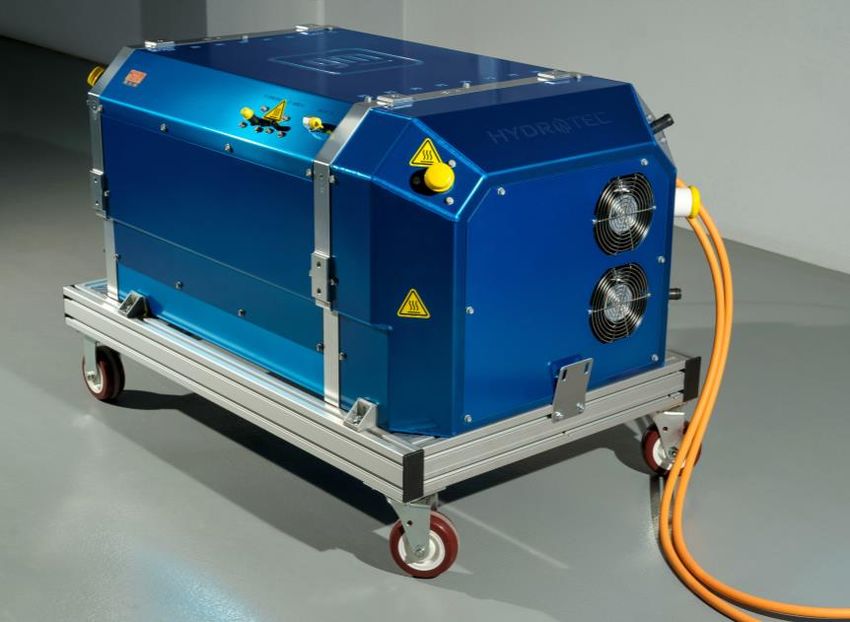
CY EBIT-ADJUSTED PERFORMANCE
In $B                                                                                             Performance/Other: $2.0
                                                                                              Takata Airbag-Inflator Recall: $(1.1)
                                                                                                Other Warranty-Related: $0.7
                                 GMNA: (507)k
                                  GMI: (332)k

                                                                                                                                      FX: $(0.7)
                                                                                                                                   China EI: $(0.6)
                                                                                                                                 GM Financial: $0.6
                                                                                                                                 PSA/Lyft1/LMC: $0.1

  Volume / Mix
  > GMNA: Down due to production stoppage as a result of the pandemic, planned lower car production and launch of full-size SUVs, partially offset by
    non-recurrence of the 2019 strike
  Price
  > GMNA: Increased primarily as a result of the launch of our all-new full-size SUVs and disciplined incentives across the industry due to lean inventory
  Cost
  > GMNA: Decreased primarily as a result of our cost actions, partially offset by increased net warranty-related activity and material costs
  Other
  > FX & China EI: Impact primarily due to various currency movements against the USD and lower China equity income due to the impact of the
    pandemic, unfavorable pricing and increased fuel economy and New Energy Vehicle (NEV) compliance costs, partially offset by cost actions
  > GMF: Increased primarily due to gains on sales of off-lease vehicles, driven by strong used vehicle prices, and lower interest expense

1 We   liquidated our remaining shares in Lyft, Inc. in the six months ended June 30, 2020.
                                                                                                                                                             10
FOURTH QUARTER PERFORMANCE

              EPS-DILUTED-ADJ.                                ADJ. AUTO FREE CASH FLOW                            EPS-Diluted-Adj.; EBIT-Adj. & Margin
                                                                                                                  >   Higher primarily due to the non-recurrence of the
                                                                                                                      2019 strike, launch of our full-size SUVs, disciplined
                                                                                                                      pricing on full-size pickups, and strong used car
                                                                                                                      prices, partially offset by the Takata airbag-inflator
                                                                                                                      recall
                                  $1.93
            $0.05
                                                                             +$4.7B YOY                           >   EPS-diluted-adjusted includes $0.26 impact from PSA
                       1
                                                                                                                      and LMC in Q4-20 and ($0.02) impact from PSA and
            Q4-19                 Q4-20                                                                               Lyft in Q4-19
                                                                                                                  >   EPS-diluted-adjusted includes ($0.59) impact from
                                                                                                                      Takata recall in Q4-20
                                                                                                                  Adj. Auto Free Cash Flow
    EBIT-ADJ. & EBIT-ADJ. MARGIN
                   2                               2                SHARE & DELIVERIES                            >   Higher driven by the impact of the 2019 strike and
                                                                                                                      retiming of CapEx in 2020, partially offset by the
                                                                                                                      timing of the GMF dividend
                                                                                                                  Share & Deliveries
                                  9.9%                                   Market Share +10 bps YOY                 >   GMNA: Market share increased primarily due to
            0.3%                                                                                                      performance of full-size pickups and SUVs
                                  $3.7                                      Deliveries +0.1M YOY                  >   China: Market share increased primarily driven by
            $0.1
                                                                                                                      sales growth in Cadillac, Buick and Wuling mini-EV
                   1
           Q4-19                 Q4-20

1 Q4-19    EPS-diluted-adj. and EBIT-adj. lower by an estimated $1.39 and $2.6B as a result of the 2019 strike.
                                                                                                                                                                               11
2   See slide 28 for description of special items.
FOURTH QUARTER EBIT-ADJUSTED
In $B

                                                                              Q4-2019    Q4-2020
                                                                                                                                       $3.7

                    $2.6

                                                                                  $1.0
              1
                                                  $0.3             $0.5                                                            1
      $0.3                                                                                                                  $0.1
                                                                                                                     $0.0

                                     ($0.1)                                              ($0.3)    ($0.3)   ($0.2)
             GMNA                           GMI                     GM Financial             Cruise           Corp/Elims    Total Company

1 Q4-19   EBIT-adj. lower by an estimated $2.6B as a result of the 2019 strike.                                                               12
FOURTH QUARTER EBIT-ADJUSTED PERFORMANCE
In $B
                                                                                                                                   GM Financial: $0.5
                                                                                                                                  PSA/Lyft1/LMC: $0.4
                                                                                                                                       FX: $(0.1)

                                  GMNA: 118k
                                   GMI: (53)k
                                                                                                  Performance/Other: $(1.0)
                                                                                              Takata Airbag-Inflator Recall: $(1.1)
                                                                                                Other Warranty-Related: $0.4

  Volume / Mix
  > GMNA: Increased primarily due to non-recurrence of the 2019 strike, partially offset by planned lower car production
  Price
  > GMNA: Increased primarily as a result of the launch of our all-new full-size SUVs and disciplined incentives across the industry due to lean inventory
  Cost
  > GMNA: Costs increased primarily due to net warranty-related activity and increased material cost
  Other
  > GMF: Increased primarily due to gains on sales of off-lease vehicles due to strong used vehicle prices, lower provision expense due to better credit
    performance, and lower interest expense

1 We   liquidated our remaining shares in Lyft, Inc. in the six months ended June 30, 2020.                                                                  13
GMNA PERFORMANCE

                NET REVENUE ($B)                                                         EBIT-ADJ. ($B)

               775                     799        802                                                            15.0%
   684
                                                                                    8.5%                                        8.7%
                           331                                          1.2%
                                      $29.1      $30.2                  $0.3         $2.2         (0.9)%          $4.4          $2.6          > Full year 9.4% EBIT-adj.
   $22.7      $25.8
                          $11.6                                                                                                                 margins despite
                                                            -      -                              ($0.1)                                  -
                                                                                                                                                industry declines due
  Q4-19       Q1-20      Q2-20       Q3-20       Q4-20                 Q4-19        Q1-20         Q2-20         Q3-20         Q4-20             to the pandemic and
                                                                                             EBIT-Adj. Margin                                   Takata airbag-inflator
                         Wholesales
                                                                                                                                                recall
                                                                                                                                              > 1.4% YoY gain in Q4
       U.S. DEALER INVENTORY (000’S)                1                  AVG. U.S. RETAIL INCENTIVE ($/UNIT)                                      U.S. retail market
                                                                                                                                                share driven by the
                                                                                     1.20
    616        668                                                                                                                              newly launched full-
                                                                         1.13
                           444         492         411                                                                                          size SUVs and high
                                                                                                    1.07         1.06          1.06             demand for large
                                                                                                                                                pickup trucks
                                                                       $5,436       $5,478        $5,484       $4,808         $4,544

  Q4-19       Q1-20       Q2-20      Q3-20       Q4-20                 Q4-19        Q1-20         Q2-20         Q3-20         Q4-20
                                                                            Avg. U.S. Retail Incentive as a % of ATP - GM% / Industry %

Note: Incentive, ATP, and market share information based on J.D. Power and Associates Power Information Network (PIN) data.                                                14
1 Amounts as of quarter end.
GMI PERFORMANCE – Excluding GM China JV

                 NET REVENUE ($B)                                       EBIT-ADJ. ($B)
                                                                                                  $0.0
 $4.4                                 $3.9        ($0.4)
         $3.3
                                              -               ($0.4)        ($0.4)       ($0.3)   0.9%    -
                               $2.7           -                                                           -

                     $1.7                     -   (8.1)%      (11.7)%                    (9.2)%
                                                                                                          -
                                                                                                          -
                                              -                                                           -
                                              -
                                                                            (26.2)%                       -

                                                  Q4-19       Q1-20         Q2-20        Q3-20    Q4-20
Q4-19   Q1-20       Q2-20     Q3-20   Q4-20
                                                           EBIT-Adj. margin from GMI ex. China EI

               WHOLESALES (000’s)             > Q4-20 EBIT-adjusted significantly up YOY primarily due
                                                to the following:
268                                               > New vehicle launches
         191                           216
                               166                > Pricing actions across international markets
                     90                           > Continued improvements from cost actions
                                              > Chevrolet brand remains 2020 market share leader in
                                                South America
Q4-19   Q1-20       Q2-20     Q3-20   Q4-20

                                                                                                              15
GM CHINA JV PERFORMANCE

                          NET REVENUE ($B) 1                                                              CHINA JV EQUITY INCOME ($B)

                                                               $14.1                              5.2%                  6.1%        4.9%      3.5%
    $10.3                                       $11.0
                                  $9.2                                                                                              $0.3       $0.2
                                                                                                  $0.2                   $0.2
                   $4.3                                                                       -
                                                                                                             ($0.2)                                    -

                                                                                              -
                                                                                                             (8.1)%                                    -

                                                                                                  Q4-19      Q1-20      Q2-20      Q3-20      Q4-20
    Q4-19         Q1-20         Q2-20          Q3-20          Q4-20
                                                                                                               Total Auto China JV NI/Rev

                       WHOLESALES (000’s) 2
                                                                                              > Q4-20 China equity income flat YOY and consistent with
                                                                                                our projected ~$0.2B run-rate; increased volumes were
                                                              1,106                             offset by unfavorable pricing and increased fuel
    883                                         848                                             economy and NEV compliance costs
                                 733
                   341                                                                        > We received $0.5B3 in dividends from our China
                                                                                                automotive JVs in Q4-20, bringing total dividends to
                                                                                                $1.0B3 for CY-20
    Q4-19        Q1-20          Q2-20         Q3-20          Q4-20

1 Revenue not consolidated in GM results, pro-rata share of earnings reported as equity income.
2 China JV Wholesales not consolidated in GM results.                                                                                                      16
3 Dividends net of withholding tax.
($B)                                                                                      Q4                                              CY
 Financial Performance                                                       2020                    2019                   2020                    2019
 Revenue 1                                                                    0.0                     0.0                     0.1                    0.1
 EBIT-adjusted                                                                (0.3)                  (0.3)                   (0.9)                   (1.0)
 Cash used in operating activities                                            (0.3)                  (0.2)                   (0.8)                  (0.8)

1 Reclassified
           to Interest income and other non-operating income, net in our condensed consolidated income statements in the three and twelve months ended December 31,
                                                                                                                                                                      17
2020 and December 31, 2019.
EBT-ADJUSTED ($B)                                                                   ENDING EARNING ASSETS ($B)
                                                              20.5%                                           45%            53%           43%
    15.4%                                      16.4%                                           38%                                                        41%
                  14.3%
                                 12.1%
                                                 $1.2          $1.0                           $96.5          $96.1          $94.0         $96.5         $100.2
    $0.5           $0.2           $0.2

   Q4-19          Q1-20         Q2-20          Q3-20          Q4-20                           Q4-19          Q1-20         Q2-20          Q3-20          Q4-20
         Return on Average Tangible Common Equity (ROATCE)                                                  GMF as % of GM U.S. Retail Sales (units)

                            LIQUIDITY ($B)
                                                                                           > Q4 EBT-adjusted driven by high used vehicle prices
                   9.32x          9.38x
     8.30x                                       8.38x         8.00x                       > Leverage declined in Q4 due to continued strong earnings

                                                 $28.1         $26.6                       > GMF has sufficient capital and ample liquidity
     $23.1         $23.9          $24.0

    Q4-19          Q1-20          Q2-20          Q3-20         Q4-20
                                Leverage Ratio

Note: Ending earning assets includes outstanding loans to dealers that are controlled and consolidated by GM in connection with our commercial lending program and
direct-finance leases from other GM subsidiaries. Return on average tangible common equity is defined as net income attributable to common shareholder for the trailing   18
four quarters divided by average tangible common equity for the same period. Liquidity excludes $1.0B GM Junior Subordinated Revolving Credit Facility.
AUTOMOTIVE LIQUIDITY

                                                           TOTAL AUTOMOTIVE DEBT &
       AUTOMOTIVE LIQUIDITY ($B)
                                                           UNDERFUNDED PENSION ($B)
                                      $40.5
     $34.6                                                                                    $29.8
                                                            $26.3
                                      $18.2                                                   $7.0
      $17.3                                                  $6.4
                                                                                               $5.4
                                                             $5.4
                                      $22.3                                                   $17.5
      $17.3                                                  $14.4

  Dec 31, 2019                    Dec 31, 2020           Dec 31, 2019                      Dec 31, 2020
                                                        Non-U.S. Pension
Available Credit Facilities
Cash, Cash Equivalents and Marketable Debt Securities   U.S. Pension
                                                        Senior Unsecured Notes and Other

                                                                                                          19
ADJUSTED AUTOMOTIVE FREE CASH FLOW
                                                                Q4                   YTD
($B)                                                    2020         2019    2020          2019
 Net Income (Loss)                                       2.8         (0.2)   6.3           6.7
       Income tax and net automotive interest expense   0.9          (0.1)   2.6            1.1
       EBIT adjustments                                 (0.0)        0.4     0.7           0.5
 EBIT-adjusted 1                                         3.7         0.1      9.7          8.4
 GMF EBT-adjusted                                       (1.0)        (0.5)   (2.7)         (2.1)
 Cruise EBIT loss-adjusted                               0.3         0.3     0.9           1.0
 Automotive EBIT-adjusted                                2.9         (0.1)    7.9          7.3
 Depreciation, amortization and impairments 2            1.4          1.4    5.3           5.6
 Pension / OPEB activities 2                            (0.3)        (0.4)   (1.6)         (1.6)
 Working Capital 2                                       1.0          1.0    (1.6)         (2.2)
 Accrued and other liabilities 2                        0.6          (1.3)   (2.9)         (2.0)
 Undistributed earnings of nonconsolidated affiliates    0.3         0.3     0.6           0.7
 Interest and tax payments                              (0.7)        (0.5)   (1.4)         (1.0)
 Other 2                                                (0.0)        0.2      1.2          0.5
Automotive net cash provided by operating activities     5.2         0.8      7.5          7.4
 Capital expenditures                                   (2.0)        (2.7)   (5.3)         (7.5)
 GMI restructuring                                       0.1           -     0.4           0.0
 Transformation activities                                -          0.5       -            1.1
 Cadillac dealer strategy                               0.0            -     0.0             -
 FAW-GM divestiture                                       -          0.2       -           0.2
 GM Brazil indirect tax recoveries                        -          (0.0)   (0.1)         (0.1)
Adjusted automotive free cash flow                      3.4          (1.3)   2.6            1.1

1 See   slide 28 for description of special items.
2 Excludes
                                                                                                   20
              EBIT adjustments.
2021 GUIDANCE

> Earnings power of the company is robust, with         > Will not impact growth and EV initiatives
  continued ability to offset commodity headwinds
                                                        > Prioritizing full-size trucks, SUVs and EVs
  and fund investments in growth opportunities
                                                        > Estimated net impact included in guidance:
> Expect 2021 CapEx to be $9B - $10B, including
  accelerated EV/AV investments and deferred 2020            > EBIT-adj. of $1.5B - $2.0B
  spend
                                                             > Adj. auto FCF of $1.5B - $2.5B
> GM Financial expected to continue delivering strong
  performance and cash flow
> Anticipate growth in China and continued
  improvements in South America                         > Estimate 2021 net interest expense slightly up YOY
                                                          and ETR-adj. of ~24%

                                                                                                               21
SUMMARY

> Strong 2020 financial performance – Q4 records for       > Focus on profitable growth opportunities and new
  EBIT-adj., EBIT-adj. margin and EPS-diluted-adj.           revenue streams as we execute on an all-electric
                                                             future
> Demonstrated flexibility to manage through
  disruptions, while executing on the launch of our all-   > Prioritizing speed to market as we launch 30 new EVs
  new full-size SUVs and accelerating EV investments         in the U.S. and China by 2025 – spending more than
                                                             $7B on EV/AV investments in 2021
> Results highlight the strength of our truck and SUV
  franchises and ability to fund future growth             > Expect to maintain the strength of the business and
  opportunities                                              ability to mitigate commodity headwinds and
                                                             incremental EV/AV investment with improved
> Continuous GM Financial growth and record levels of
                                                             performance and cost actions
  profit
                                                           > Global shortage of semiconductors will have a short-
                                                             term impact on our production, earnings and cash
                                                             flow in 2021

                                                                                                                    22
SELECT SUPPLEMENTAL FINANCIAL INFORMATION

                 2021 Buick Envision        23
Q4-20 & CY-20 GAAP RESULTS

(in $B except where noted)                            Q4                      CY
                                                            F/(U)                   F/(U)
                                              2020                    2020
                                                           vs. 2019                vs. 2019
 Net revenue                                   37.5          6.7      122.5         (14.8)
 Operating income                              2.8           3.3      6.6            1.2
 Net income attributed to stockholders         2.8           3.0      6.4           (0.3)
 EPS-diluted ($/share)                         1.93         2.09      4.33          (0.24)
 Net cash provided by operating activities     6.7           3.2      16.7           1.6

                                                                                              24
REGIONAL Q4 EBIT-ADJUSTED PERFORMANCE

         ($B)                  GMNA                        ($B)                     GMI

         ($B)                                              ($B)

CY -20    8.2   (4.1)    0.5     3.3   1.3   (0.1)   9.1     (0.2)   (0.5)   0.3   0.6    0.2   (0.9)   (0.5)

                                                                                                                25
GLOBAL DELIVERIES

(000's)

                                           Q4 2019   Q1 2020   Q2 2020   Q3 2020   Q4 2020

 North America                               853       719       565       765       875

   U. S.                                     736       618      492       665        771

 Asia/Pacific, Middle East and Africa       1,005     605       844       903       1,082

   China                                    836       462        714       771       954

 South America                               176       132       57        122       159

   Brazil                                    130       95        40        88        115

Global Deliveries – in GM Markets           2,034     1,456     1,466     1,790     2,116

                                                                                             26
GLOBAL MARKET SHARE

                                            Q4 2019   Q1 2020   Q2 2020   Q3 2020   Q4 2020

 North America                               16.2%     16.8%     16.0%     15.8%     17.3%

   U. S.                                     16.8%     17.3%     16.2%     16.5%     18.0%

 Asia/Pacific, Middle East and Africa        8.1%      6.8%      8.8%      7.9%      8.3%

   China                                     11.9%     11.7%     11.2%     11.5%     12.1%

 South America                               15.8%     15.3%     14.5%     14.3%     15.2%

   Brazil                                    17.1%     17.0%     15.8%     15.6%     16.9%

Global Market Share - in GM Markets          10.9%     10.4%     10.9%     10.5%     11.0%

                                                                                              27
RECONCILIATION OF EBIT-ADJUSTED
                              ($B)                                                                               Q4                           CY
                                                                                                         2020          2019          2020           2019
                               Net income (loss) attributable to stockholders                             2.8          (0.2)          6.4            6.7
                               Income tax expense (benefit)                                               0.6          (0.2)          1.8            0.8
                               Automotive interest expense                                                0.3           0.2           1.1            0.8
                               Automotive interest income                                                (0.0)         (0.1)         (0.2)          (0.4)

                               Adjustments
                                Transformation activities 1                                               —             0.2            —             1.7
                                GM Brazil indirect tax recoveries 2                                       —             —              —            (1.4)
                                FAW-GM divestiture 3                                                      —             0.2            —             0.2
                                GMI restructuring 4                                                       0.0           —             0.7            —
                                Ignition switch recall and related legal matters5                        (0.1)          —             (0.1)          —
                                Cadillac dealer strategy6                                                 0.1           —              0.1           —
                               Total adjustments                                                         (0.0)          0.4            0.7           0.5
                              EBIT-adjusted                                                               3.7           0.1            9.7           8.4

1 These adjustments were excluded because of a strategic decision to accelerate our transformation for the future to strengthen our core business, capitalize on the future of personal
mobility, and drive significant cost efficiencies. The adjustments primarily consist of accelerated depreciation, supplier-related charges, pension and other curtailment charges and
employee-related separation charges in the year ended December 31, 2019.
2 This adjustment was excluded because of the unique events associated with decisions rendered by the Superior Judicial Court of Brazil resulting in retrospective recoveries of indirect

taxes.
3 This adjustment was excluded because we divested our joint venture FAW-GM Light Duty Commercial Vehicle Co., Ltd. (FAW-GM), as a result of a strategic decision by both

shareholders, allowing us to focus our resources on opportunities expected to deliver higher returns.
4 These adjustments were excluded because of a strategic decision to rationalize our core operations by exiting or significantly reducing our presence in various international markets to

focus resources on opportunities expected to deliver higher returns. The adjustments primarily consist of dealer restructurings, asset impairments, inventory provisions and employee
separation charges in Australia, New Zealand, Thailand, and India in the year ended December 31, 2020.
5 This adjustment was excluded because of the unique events associated with the ignition switch recall, which included various investigations, inquiries and complaints from constituents.
6 This adjustment was excluded because it relates to strategic activities to transition certain Cadillac dealers from the network as part of Cadillac's electric vehicle strategy.           28
IMPACT OF SPECIAL ITEMS ON GAAP REPORTED EARNINGS – CY

($B)                                                                                        CY 2020                                 CY 2019
                                                                                                            Adjusted                                Adjusted
                                                                            Reported      Special items                Reported   Special items
                                                                                                          (Non-GAAP)                              (Non-GAAP)
Total net sales and revenues                                                   122.5          0.14            122.5     137.2         0.0             137.2
Costs and expenses
 Automotive and other cost of sales                                            97.5          (0.7)4          96.9       110.7        (0.2)1,2       110.4
 GM Financial operating and other expenses                                      11.3           —              11.3      12.6            —            12.6
 Automotive and other SG&A                                                      7.0          0.04,5,6          7.1       8.5          (0.0)1          8.5
Total costs and expenses                                                       115.9          (0.6)          115.2      131.8          (0.2)         131.5
Operating income                                                                6.6            0.7            7.3        5.5            0.2           5.7
 Net automotive interest expense, interest
 income, other non-operating income, and                                           1.5       (0.0)4           1.4        2.0          0.31,3         2.3
 equity income
 Tax expense                                                                       1.8      (0.2)4.5,6       1.6         0.8         0.21,2,3        1.0
Net Income                                                                         6.3        0.8            7.1         6.7          0.4            7.0
 Net loss (income) attributable to
                                                                                   0.1         —             0.1         0.1         (0.0)1          0.1
 noncontrolling interests
Net income attributable to stockholders                                            6.4        0.8            7.2         6.7          0.4             7.1
 Memo: depreciation, amortization and
                                                                                   12.8       (0.2)          12.7        14.1         (1.1)1         13.0
 impairments1

1, 2, 3, 4, 5, 6 Refer   to the respective footnote on slide 28 for description.                                                                               29
IMPACT OF SPECIAL ITEMS ON GAAP REPORTED EARNINGS – Q4

($B)                                                                                        Q4 2020                                 Q4 2019
                                                                                                            Adjusted                                Adjusted
                                                                            Reported      Special items                Reported   Special items
                                                                                                          (Non-GAAP)                              (Non-GAAP)
Total net sales and revenues                                                       37.5       (0.0)           37.5       30.8          0.0            30.8
Costs and expenses
 Automotive and other cost of sales                                                30.2       (0.1)4         30.1        25.9         (0.2)1         25.8
 GM Financial operating and other expenses                                          2.4        —             2.4          3.2          —              3.2
 Automotive and other SG&A                                                          2.1      0.04,5,6        2.2         2.3           —              2.3
Total costs and expenses                                                           34.8       (0.0)          34.7        31.4         (0.2)           31.2
Operating income (loss)                                                             2.8        0.0           2.8        (0.6)          0.2           (0.4)
 Net automotive interest expense, interest
 income, other non-operating income, and                                           0.7       (0.0)4          0.6         0.2          0.21,3         0.4
 equity income
 Tax expense                                                                       0.6      (0.0)4,5,6       0.6         (0.2)        0.11,3         (0.1)
Net Income                                                                         2.8        0.0            2.8         (0.2)        0.3             0.1
 Net loss (income) attributable to
                                                                                   0.0         —             0.0        (0.0)         (0.0)          (0.0)
 noncontrolling interests
Net income attributable to stockholders                                            2.8        0.0            2.9         (0.2)         0.3            0.1
 Memo: depreciation, amortization and
                                                                                   3.1         —             3.1         3.3          (0.1)1          3.2
 impairments1

1, 2, 3, 4, 5, 6 Refer   to the respective footnote on slide 28 for description.                                                                               30
CALCULATION OF ROIC-ADJUSTED

($B)                                                                                                                    Years Ended December 31,
                                                                                                                     2020                     2019
Numerator:
 EBIT-adjusted                                                                                                        9.7                      8.4
Denominator:
 Average equity 1                                                                                                    43.3                     43.7
 Add: Average automotive debt and interest liabilities (excluding finance leases)                                    27.8                     14.9
 Add: Average automotive net pension & OPEB liability                                                                 17.6                    16.7
 Less: Average automotive and other net income tax assets                                                            (24.0)                   (23.5)
 ROIC-adjusted average net assets                                                                                    64.7                     51.8
ROIC-adjusted                                                                                                        15.0%                    16.2%

1 Includes
         equity of noncontrolling interests where the corresponding earnings (loss) are included in EBIT-adjusted.
Note: ROIC-adjusted average net assets over four quarters includes cash.                                                                               31
EFFECTIVE TAX RATE-ADJUSTED

($M)                                                                                          Q4                                                CY

                                                                                 2020                    2019                     2020                    2019

 EBIT-adjusted                                                                  $3,712                    $105                   $9,710                  $8,393

 Less: Noncontrolling interests                                                   49                       (4)                     106                      59

 Less: Net interest expense                                                       229                     104                      857                     353

EBT-adjusted                                                                     3,434                      5                     8,747                   7,981

 Tax expense (benefit)                                                            642                     (163)                   1,774                    769

 Impact of special items 1                                                        (12)                     54                      70                      188

 Tax adjustment 2                                                                 —                        —                      (236)                     —
Tax expense (benefit)- adjusted                                                  $630                    $(109)                  $1,608                    $957

Effective tax rate-adjusted                                                      18.3%                    n.m.                   18.4%                    12.0%

  1 Seeslide 28 for description of special items.
  2 Thisadjustment consists of tax expense related to the establishment of a valuation allowance against deferred tax assets in Australia and New Zealand. This adjustment
  was excluded because significant impacts of valuation allowances are not considered part of our core operations.
  n.m. = not meaningful                                                                                                                                                      32
GM FINANCIAL - KEY METRICS

                                                                             Q4 2020                 Q4 2019                CY 2020                CY 2019
    Revenue ($B)                                                                 3.4                    3.6                    13.8                 14.6
    Total retail originations ($B)                                              13.6                   10.9                   49.8                  47.5
    Retail finance delinquencies (>30 days)                                    2.9%                    4.5%                   2.9%                  4.5%
    Annualized net charge-offs as % of average retail
                                                                               0.9%                    1.8%                   1.3%                  1.6%
    finance receivables
    Tangible equity ($B)                                                        12.4                    11.5                  12.4                   11.5
    Lease loyalty                                                                --                      --                   78% 1                 79% 2
    Loan loyalty                                                                 --                      --                   68% 1                68% 2
    Joint ventures equity income ($M)                                            34                     40                     147                  166
    Dividend ($M)                                                                --                    400                    800                   400

1   Based on CY 2019 IHS Markit Return to Market Manufacturer Loyalty. Data based on disposal methodology and GM custom segmentation in the U.S.
2   Based on CY 2018 IHS Markit Return to Market Manufacturer Loyalty. Data based on disposal methodology and GM custom segmentation in the U.S.             33
GM FINANCIAL - RETURN ON EQUITY

($M)                                                     Years Ended December 31,

                                                        2020                2019

 Net income attributable to common shareholder          $1,911              $1,477

 Average equity                                         12,120              12,270

 Less: average preferred equity                         (1,628)             (1,477)

Average common equity                                   10,492              10,793

 Less: average goodwill                                 (1,172)             (1,186)

Average tangible common equity                          9,320               9,607

Return on average common equity                         18.2%               13.7%

Return on average tangible common equity                20.5%               15.4%

                                                                                      34
EPS-DILUTED-ADJUSTED RECONCILIATION

                                                                                                Q4                      YTD

                                                                                        2020          2019     2020           2019

 Diluted earnings (loss) per common share                                               $1.93        $(0.16)   $4.33          $4.57

 Adjustments 1                                                                           —            0.25     0.46            0.38

 Tax effect on adjustments 1                                                             —           (0.04)    (0.05)         (0.13)

 Tax adjustment 1                                                                        —             —       0.16             —

EPS-diluted-adjusted                                                                    $1.93        $0.05 2   $4.90          $4.82 3

1 Seeslide 28 for description of special items.
2 Q4-19 EPS-diluted-adj. lower by an estimated $1.39 as a result of the 2019 strike.
3 CY-19 EPS-diluted-adj. lower by an estimated $1.89 as a result of the 2019 strike .
                                                                                                                                        35
2021 GUIDANCE RECONCILIATION

 ($B)                                                                           Year Ending
                                                                                Dec 31, 2021
   Net income attributable to stockholders                                        $6.8 - $7.6
   Income tax expense                                                             $2.2 - $2.4
   Automotive interest expense, net                                                   $1.0
   EBIT-adjusted                                                                 $10.0 - $11.0

                                                                                Year Ending
                                                                                Dec 31, 2021
   EPS-diluted                                                                  $4.50 - $5.25
   EPS-diluted adjusted                                                         $4.50 - $5.25

 ($B)                                                                           Year Ending
                                                                                Dec 31, 2021
   Automotive net cash provided by operating activities                         $10.0 - $12.0
        Less: Capital expenditures                                               $9.0 - $10.0
   Adjusted automotive free cash flow                                             $1.0 - $2.0

Note: we do not consider the potential future impact of adjustments on our expected financial results.   36
FOR ADDITIONAL INFORMATION PLEASE VISIT:

                                       https://investor.gm.com
                                     Website:    GetCruise.com
                                     investorrelations@gm.com
                               YouTube:  http://bit.ly/CruiseYouTube
                       https://www.gmfinancial.com/en-us/investor-center.html
                                  Medium:     Medium.com/Cruise
                                    investors@gmfinancial.com

  GM’s Investor Relations website contains a significant amount of information about GM, including financial
  and other information for investors. GM encourages investors to visit our website, https://investor.gm.com,
                           as information is updated and new information is posted.

 These materials are the intellectual property of GM and/or its affiliates or subsidiaries and may not be copied,
 reproduced, modified, displayed, or incorporated into other materials, in whole or in part, without the express
permission of GM Investor Relations. Requests to use the materials should be sent to investorrelations@gm.com.

                                                                                                                    37
You can also read