Precinct Properties New Zealand Limited Interim Results - February 2020
←
→
Page content transcription
If your browser does not render page correctly, please read the page content below

Precinct Properties New Zealand Limited
Interim Results
February 2020
Agenda

Highlights & Strategy Progress                                    Page 03

Section 1 – Financial Results & Capital Management                Page 05

Section 2 – Market & Operations                                   Page 10

Section 3 – Developments                                          Page 18

Section 4 – Conclusion & Outlook                                  Page 28

     Precinct Properties New Zealand Limited
     Scott Pritchard, CEO
     George Crawford, COO
     Richard Hilder, CFO
     Note: All $ are in NZD
PRECINCT PROPERTIES, FY20 INTERIM RESULTS PRESENTATION - Page 2
Highlights
                                        Financial Performance
                                        •   NPI of $49.2 million, 4.0% higher than pcp (7.5% higher like for like)
                                        •   Comprehensive income after tax of $53.6 million (1H19: $25.5
                                            million)
                                        •   3.11 cps AFFO (excluding LD’s) representing a payout ratio of 101%
                                        •   6.30 cps dividend guidance maintained representing a 5% increase
                                            y-o-y

                                        Capital Management
                                        •   $150 million bank debt facility refinanced
                                        •   $77 million conditional sale of Pastoral House progressing well
                                               o Settlement expected end of April 2020
                                        •   Strong balance sheet, gearing of 25.4%
                                               o Reducing to 23.5% following sale of Pastoral House

                                        Operational Performance
                                        •   99% portfolio occupancy, WALT of 8.8 years
                                        •   Contract rent growth of 9.2% from leasing activity
                                        •   Generator business 95% occupancy with 1H20 gross operating
                                            revenue of $10.4 million
                                               o Expansion of Generator offering into Wellington

PRECINCT PROPERTIES, FY20 INTERIM RESULTS PRESENTATION - Page 3
Strategy Progress
     Operational Excellence
     •   Active management driving significant portfolio outperformance with continued strong rental
         growth
     •   Precinct received a 2019 Global Real Estate Sustainability Benchmark (GRESB) score of 77
            o Now trending ahead of the global average of 72
     •   Asset recycling progressing
     •   Generator operating business performing well with 95% occupancy
     •   Currently working to reduce PCT’s carbon footprint through the measurement and management of
         our emissions

     Developing the Future
     •   Commercial Bay completion dates remain unchanged
            o Key project outcomes achieved
     •   One Queen Street on schedule to commence mid-2020
     •   Wynyard Quarter Stage 2 office space now 100% committed
     •   Bowen Campus Stage 1 successfully completed

     Empowering People
     •   Rainbow Tick Certification received
     •   Included in the Bloomberg 2020 Gender-Equality index

PRECINCT PROPERTIES, FY20 INTERIM RESULTS PRESENTATION - Page 4
Section 1

 Financial
  Results &
  Capital
Management
Interim Results
                                                                                                             Appendices reference:
                                                                                                             App 3: P&L
                                                                                                             App 4: AFFO reconciliation
                                                                                                             App 5: Balance sheet

           $53.6 m
                                                                  Key metrics                                  Dec 2019     Dec 2018

                                                                  Total comprehensive income after tax         $53.6 m       $25.5 m
           Total comprehensive income after tax
                                                                  Net operating income after tax               $60.5 m       $37.7 m

           6.30 cps
           Full year dividend guidance maintained
                                                                  Net operating income after tax per share

                                                                  FFO
                                                                                                               4.61 cps

                                                                                                               4.88 cps
                                                                                                                             3.11 cps

                                                                                                                             3.40 cps

           +5% y-o-y                                              AFFO                                         3.11 cps      2.91 cps

           101%
                                                                  Dividend attributable to the period          3.15 cps      3.00 cps

                                                                  AFFO payout ratio                              101%         103%

           AFFO payout ratio, adjusted for                        NAV                                            $1.50        $1.49
           liquidated damages

       •     Adjusting for liquidated damages, net operating income was $3.6 m higher than the
             comparable prior period
                 •    Generator contributed $1.2 m to net operating income
       •     AFFO of 3.11 cps was 6.9% higher than comparable prior period
             •       AFFO deducts liquidated damages revenue which will be retained to offset costs of
                     delay to Commercial Bay
       •     NAV per share at $1.50 (June 19: $1.49)

PRECINCT PROPERTIES, FY20 INTERIM RESULTS PRESENTATION - Page 6
Appendices reference:
                                                                                                      App 1: Net property income

     Net Property
     Income (NPI)                                       Amounts in $ millions

                                                           Auckland
                                                                                           Dec 2019

                                                                                            $22.6
                                                                                                            Dec 2018

                                                                                                              $20.8           $1.9
                                                                                                                                   D

                                                           Wellington                       $10.4              $9.9           $0.4

     $49.2 m
     6 months ended 31 December 2019
                                                        Investment portfolio

                                                           Transactions and Developments
                                                                                            $33.0

                                                                                            $16.2
                                                                                                              $30.7

                                                                                                              $16.6
                                                                                                                              $2.3

                                                                                                                              ($0.4)

                                                        Total net property income           $49.2             $47.3           $1.9

       Overall NPI growth of 4.0%
       driven by:                                                  Reconciliation of movement in net property income

       •   Strong leasing and high                       $60.0 m
           occupancy levels
              •   8.7% uplift in AKL                     $55.0 m

              •   5.1% uplift in WLG                     $50.0 m

       •   Development and asset
           sales offset by Bowen                         $45.0 m

           Campus Stage 1 now
           income producing                              $40.0 m

PRECINCT PROPERTIES, FY20 INTERIM RESULTS PRESENTATION - Page 7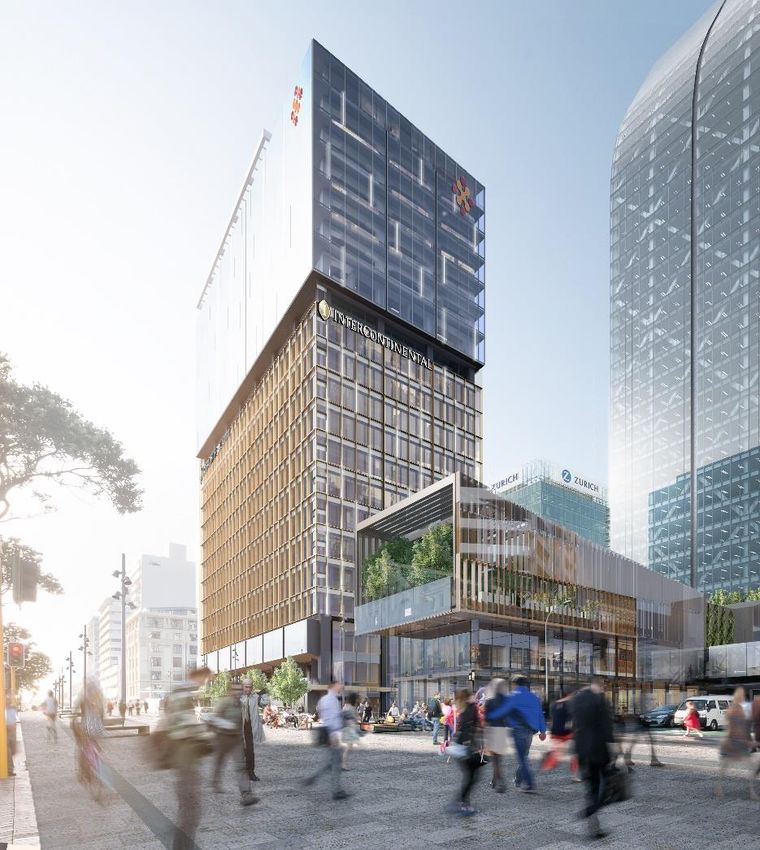
Interim Results
                                                                                          Appendices reference:
                                                                                          App 2: IFRS 16 impact
                                                                                          App 3: P&L
                                                                                          App 5: Balance sheet
  A number of new items shown in the statements:

  1.   Generator consolidated into group accounts                 +$4.8 m
                                                                  Generator operating income before
                                                                  indirect expenses consolidated in the half

  2.   IFRS 16 adopted with leases brought on to balance          Profit impact

       sheet                                                      Operating income before indirect expenses       + $3.5 m

       •     Lessee rent expense replaced by depreciation         Non-operating income / (expenses)               ($4.7 m)

             and lease interest expense                           Net profit before taxation                      ($1.2 m)

       •     Impact of standard increases EBITDA however          Balance sheet impact as at 31 December
             reduces NPAT by $1.2 m
                                                                  Right of use asset                              $40.6 m
       •     Precinct to calculate AFFO on a pre IFRS 16
                                                                  Lease liability                                 $44.8 m
             basis

                                                                   $26.7 m
  3.   $50m of liquidated damages recognised in the
       period
                                                                   Released to P&L ($2.0 m at 30 June 2019)
       •   Allocated between revenue and capital
           compensating Precinct for lost revenue and

       •
           prolongation costs
           Resulting in higher tax expense for the period
                                                                   $23.3 m
                                                                   Credited against Commercial Bay project costs

PRECINCT PROPERTIES, FY20 INTERIM RESULTS PRESENTATION - Page 8
Capital Management
    Strong balance sheet position with gearing of                 Key metrics                                                    Dec 2019           June 2019
    25.4%
                                                                  Debt drawn ($ millions)1                                         $874 m             $710 m
    • Second USPP settled in period improving
                                                                  Gearing - banking covenant (%)                                    25.4%              22.4%
      funding diversity
    • Post balance date, extended the $150 m                      Weighted average term to expiry (years)                             4.4               34.4

      facility, due to expire in November 2020                    Weighted average debt cost (incl fees)                             5.1%              5.7%

         • 5 year extension
                                                                  % of debt hedged (%)                                               78%               101%
         • Improves weighted average term to
                                                                  Interest coverage ratio (previous 12 months)                    2.5 times          2.0 times
             expiry to 4.4 years
    • Conditional sale of Pastoral House for $77 m                Total debt facilities ($ millions)                                1,196              1,196

      settlement expected end of April 2020                              1 Excludes the USPP note fair value adjustment. Interest bearing liabilities are detailed
                                                                         in Note 14 of the Financial Statements.

   Debt facility expiry profile                                   Funding diversity
                                                                                        NZ Bonds
                                                                                          15%
                                                                                                                                                       Bank debt
                                                                                                                                                         51%
                                                                        Convertible
                                                                          Note
                                                                           12%

                                                                                                                  Debt capital
                                                                                                                    markets
                                                                                                                     49%

                                                                                       USPP
PRECINCT PROPERTIES, FY20 INTERIM RESULTS PRESENTATION - Page 9                        22%
Section 2

 Market &
Operations
Our City Centre Markets
                                        Prime office
                                        •   Strong demand persists for well-located prime grade stock with occupiers continuing
                                            to move up the quality grades when space becomes available
                                        •   New supply forecast to remain limited over the medium term however potential for
                                            one or two new city centre projects to commence
                                        •   Continued growth in city centre based employment underpinned by significant
                                            investments in Auckland transport infrastructure, streetscapes and public spaces

                                        Flexible space
                                        •   Continued growth observed with increasing requirements from enterprise users
                                        •   New supply expected in Auckland over the next one to two years will aid in
                                            developing the market
                                        •   While the flexible space market will benefit from greater awareness, new supply will
                                            moderate growth in desk rates

                                        Prime retail
                                        •   In contrast to the notably higher vacancy rates in suburban retail centres from
                                            significant new supply, retail vacancy rates have fallen in the CBD due to
                                            heightened demand and continued competition for prime CBD sites
                                        •   Well-located assets are expected to outperform however scope for rental growth
                                            may be limited due to challenging conditions in the wider retail sector

                                        Hotel
                                        •   Short-term headwinds anticipated due to supply mismatch with delayed delivery of
                                            the NZICC and travel disruptions caused by the COVID-19 outbreak
                                        •   Market conditions forecast to recover over the medium term once new demand
                                            drivers come online

PRECINCT PROPERTIES, FY20 INTERIM RESULTS PRESENTATION - Page 11
CBD Office Markets
Auckland Wellington
• Well-located prime stock continues to • Prime vacancy remains materially
outperform with prime vacancy unchanged at 0.7% as at Dec-19 (Jun-
decreasing to 3.7% (Jun-19: 4.7%) 19: 0.7%) despite addition of circa
22,400m2
• Limited available options driving rental
growth with average prime net effective • Prime gross effective rents stable during
rent up 1.0% since Jun-19 (1.1% y-o-y) past six months but have improved 2.4%
y-o-y due to continued demand for
• Precinct portfolio outperformed with high-NBS assets
leasing and reviews driving 2.6% uplift
on 30 June 19 valuation rents
Forecast prime vacancy Forecast prime effective rents (AKL – net; WLG – gross)
7.00% 6.00%
Forecast NER Growth p.a.
6.00% 4.00%
5.00%
Vacancy Rate
2.00%
4.00%
0.00%
3.00%
-2.00%
2.00%
1.00% -4.00%
0.00% -6.00%
2019 2020 2021 2022 2023 2019 2020 2021 2022 2023
AKL prime vacancy (CBRE) AKL prime vacancy (JLL) AKL prime net effective (CBRE) AKL prime net effective (JLL)
WLG prime vacancy (CBRE) WLG prime vacancy (JLL) WLG prime gross effective (CBRE) WLG prime gross effective (JLL)
Source: JLL Real Estate Intelligence Service (December 2019), CBRE Market Outlook Report December 2019
PRECINCT PROPERTIES, FY20 INTERIM RESULTS PRESENTATION - Page 128.8 years
Weighted average lease term
Including developments
Portfolio 99%
Activity Portfolio occupancy
9.5%
Lift in rentals on market reviews
9.2%
Growth in contract rentals on
new leasing transactions
10.5%
Auckland growth
6.0%
Wellington growth
PRECINCT PROPERTIES, FY20 INTERIM RESULTS PRESENTATION - Page 13Key Leasing Update
• Robust demand in the period 13,401m2
• 3,838m2 of Commercial Bay office New leasing
leasing completed across two full floors,
two-part floors and two private office
suites
5,670m2
• Wynyard Quarter Stage 2 office fully Investment portfolio
committed
• Continued strong leasing at AMP 7,731m2
Centre with 2,019m2 concluded Developments
• First backfill lease completed at ANZ
Centre
• Strong portfolio performance with new
17,487m2
Total leasing including
leasing and rent reviews driving rental uplifts
extensions/RORs
• $1.4 m (30%) increase in NPI against
prior comparison period at AMP Centre
due to rental growth from new leasing 40%
transactions and improved occupancy New leasing attributed to tech
companies
• AON Centre has delivered $0.7 m (16%)
increase in NPI, mainly due to lettable
area increases
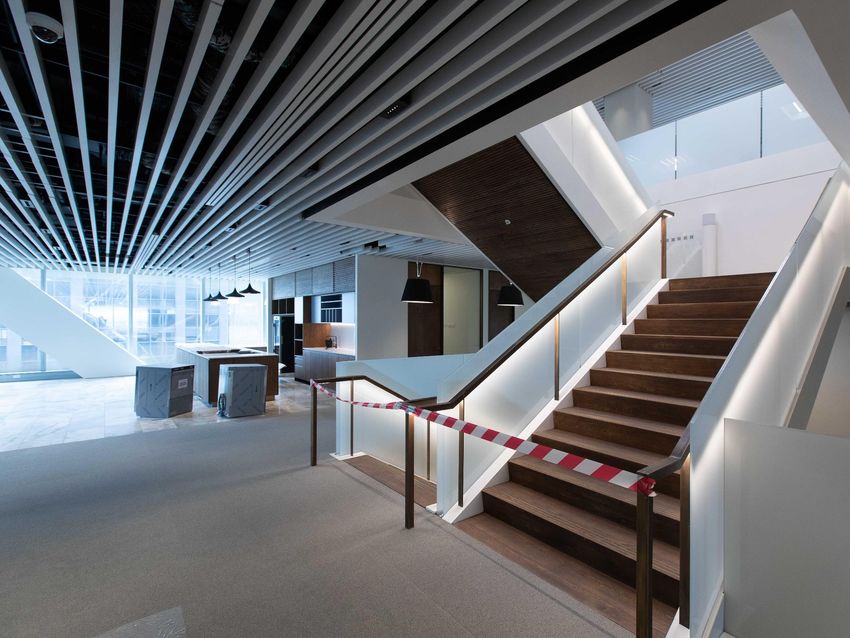
PRECINCT PROPERTIES, FY20 INTERIM RESULTS PRESENTATION - Page 14Improved Client Amenity
Completion of end of trip facilities at AMP Centre and PwC Tower
PwC Tower end of trip AMP Centre end of trip
Commenced PwC Tower Lobby Upgrade Project
PRECINCT PROPERTIES, FY20 INTERIM RESULTS PRESENTATION - Page 15Generator Update
Mature operations driving performance
• Strong occupancy recorded across all sites
• 37% growth on H1 FY19 revenue driving profitability
• The Generator and Precinct businesses are highly
complementary with many cross-selling
opportunities
• Most major leasing RFPs in the market seek
provision of a flexible space element
Enhancing Precinct amenities
• New meeting suites at Commercial Bay and 188
Quay Street, managed by Generator, will provide
space for meetings, events and build a meeting
space network
H1 H1 Revenue sources
FY20 FY19
Membership
Revenue
Gross operating
$10.4m $7.6m
revenue
Events &
Hospitality
Operating profit Revenue
$1.2m ($0.8m)
after tax
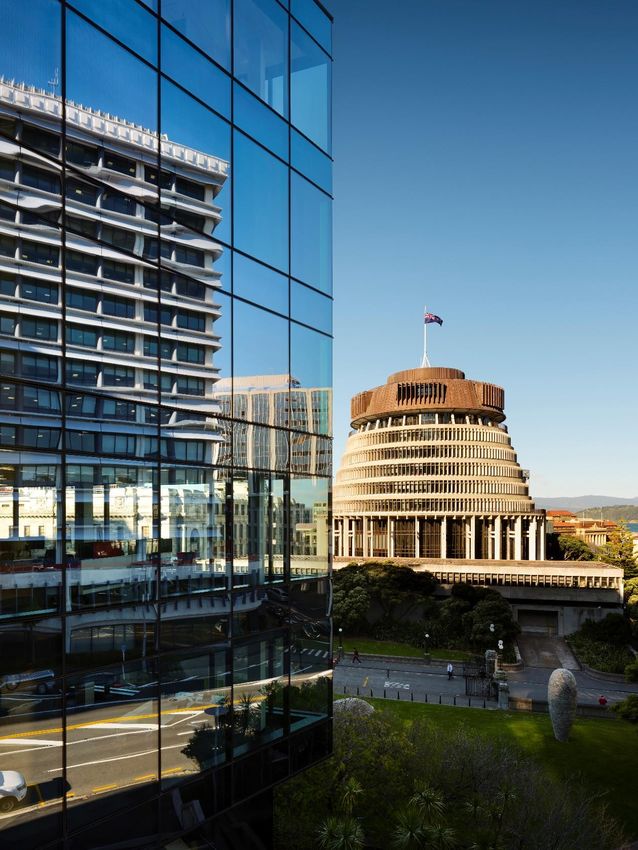
PRECINCT PROPERTIES, FY20 INTERIM RESULTS PRESENTATION - Page 16Wellington Expansion
Development
• $5.9m acquisition of an iconic Central Wellington
heritage building
• $19.3m incremental spend resulting in over 2,000m2
across 5 Levels, strengthened to 100% NBS
Offering
• Full Generator offering including private offices,
resident desks, hot-desks and meeting and event
spaces.
• Opening mid-2021
• Centrally located at 30 Waring Taylor Street by
Central on Midland Park for both government and
corporate precincts
• Opportunity to provide value in terms of the offer
to Precinct clients and Generator members, as
seen in Auckland
• Bowen Campus Stage 2 under consideration due
to leasing enquiry
PRECINCT PROPERTIES, FY20 INTERIM RESULTS PRESENTATION - Page 17Section 3 Developments
Development Summary
     Current commitments                                           Key development metrics

                                                                   Total NLA                                 73,300 m2
     • Remain on track to achieve blended ROC of 30%+ and
       blended YOC of 7.0%+                                        Total Office NLA                          55,500 m2

     • Leasing risk (office NLA) decreasing                        Office NLA leased to date                 47,900 m2

                                                                   % of total NLA leased                              88%
            • Commercial Bay – 92%
                                                                   Committed WALT                            11.0 years
            • Wynyard Quarter Stage 2 – 100%
                                                                   Value on completion                              $1.5 b
            • One Queen Street – 50%
                                                                   Weighting to Auckland                            100%

       Pipeline                                                            Portfolio Development Exposure
                                                                    140,000 m²                                        40%
     • +39,500m2 additional office NLA                              120,000 m²                                        35%
                                                                                                                      30%
                                                                    100,000 m²
            • Bowen Campus Stage 2 (21,400m2)                        80,000 m²
                                                                                                                      25%
                                                                                                                      20%
            • Wynyard Quarter Stage 3 (18,100m2)                     60,000 m²
                                                                                                                      15%
                                                                     40,000 m²
                                                                                                                      10%
     • Target pipeline returns                                       20,000 m²                                        5%
                                                                                                                      0%
            • Return on cost – 15.0%
            • Yield on cost – 6.5%
                                                                            Development NLA     % Portfolio (RHS)

                                                                   Note: ‘Pipeline’ column assumes Commercial Bay and
                                                                   Wynyard Stage 2 complete and One Queen in progress

PRECINCT PROPERTIES, FY20 INTERIM RESULTS PRESENTATION - Page 19
Commercial Bay Development Update
Nearing completion with key project outcomes secured
• Anticipated opening dates remain:
• Retail – late March 2020
• Office – April 2020
• Maintain a focus on completion and quality
• Main contractor Fletcher Construction adopting a highly collaborative approach
• All claims and counter-claims have now been resolved
• Strong investment returns maintained
• Recognised remaining liquidated damages totalling $50.0m (Jun-19: $2.0m)
• $26.7m recognised through P&L
• $23.3m credited against the development project cost
PRECINCT PROPERTIES, FY20 INTERIM RESULTS PRESENTATION - Page 20Commercial Bay Retail Leasing
Preparing to open fully leased
• Leasing has progressed highlighting
strong demand from local and
international retailers
• Recently announced retailers include:
• COS
• Calvin Klein
• Tommy Hilfiger
• Kookai
• R.M. Williams
• Scotch & Soda
• Some retailers impacted by COVID-19
outbreak with potential delays to
delivery of fitout materials
• Achieved WALT of 7.3 years
PRECINCT PROPERTIES, FY20 INTERIM RESULTS PRESENTATION - Page 21Commercial Bay Office Leasing
Commitments increased to 92%
• Leased during period:
• Levels 38 & 39 – RocketWerkz
• Level 19 (Part) – Confidential
• Level 12 – Confidential
• Suites 2 & 3, Level 36
• Remaining vacancy expected to be
leased in the coming months:
• Level 30 – 1,390m2
• Level 13 (Part) – 665m2
• Level 9 (Part) – 795m2
• Achieved WALT of 11.8 years
PRECINCT PROPERTIES, FY20 INTERIM RESULTS PRESENTATION - Page 22One Queen Street
• Construction due to commence mid-
2020 post completion of Commercial
Bay and resultant tenant migration
• Leasing commitment remains at 78%
including hotel
• Generator management
undertaking spatial planning for
the balance space
• Marketing of signature rooftop
hospitality venue to commence soon
• Short-term hotel sector headwinds
(NZICC fire, COVID-19 outbreak)
expected however remain confident in
One Queen’s location/timing
PRECINCT PROPERTIES, FY20 INTERIM RESULTS PRESENTATION - Page 23Wynyard Quarter Stage 2
Construction
• Façade install nearing completion
• Base build services install underway
• On track for practical completion late-2020
Leasing
• Office floors fully committed with formal lease
documents due to be executed for the top
two floors
• Ground floor F&B leasing underway
Financials
• Feasibility metrics remain within approved
provisions
• Forecast yield on cost of 7%+
• Forecast return on cost of 15%
PRECINCT PROPERTIES, FY20 INTERIM RESULTS PRESENTATION - Page 24Future Developments PRECINCT PROPERTIES, FY20 INTERIM RESULTS PRESENTATION - Page 25
Bowen Campus Stage 2
     • Leasing advancing with terms agreed
       for close to half of the office space
       (total 21,400m2)
     • Occupiers drawn to IL2 Low Damage
       design, large floorplate and attractive
       price point
     • Enabling works underway in preparation
       for works commencement in mid-2020
     • Incremental spend circa $170m

PRECINCT PROPERTIES, FY20 INTERIM RESULTS PRESENTATION - Page 26
Wynyard Quarter Stages 3 & 4
• Developed Design nearing completion
• Stage 3 – 117 Pakenham (8,400m2)
• Stage 4 – 124 Halsey (9,300m2)
• Flowers Building (1,700m2)
• Total office NLA of 18,100m2 plus 1,300m2 of ground floor retail/F&B
• Continue to target commitment to at least one building in 2020
• Incremental spend circa $200m
PRECINCT PROPERTIES, FY20 INTERIM RESULTS PRESENTATION - Page 27Section 4 Conclusions & Outlook
Conclusion & Outlook
     Conclusion
     • Precinct benefits from a clear strategy and supportive markets
     • Active management delivering world class real estate and exceptional returns
     • Strong growth in AFFO supporting 5.0% dividend growth
     • Strategy of being a city centre specialist enhancing returns as city centres outperform
       globally (higher GDP contribution)
     • Occupier demand remains strong driven by activity levels in Auckland
     Outlook
     • Global uncertainty remains
         • COVID-19 outbreak
         • Geopolitical risks remain unresolved
     • Interest rates to remain below long term averages for a sustained period of time
     • New Zealand economy supported by
         • Low interest rates
         • Infrastructure spend
         • Housing market

PRECINCT PROPERTIES, FY20 INTERIM RESULTS PRESENTATION - Page 29
Appendices PRECINCT PROPERTIES, FY20 INTERIM RESULTS PRESENTATION - Page 30
App 1: Net property income
 For the 6 months ended                                         Unaudited six months   Unaudited six months
                                                                                                                D
 $m                                                           ended 31 December 2019 ended 31 December 2018

    AMP Centre                                                         $6.1                   $4.7            $1.4
    PwC Tower                                                          $9.0                   $8.9            $0.0
    Commercia Bay                                                      $1.5                   $1.1            $0.4
    Zurich House                                                       $2.7                   $2.7            ($0.0)
    Mason Brothers                                                     $1.2                   $1.2            $0.0
    12 Madden Street                                                   $2.2                   $2.2            $0.1
 Auckland total                                                       $22.6                  $20.8            $1.9
    NTT Tower (157 Lambton Quay)                                       $3.6                   $3.9            ($0.3)
    AON Centre                                                         $5.1                   $4.4            $0.7
    Mayfair House                                                      $1.7                   $1.6            $0.0
 Wellington total                                                     $10.4                   $9.9            $0.4
 Investment portfolio                                                 $33.0                  $30.7            $2.3
 Transactions and Developments
    HSBC House                                                         $2.1                   $3.1            ($1.1)
    Bowen Campus                                                       $6.8                   $1.6            $5.2
    10 Brandon Street                                                   -                     $0.2            ($0.2)
    No 1 The Terrace                                                   $2.0                   $2.0            $0.0
    10 Madden Street                                                   $0.0                    -              $0.0
    Pastoral House                                                     $0.8                   $2.2            ($1.4)
    ANZ Centre                                                         $4.6                   $7.5            ($2.9)
 Total                                                                $49. 2                 $47.3            $1.9

PRECINCT PROPERTIES, FY20 INTERIM RESULTS PRESENTATION - Page 31
App 2: IFRS 16 impact
IAS 17
For the 6 months ended IFRS 16
(illustrative)
• Generator leases fall in scope
of IFRS 16 ($m) Unaudited Unaudited Movement
Income statement Investment portfolio $67.9 m $67.9 m
• IFRS 16 replaces rent expense Generator operating income $9.9 m $9.9 m
with a lease depreciation and
lease interest expense Gross operating revenue $77.8 m $77.8 m
• Operating income before Less direct operating expenses ($27.3 m) ($23.8 m) + $3.5 m
income tax increases
Operating income before indirect expenses $50.5 m $54.0 m + $3.5 m
• The inclusion of lease
depreciation and lease interest Indirect expenses / (revenue)
expense reduces net profit Other revenue $26.7 m $26.7 m
before tax by $1.2m. The
impact will reverse over the Other expenses ($6.6 m) ($6.6 m)
lease term
Net interest expense ($2.5 m) ($2.5 m)
Balance sheet
Operating income before income tax $68.1 m $71.6 m + $3.5 m
• Creation of a right of use asset
and lease liability on 1 July 2019 Non operating income / (expenses)
for $46m
Depreciation - property, plant and equipment ($0.5 m) ($0.5 m)
• Both are excluded in the
calculation of gearing Lease depreciation ($2.5 m) ($2.5 m)
Other Lease interest expense ($2.2 m) ($2.2 m)
• No change in Precincts Unrealised net gain / (loss) on financial instruments ($2.0 m) ($2.0 m)
definition of operating income
and will be excluded for AFFO Net profit before taxation $65.6 m $64.4 m ($1.2 m)
• Dividend will not be impacted Net profit after income tax attributable to equity holders $55.5 m $54.3 m ($1.2 m)
• No impact to cashflow Total comprehensive income after tax attributable to
$54.8 m $53.6 m ($1.2 m)
equity holders
PRECINCT PROPERTIES, FY20 INTERIM RESULTS PRESENTATION - Page 32App 3: P&L
31 December 31 December
Unaudited for the 6 months ended
Note 1: 2019 2018
• Operating income is Net property income $49.2 m $47.3 m
calculated on a pre
IFRS 16 basis as this Generator operating income $4.8 m -
provides a more Operating income before indirect expenses $54.0 m $47.3 m
accurate measure of
operational Other revenue $26.7 m -
performance. Lessee rent expense1 ($3.5 m) -
• IFRS 16 replaces rent Other expenses ($6.6 m) ($7.7 m)
expense with a lease
depreciation and lease Net interest expense ($2.5 m) ($1.5 m)
interest expense Operating profit before income tax $68.1 m $38.1 m
Current tax expense ($7.6 m) ($0.4 m)
Operating profit after tax (pre IFRS 16) $60.5 m $37.7 m
Deferred tax (expense) / benefit ($2.3 m) $12.6 m
Share of profit or (loss) of joint ventures - ($0.8 m)
Depreciation recovered on sale - ($10.7 m)
Depreciation - property, plant and equipment ($0.5 m) -
IFRS 16 Adjustment to lessee rent expense ($1.2 m) -
Net realised gain / (loss) on sale of investment properties - ($1.9 m)
Unrealised net gain / (loss) on financial instruments ($2.9 m) ($11.4 m)
Total comprehensive income after tax attributable to
$53.6 m $25.5 m
equity holders
PRECINCT PROPERTIES, FY20 INTERIM RESULTS PRESENTATION - Page 33App 4: AFFO reconciliation Unaudited six months
ended 31 December 2019
Total comprehensive income after tax attributable to equity holders $53.6 m
Unrealised net gain / (loss) on financial instruments $2.9 m
Deferred Tax
Deferred tax (expense) / benefit $2.3 m
Depreciation - property, plant and equipment $0.5 m
IFRS 16 lease adjustments $1.2 m
Net operating income after tax $60.5 m
Net operating income after tax 4.61 cps
Amortisation of incentives and leasing costs $4.0 m
Straight-line rents ($0.4 m)
Funds from Operations (FFO) $64.1 m
FFO per weighted security 4.88 cps
Dividend payout ratio to FFO 65%
Adjusted Funds From Operations
Maintenance capex ($2.0 m)
Liquidated damages (net of tax impact) ($19.2 m)
Investment portfolio - Incentives and leasing fees ($2.0 m)
Adjusted Funds From Operations (AFFO) $40.9 m
AFFO per weighted security 3.11 cps
Dividend payout ratio to AFFO 101%
Dividend paid in financial year 3.15 cps
AFFO calculation is based on the best practice guidelines provided for by the Property Council of Australia.
PRECINCT PROPERTIES, FY20 INTERIM RESULTS PRESENTATION - Page 34App 5: Balance sheet
Financial Position as at 31 December 2019 30 June 2019
($m) Unaudited Audited Movement
Assets
Development properties $1,013.1 $923.2 + $89.9
Investment properties $1,848.4 $1,870.5 ($22.1)
Investment properties held for sale $72.8 - + $72.8
Intangible assets $21.0 $21.1 ($0.1)
Fair value of derivative financial instruments $45.0 $42.1 + $2.9
Right-of-use assets $40.6 - + $40.6
Other $44.5 $36.5 + $8.0
Total Assets $3,085.4 $2,893.4 + $192.0
Liabilities
Interest bearing liabilities $933.3 $758.4 + $174.9
Deferred tax liability $40.6 $38.3 + $2.3
Lease liabilities $44.8 - + $44.8
Fair value of derivative financial instruments $60.9 $65.3 ($4.4)
Other $37.7 $76.5 ($38.8)
Total Liabilities $1,117.3 $938.5 + $178.8
Equity $1,968.1 $1,954.9 + $13.2
NIBD to Total Assets 28.3% 24.6% 3.8%
Liabilities to Total Assets - Loan Covenants 25.4% 24.3% 1.1%
Shares on Issue (m) 1,313.8 m 1,313.8 m
Net tangible assets per security $1.48 $1.47 0.0
Net asset value per security $1.50 $1.49 0.0
PRECINCT PROPERTIES, FY20 INTERIM RESULTS PRESENTATION - Page 35App 6: Investment portfolio overview
Key metrics Portfolio metrics
Investment
Auckland Wellington
portfolio
WALT 1 8.8 years 7.9 years 10.3 years 8.8 years
Occupancy 99% 99% 98% Weighted average lease term
Investment Portfolio Value ($m) $1,861 m $1,094 m $767 m
Weighted average market cap rate 5.7% 5.2% 6.4% 99%
NLA (m²) 234,827 m² 104,445 m² 130,381 m² Portfolio occupancy
1 Includes development leasing
Occupancy
100%
% of building NLA
80%
60%
40%
20%
0%
Auckland Wellington
PRECINCT PROPERTIES, FY20 INTERIM RESULTS PRESENTATION - Page 36Disclaimer
The information and opinions in this presentation were prepared by Precinct Properties
New Zealand Limited or one of its subsidiaries (Precinct).
Precinct makes no representation or warranty as to the accuracy or completeness of
the information in this presentation.
Opinions including estimates and projections in this presentation constitute the current
judgment of Precinct as at the date of this presentation and are subject to change
without notice. Such opinions are not guarantees or predictions of future performance,
and involve known and unknown risks, uncertainties and other factors, many of which
are beyond Precinct’s control, and which may cause actual results to differ materially
from those expressed in this presentation.
Precinct undertakes no obligation to update any information or opinions whether as a
result of new information, future events or otherwise.
This presentation is provided for information purposes only.
No contract or other legal obligations shall arise between Precinct and any recipient of
this presentation.
Neither Precinct, nor any of its Board members, officers, employees, advisers (including
AMP Haumi Management Limited) or other representatives will be liable (in contract or
tort, including negligence, or otherwise) for any direct or indirect damage, loss or cost
(including legal costs) incurred or suffered by any recipient of this presentation or other
person in connection with this presentation.
PRECINCT PROPERTIES, FY20 INTERIM RESULTS PRESENTATION - Page 37You can also read