PNE - PURE NEW ENERGY - INVESTOR RELATIONS PRESENTATION - PNE AG: Investor Relations
←
→
Page content transcription
If your browser does not render page correctly, please read the page content below
INVESTOR RELATIONS PRESENTATION

PNE – PURE NEW ENERGY

| Investor Relations Presentation | March 2020

DISCLAIMER

This presentation is for information purposes only and does not constitute a public offer or invitation to subscribe for or purchase any
securities of PNE AG and neither this presentation nor anything contained herein shall form the basis of any contract or commitment
whatsoever. This presentation is being furnished to you solely for your information and may not be reproduced or redistributed to any
other person in whole or in part.
All information contained herein has been carefully prepared. Nevertheless, we do not guarantee its accuracy or completeness.
The information contained in this presentation is subject to amendment, revision and updating. Certain statements contained in this
presentation may be statements of future expectations and other forward-looking statements that are based on the company’s current
views and assumptions and involve known and unknown risks and uncertainties. Actual results, performance or events may differ
materially from those in such statements as a result of, among others, factors, changing business or other market conditions and the
prospects for growth anticipated by the management of the Company. These and other factors could adversely affect the outcome and
financial effects of the plans and events described herein. The Company does not undertake any obligation to update or revise any
forward-looking statements, whether as a result of new information, future events or otherwise.
The distribution of this document in other jurisdictions may be restricted by law and persons into whose possession this document
comes should inform themselves about, and observe, any such restrictions. Any failure to comply with these restrictions may constitute a
violation of applicable Securities Laws.

        | Investor Relations Presentation | March 2020                                                                                 2
                                                                                                                      x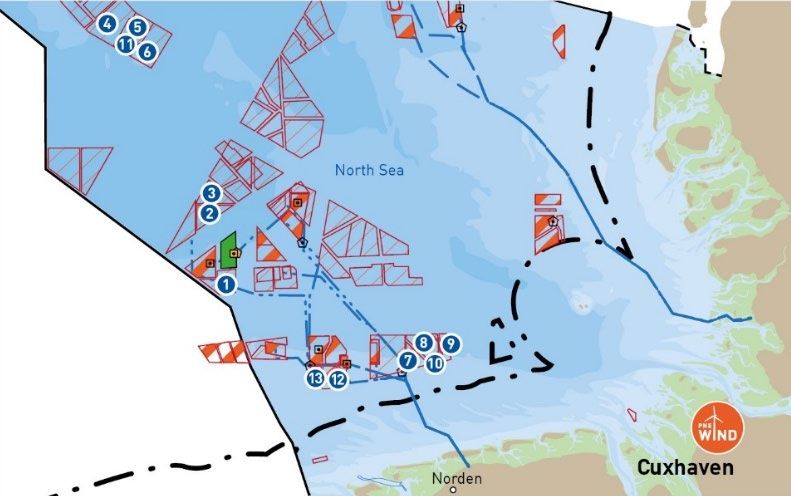
AGENDA

I.

II.

III.

IV.

       | Investor Relations Presentation | March 2020   3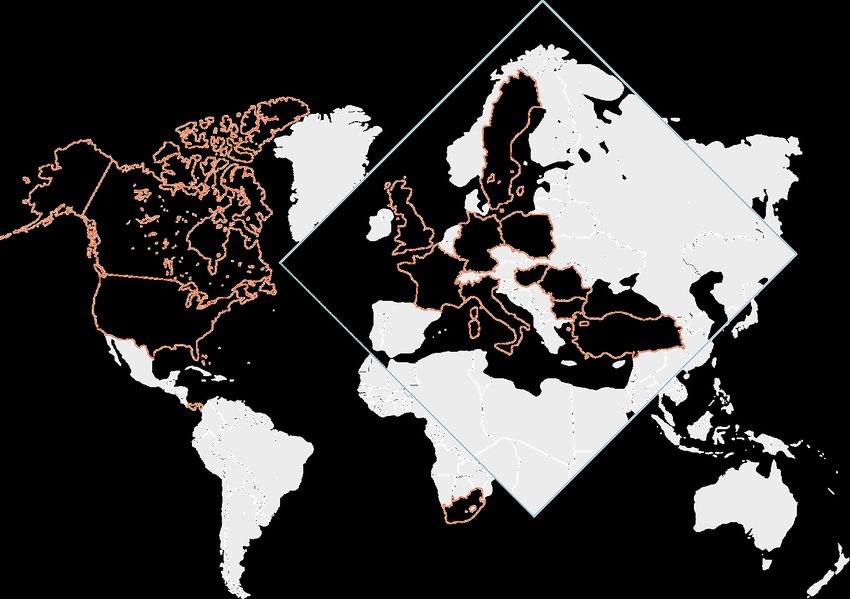
PNE – FULL OF ENERGY

» > 25 years of industry experience

» Active in 14 countries on 3 continents

» Leading developer of wind farms in Germany                 We develop and
                                                         implement projects and
» Nr. 2 O&M manager in Germany with > 1,600 MW          solutions for the planning,
                                                            construction and
» > 5,500 MW of renewable energy projects realized       operation of renewable
                                                               power plants.
» > € 10bn of investments initiated

» Attractive wind energy pipeline of > 5,000 MW

» First PV projects in development

       | Investor Relations Presentation | March 2020
PIONEERS IN THE RENEWABLE ENERGY SECTOR

                               Markus Lesser
                           Chairman of the Board                                  Jörg Klowat
                                  (CEO)                                       Chief Financial Officer
                                                                                      (CFO)

» CEO since May 2016                                     » CFO since April 2011
» COO 2011–2016                                          » Industry experience since 1999
» Industry experience since 2000                         » Finance and Accounting, Controlling, Risk Management,
» Sales, M&A, Procurement, Offshore, Communication/IR      Legal, Human Resources
» Associations: Member of the Board BDEW, Member
  of the Board WAB, Chairman of Fachgruppe Energie
  und Umwelt des Wirtschaftsrates in Lower Saxony

        | Investor Relations Presentation | March 2020                                                             5
ROBUST BUSINESS MODEL THROUGH INTEGRATION
ALONG THE VALUE CHAIN

                                                       approx. 3 – 5 years                                                                  20 years

                                                                                                                                Sale*
         Development                                       Financing                          Construction                                              Service
                                                                                                                                 IPP
  » Acquisition of site                         » Financial analysis                     » Grid connection          » Utility                     » Technical and
  » Analysis (wind / sun)                       » Legal concept                          » Infrastructure           » Infrastructure fund           commercial
                                                                                                                                                    management
  » Selection of                                » Sales/marketing                        » Assembly                 » Insurance companies
    equipment                                   » Project financing                      » Start-up of operations   » IPP
  » Permits

                                                                                                                                                  Power-
                           Wind                                                     PV                          Storage
                                                                                                                                                  to-Gas

*sale as turnkey project or project right, as single project or project portfolio

              | Investor Relations Presentation | March 2020                                                                                                        6
UNIQUE TRACK RECORD

          2012                                  2012–19                2016–17                         2017                       2017–19
      OFFSHORE                                ONSHORE               ONSHORE                       OFFSHORE                      ONSHORE
     GODE WIND                                                                                                              International project
                                      Various project sales     Wind farm portfolio               ATLANTIS I
     Pipeline Deal                                                                                                                 sales
       ØRSTED                                INVESTORS                ALLIANZ                    VATTENFALL                     PROJECTS
Gode Wind ~924 MW                    »   KGAL                 ~142MW                        Atlantis I ~584 MW             » France >100MW
                                     »   CEE
» €142m received                     »   CHORUS               » Enterprise Value (EV) >     » Low double-digit €m          » Poland ~174MW
» Up to €15m due as                  »   ALLIANZ                €330m                         payment received
  milestone payments                 »   ENBW                 » Sales price in 2016         » Further milestone payments   » Sweden ~138MW
                                     »   ENEL                   €103m for 80%                 possible
Borkum Riffgrund ~ 760 MW            »   JOHN LAING           » Subsequent sale price of                                   » USA ~80MW
                                     »   PATTERN ENERGY         €21m in 2017 and increase
                                     »   QUAERO CAPITAL         of EV to > €360m through
                                     »   STADTWERKE MÜNCHEN     optimisation of financing

        | Investor Relations Presentation | March 2020                                                                                              7
SUSTAINABLE GROWTH

EBITDA (4-year-average, in € m)                         » 4-year-time span better reflects the operative development and
                                                          profitability of the project business than on a yearly basis
                                                        » EBITDA/EBIT impacted by investments in portfolio build-up

                                                        * Adjusted for depreciation of inventories

       | Investor Relations Presentation | March 2020                                                                      8
COMFORTABLE BASIS FOR FURTHER GROWTH

Equity                                                                   Liquidity
» Equity increased by more than €130m since 2012                         » Liquidity increased by more than €70m since 2012
» Solid equity ratio despite portfolio build-up and impact from          » Liquidity position remains on high level after redemption
  „IFRS 16 Leases“                                                         of €100m corporate bond in 2018 and despite investments in
In € m                                                                     portfolio build-up

300
                            Equity                        Equity ratio
250

200

150

100

 50

  0

         | Investor Relations Presentation | March 2020                                                                                 9
OWN WIND FARM ASSET BASE GROWS

» Own wind farm asset base grows to 130.1 MW                           300
                                                                             Equity   Own wind farm assets (book value)
» Book value of own wind farms grows to €143.4m
                                                                       250
» Project financing related to own generation portfolio increases to
  €145.6m (non-recourse project financing incl. interim equity         200
  financing)
                                                                       150
» Balance sheet total increases to €567.6m
» Equity ratio decreases due to portfolio build-up and impact from     100
  „IFRS 16 Leases“ (€39.4m) – still on solid level
                                                                       50
» Liquidity position remains on high level after redemption
  of €100m corporate bond in 2018 and despite investments in            0
  portfolio build-up

         | Investor Relations Presentation | March 2020                                                                   10
LARGE 5 GW PIPELINE PROVIDES EXCELLENT
VISIBILITY BEYOND 2020
EUROPE
» Onshore wind: in MW*
Large, high-quality project
D 1.612
pipeline secures stable project
BG 121
output F 532
UK 43
CANADA
» PV: I 40
505 MW*
P 111
First projects under RO 156
development in Germany, USA, USA S 59
Romania; 432 MW* TR 700
further internationalisation H 42
planned PANAMA
352 MW*
* only wind onshore
SOUTH AFRICA
530 MW*
| Investor Relations Presentation | March 2020 11AGENDA
I.
II.
III.
IV.
| Investor Relations Presentation | March 2020 12STRONG GROWTH OF RENEWABLE ENERGY MARKET AHEAD
Key growth drivers: World electricity generation (GWh/yr)
» Global commitment to reduce global warming and ambitious 70.000.000
political targets (e.g. COP21)
60.000.000
» Renewable sourced electricity is key for decarbonisation/
CO2 reduction 50.000.000
» Growing demand for renewable energy driven by economic 40.000.000
growth and geostrategic reasons 30.000.000
» Competitive renewable energies due to heavily decreasing
20.000.000
technology costs
» High demand especially for premium projects in low interest 10.000.000
environment 0
» Increasing power prices driven by the nuclear phase-out 1990 2000 2010 2020 2030 2040 2050
(Germany, France) and increasing prices for CO2 certificates Coal Oil Gas
reduce dependency on subsidies Nuclear Other renewables Hydro
Solar Wind onshore Wind offshore
Source: DNV GL – Energy Transition Outlook 2018
| Investor Relations Presentation | March 2020 13ELECTRICITY PRICES WILL INCREASE
» Electricity prices will increase as nuclear power plants go offline in Germany and France
» Prices of CO2 certificates will increase
» This will open up new business opportunities
Power price scenario Germany Historic Modelled
EUR/ 90
MWh August / September / October 2019, 6.20 ct/kWh
80
70 May 2019, 6.13 ct/kWh
60 May 2017, 5.78 ct/kWh
50 November 2017, 3.82 ct/kWh
40
30 August 2018, 6.16ct/kWh
20
February 2018, 4.73 ct/kWh
10 initiated
0
2002 2003 2004 2005 2006 2007 2008 2009 2010 2011 2012 2013 2014 2015 2016 2017 2018 2019 2020 2021 2022 2023 2024 2025 2026 2027 2028 2029
Source: PNE AG
EPEX Baseload Electricity price
Preisprojektion Spot Day Ahead
EPEX EEG
EEG Tender historical
Auction Renumeration
Auction modelled
projection electricity price tariff results modelled
| Investor Relations Presentation | March 2020 14NEW OPPORTUNITIES THROUGH INTEGRATION
OF ENERGY MARKETS
Maximising project value through:
Battery storage
» Focus on value chain after power generation
» Combination of wind, PV and storage
E-Mobility Natural gas drive
» Creating a new sales channel through the integration
of storage solutions (e.g. Power-to-Gas)
» Offering solutions to bypass grid bottlenecks Solar PV Wind Power grid Electrolysis Methanation Gas grid
Pump and Hydrogen
compressed drive
air storage
Power-to-heat Households, businesses Gas and steam
and industry power plants
Cogeneration
Electrocity flow CO2 power plants
Hydrogen Artificial natural gas
Heat supply (generated through green electricity)
Source: e/m/w 2017
| Investor Relations Presentation | March 2020 15DEVELOPING INTO CLEAN ENERGY SOLUTION PROVIDER
WITH „SCALE UP“ PROGRAMME
TECHNOLOGY OPERATIONS
- Wind - Power Generation
- PV - Smart Energy
- Storage Supply Management
- Power-to-Gas
TECHNOLOGY OPERATIONS MARKETS SOLUTIONS/
- Wind - Power Generation - Established Markets CONSULTING
- Emerging Markets - Engineering &
Financing Solutions
MARKETS SOLUTIONS/
CONSULTING - Repowering
- Established
Markets - O&M
- Repowering
- O&M
S »
C »
A »
L »
E »
| Investor Relations Presentation | March 2020 16CLEAR MID TERM TARGET: PROFITABLE GROWTH AND
REDUCED VOLATILITY
» 1. Growth
2023
Increase of output in Project development as well as in wind EBIT
farm management and reduction of cost by economies of scale target
» 2. Diversification 38–44*
€m
Increase of technological and geographical diversification and
47,8
Increase
expansion along the value chain to secure attractive margins Increase of of own generation
project output by 2023 by 2023 to up to
» 3. Visibility
Significant increase of stable, recurring earnings base and
>400 500
MW p.a. under MW
stable cash flows through organic and inorganic growth in management
Services business and build-up of own generation portfolio in O&M by 2023
>2,200
MW
* +30–50% compared to average EBIT of 2011–2016
| Investor Relations Presentation | March 2020 17STEP BY STEP EXECUTION OF STRATEGIC AGENDA
Processes & Tools
» Profit center structure introduced
Products » Newly defined processes
» IT structure unified
» Newly defined and
Organisational &
financial framework expanded product range
» Financing optimised: € 100m corporate bond paid back, € 50m
Strategy corporate bond placed
» Takeover of remaining WKN stake, transformation from AG to GmbH,
cross-company standardisation of the organisational structure
| Investor Relations Presentation | March 2020 18SCALE UP – EXECUTION FULLY ON TRACK
2023
…
2020
2019
2018 » Finalisation of
2017 » Add further new SCALE UP
» Sale of 200MW products/services
» Development of portfolio share*
» Completion of project pipeline in » Product range
» Start of ramp-up ramp-up phase » Completion and
the 1st new market of different Hybrid
phase sale of 1st
» First new » 1st PV project in Power Plants is in
» Structures/ products/services developed project place
development in new markets
People/Processes available
» Provide additional » Start the build-up
» Implement Smart » First revenues with » 1st PPA of next portfolio*
services and (Power Purchase
Development new products and expand consulting Agreement) in » Market entrance
Team Hamburg services solutions foreign markets 3rd market
» Start build-up of » Partnering » Expansion of » Market entrance » Identify remaining
200MW portfolio
» Improvement of Offshore 2nd market white spots in
financing structure Development regions, value
» Sale of 1st Hybrid chain and products
project
RAMP-UP TRANSFORM EXECUTE DELIVER
* Expansion of own power generation portfolio, envisaged sale of wind farm portfolio 2020 will not be continued
| Investor Relations Presentation | March 2020 19AGENDA
I.
II.
III.
IV.
| Investor Relations Presentation | March 2020 20HIGH PROJECT ACTIVITY IN 2019
» 450.8 MW sold, put into operation or started construction Sold,
put in operation,
(2018: 235.7 MW), highlighted by projects Jasna (132 MW)
started construction
and Malarberget (113 MW)
» Tender successes in Germany (67.8 MW) and Poland (94.8 MW) 450.8
» Assets of repowering project Papenrode (22.3 MW) acquired MW
» Scale Up – Implementation fully on track 47,8
Tender
successes
Own wind
generation portfolio
162.6 130.1
» PV pipeline expanded in Germany and international markets
» Service business internationalised and strengthened with new
products and acquisitions MW MW
» Expansion of own power generation portfolio up to 500 MW by Projects
2023 – strategy extension to minimize volatility under construction
Envisaged sale of wind farm portfolio 2020 will not be continued,
projects to be kept in own generation portfolio 311.0
MW
| Investor Relations Presentation | March 2020 21HIGH PROJECT ACTIVITY REFLECTED IN IMPROVED FIGURES
» Guidance for FY 2019 (EBITDA € 25-30m, EBIT € 15-20m)
achieved or slightly exceeded EBITDA
» Total output (€ 174.0m, +55% yoy) and operating result
(EBITDA +91% yoy, EBIT +143% yoy) clearly improved yoy – 31.6
driven by international project sales €m
» Gross cash position very solid at € 111.9m 47,8
EBIT Equity
19.0 220.0
» Equity increases to € 220.0m
» Decrease of equity ratio to approx. 39% attributed to increase of
non-recourse project financing (portfolio build-up) and €m €m
application of IFRS 16 Leases
» New segment reporting introduced Cash
111.9
€m
| Investor Relations Presentation | March 2020 22EXPANSION OF OWN POWER GENERATION
» PNE Group will expand its own wind farm operations Project MW State Status
considerably in the future Kührstedt-Alfstedt 43.2 Lower Saxony in operation since Q4 2017
» Changed framework conditions and favourable financing options Gerdau-Repowering 21.6 Lower Saxony in operation since Q1 2019
led to decision Schlenzer 6.5 Brandenburg in operation since Q2 2019
» Envisaged sale of wind farm portfolio 2020 will not be continued Neuenwalde 7.2 Lower Saxony in operation since Q4 2019
Kittlitz 17.2 Brandenburg in operation since Q4 2019
» Objective of stabilising sales and earnings at a high level
Laubuseschbach 3.0 Hesse in operation since 2002
» Aim is to achieve the medium-term EBIT target of € 38-44m*
Baden-
until 2023 earlier Pülfringen 6.5 in operation since 2002
Württemberg
» Individual projects, particularly abroad, will still be marketed Baden-
Erfeld 2.6 in operation since 2002
Württemberg
» Own generation portfolio currently consists of 130.1 MW of Papenrode 22.3 Lower Saxony in operation since 2002
onshore wind projects Total 130.1
» Power generation Total output** at €19.4m in FY 2019 (2018:
€18.2m), EBITDA** at €14.0m in FY 2019 (2018: €13.9m)
* as defined in Scale up strategy
** incl. Silbitz
| Investor Relations Presentation | March 2020 23WELL-FILLED PROJECT PIPELINE WIND ONSHORE
Country I – II III IV Total MW
Sold/ Germany – Good activity despite delays in permitting process
Services » Gerdau-Repowering (21.6 MW), Schlenzer (6.5 MW),
Germany 1,251 361 0 1,612 20
Kittlitz (17.2 MW) and Neuenwalde (7.2 MW) completed
Bulgaria 121 0 0 121 0
France 271 261 0 532 0 and put in operation
United Kingdom 43 0 0 43 0 » Wölsickendorf (16.8 MW) sold to CEE Group
Italy 40 0 0 40 0 France – Strong momentum continues
Canada 505 0 0 505 0 » Project Laperrière (19.2 MW) completed
Panama 352 0 0 352 0
Poland 92 19 0 111 174 Sweden – Project sold
Romania 54 102 0 156 0 » Malarberget (113 MW) sold to Enlight Renewable Energy
South Africa 500 30 0 530 0 » Project Laxaskogen (25.2 MW) completed
Sweden 0 59 0 59 113
Poland – Project sold
Turkey 629 71 0 700 0
Hungary 0 42 0 42 0
» Jasna (132 MW) sold to Stadtwerke München
USA 266 166 0 432 0 » Construction management for Barwice (42 MW)
Total 4,124 1,111 0 5,235 307 Panama – Pipeline acquired
Phase I – II = Exploration & Development As of December 31, 2019 » 5 projects with approx. 352 MW
Phase III = Planning
Phase IV = Implementation till handover USA – Project sold
Sold/Services = sold, but construction management services by PNE » Burleigh sold to Burke Wind, LLC
| Investor Relations Presentation | March 2020 24FURTHER MILESTONE PAYMENTS EXPECTED FROM SOLD
OFFSHORE WIND PROJECTS
8 projects sold
» 4 projects already in operation
Active as service provider for projects sold
» Consultant agreements in place with Ørsted & Vattenfall
Further milestone payments expected
1
» Up to € 15m from Gode Wind 4 2
3
Zone Sold projects Phase #WEA Total MW Sold to
4
1 Borkum Riffgrund 1 8 78 312 Ørsted (DONG)
5
1 Borkum Riffgrund 2 8 56 448 Ørsted (DONG)
6
1 Gode Wind 1 & 2 8/8 55 + 42 582 Ørsted (DONG)
7
1 Gode Wind 3 & 4 5/5 30 242 Ørsted (DONG)
8
2 Atlantis I 3 73 584 Vattenfall
9
4 HTOD5 (Nautilus II) 2 68 476 Ventizz/Hochtief
10
Total 402 2,644
11
Phase 2 = Application conference held, 3 = Hearing held, 12
4 = Approval granted, 5 = Grid connection, 6 = Investment decision,
13
7 = Under construction, 8 = In operation
*Project sold, PNE active as service provider
| Investor Relations Presentation | March 2020 25PROJECT PIPELINE PV
Country I – II III IV Total MWp Improved conditions for PV projects
Germany 10 0 0 10 » Photovoltaic installations have become increasingly cost-effective
Romania 112 0 0 122 and thus more marketable in the area of electricity generation
USA 1 0 0 1 » Legal and economic framework conditions for the development of
Total 123 0 0 123 photovoltaic projects are in place in many countries
Phase I – II = Exploration & Development As of December 31, 2019 Additional markets and projects are being evaluated
Phase III = Planning
Phase IV = Implementation till handover » Numerous markets are currently being examined in detail and the
first rights are being secured
» Particular attention will initially be paid to Germany, France, Italy,
Romania and the USA as well as other international markets
| Investor Relations Presentation | March 2020 26CLEARLY IMPROVED RESULTS
» FY 2019 result driven by international project sales and In € m FY 2019 FY 2018
strategic expansion Sales 132.8 91.4
» Total output increased by 55% yoy, EBITDA +91% yoy, Work in progress 36.6 15.1
Other income 4.7 5.3
EBIT +143% yoy
Total output 174.0 111.8
» Operating performance and earnings driven by: Cost of materials -93.0 -36.7
» International project sales in Poland and Sweden Personnel -30.6 -27.8
» Sale of project Wölsickendorf in Germany Others -18.9 -20.1
Impairment on offshore inventories 0 -10.8
» Results from Power Generation and Service
EBITDA 31.6 16.5
» Build-up of wind farm portfolio Depreciation -12.6 -8.7
» Financial result burdened by higher interest expenses due to EBIT 19.0 7.8
valuation of interest rate swaps (€ 4.3m) Financial result -11.7 -9.8
EBT 7.3 -2.0
Taxes -6.0 -0.4
Non-controlling interests 0.7 -1.4
Net income 0.7 -1.0
EPS (in €) 0.01 -0.01
EPS (in €) Diluted 0.01 -0.01
| Investor Relations Presentation | March 2020 27GROWTH IN ALL BUSINESS SEGMENTS
FURTHER DIVERSIFICATION OF BUSINESS
» Project development Total output* EBITDA*
In € 250,0
m In € m
» Project development output grows to €154.4m (+57%),
primarily driven by international project sales 50,0
200,0
» EBITDA grows to €25.5m (+221%)
40,0
» Services 150,0
30,0
in Euro million
» Services output grows to €18.4m (+55%),
in Euro million
mainly driven by new service offerings 100,0 20,0
» EBITDA increases to €5.2m (+29%), despite integration and 10,0
restructuring costs of acquired companies 50,0
0,0
» Electricity generation
0,0
» Power generation output increases to €19.4m (+6%) -10,0
2018 2019 2018 2019
» EBITDA increases slightly to €14.0m (+1%), due to increase -50,0 -20,0
of own power generation capacities and despite positive one-
Project Development Electricity Generation
off effect in 2018 (€4.2m)
Services Consolidation
* Comparability to previous year’s figures is limited due to new segment structure
| Investor Relations Presentation | March 2020 28BALANCE SHEET REMAINS ROCK SOLID
Property, Plant and Equipment in €m as of December 31, 2019 (as of December 31, 2018) Equity
» Transformer stations €13.2m 567.6 (452.6) » Equity ratio solid at 39%
» Land and building €11.2m Intangible Assets
64.7
(65.1) Non-current debt
» Own wind farms €143.4m
220.0
Equity
» Corporate bond 2018/23 (€50m, 4%)
(216.3)
Rights of use Property, plant and 174.1 » Liabilities to banks €135.6m,
equipment (96.1)
» First time application of “IFRS 16 Leases” mainly project financing (non recourse)
» Liabilities from leasing contracts (rights of use)
Inventories Rights of use 39.4 (0.0) €37.2m
Other 24.4 (19.9)
» Advance payments €23.4m 234.0 Non-current
Inventories 101.4 (142.0) debt Current liabilities
» Offshore €16.5m (117.3)
» Liabilities to banks €10.3m, mainly project
» Onshore Germany €33.8m Receivables and 51.7 financing (non recourse)
other assets (25.1)
» Onshore International €27.3m
» Liabilities from leasing contracts (rights of use)
111.9 113.6 Current
Cash €3.1m
Liquidity (129.1) (94.3) liabilities
» Cash position €111.9m
Assets Equity
Equityandand
Liabilities
liabilities
(rounding differences possible)
| Investor Relations Presentation | March 2020 29EARLY EXTENSION OF STRATEGY TO
FURTHER REDUCE VOLATILITY
» Increase own power generation portfolio in Germany (sale of wind farm portfolio 2020
will not be continued)
» Individual projects, particularly abroad, will still be marketed
» High project activity due to high number of MW under construction (311 MW)
» Well-filled project pipeline (5.235 MW wind, 123 MWp PV)
» Expand into new markets and services according to our Scale up milestones
» Guidance for FY 2020: EBITDA of € 15-20m and EBIT of € 5-10m Guidance FY 2020:
EBITDA
€15–20m
EBIT
| Investor Relations Presentation | March 2020
€5–10m
iStockAGENDA
I.
II.
III.
IV.
| Investor Relations Presentation | March 2020 31PNE SHARES
PNE vs. RENIXX vs. ÖKODAX Basic information*
Indexed to 100% WKN/ISIN A0JBPG/DE000A0JBPG2
240% Number of shares 76.603.334
PNE AG Shares
Aktie RENIXX ÖkoDAX
220% Market capitalization approx. €295m
200% Market segment Prime Standard
180% Indices CDAX Technology, ÖkoDAX
160%
Designated Sponsors/Market Maker Commerzbank, Baader Bank
140%
Reuters/Bloomberg PNEGn/PNE3
120%
100% Analyst recommendations*
80% Recommen-
Bank Price target Analyst
dation
60%
M.M. Warburg Hold € 4,30 Jan Bauer
40%
First Berlin Add € 4,00 Karsten v. Blumenthal
SMC Hold € 4,30 Holger Steffen
Baader Helvea Reduce € 4,20 Laura Lopez Pineda
* as of March 26, 2020
| Investor Relations Presentation | March 2020 32PNE BONDS
Corporate bond Corporate bond 2018/2023 Coupon 4%
(WKN: A2LQ3M) Volume: €50m
130
Corporate
Anleihe bond 2018/2023
2018/2023
120
110
100
90
80
70
| Investor Relations Presentation | March 2020 33CONTACT & FINANCIAL CALENDAR
Rainer Heinsohn Financial Calendar
Head of Communication Publication of Annual Report 31.03.2020
Tel: +49 (0) 4721 – 718 - 453 Publication of Financial Report Q1 13.05.2020
Fax: +49 (0) 4721 – 718 - 373 Publication of Financial Report Q2 12.08.2020
E-Mail: rainer.heinsohn@pne-ag.com Publication of Financial Report Q3 11.11.2020
Analyst Conference/Frankfurt November 2020
Christopher Rodler
Head of Investor Relations
Tel: +49 (0) 40 879 331 14
Fax: +49 (0) 4721 – 718 - 373
E-Mail: christopher.rodler@pne-ag.com
| Investor Relations Presentation | March 2020 34You can also read