Investor Relations Presentation
←
→
Page content transcription
If your browser does not render page correctly, please read the page content below
Investor Relations
Presentation

August 2018
Disclaimer

This presentation is for information purposes only and does not constitute a public offer or invitation to subscribe for or purchase any securities of
PNE AG and neither this presentation nor anything contained herein shall form the basis of any contract or commitment whatsoever. This
presentation is being furnished to you solely for your information and may not be reproduced or redistributed to any other person in whole or in
part.
All information contained herein has been carefully prepared. Nevertheless, we do not guarantee its accuracy or completeness.
The information contained in this presentation is subject to amendment, revision and updating. Certain statements contained in this presentation
may be statements of future expectations and other forward-looking statements that are based on the company's current views and assumptions
and involve known and unknown risks and uncertainties. Actual results, performance or events may differ materially from those in such statements
as a result of, among others, factors, changing business or other market conditions and the prospects for growth anticipated by the management
of the Company. These and other factors could adversely affect the outcome and financial effects of the plans and events described herein. The
Company does not undertake any obligation to update or revise any forward-looking statements, whether as a result of new information, future
events or otherwise.
The distribution of this document in other jurisdictions may be restricted by law and persons into whose possession this document comes should
inform themselves about, and observe, any such restrictions. Any failure to comply with these restrictions may constitute a violation of applicable
Securities Laws.

PNE AG    II Investor Relations Presentation   II   August 2018                                                                                    2
Agenda

            I.        Company Profile & Business Model           4

           II.                                                   11

           III.                                                  25

PNE AG   II Investor Relations Presentation   II   August 2018        3
Who we are

PNE WIND becomes PNE – Pure New Energy

PNE AG   II Investor Relations Presentation   II   August 2018   4

Who we are

We are a leading developer of wind energy projects…

• PNE Group, consisting of the companies                         • Germany’s most successful
  PNE AG and WKN AG, is a leading wind farm                        project developer with
  developer located in Northern Germany                            8 Offshore projects
  >2,600 MW realised onshore                                       sold totaling 2,852 MW

    • Nr. 2 player in operations &
      management in Germany with
         >1,500 MW under
         management

                •   > € 9bn Euros of
                    investment done or initiated                  • Active in 13
                                                                             countries
                                                                    on 3 continents

                       …with a strong market position – nationally and internationally
PNE AG   II Investor Relations Presentation   II   August 2018                                 5
Who we are

We have a dedicated & experienced management team

• Seasoned wind energy pioneers with strong industry knowledge and large network

                    Markus Lesser                                      Jörg Klowat                        Kurt Stürken
                     Chairman of the                                   Chief Financial                    Chief Operating
                      Board (CEO)                                      Officer (CFO)                       Officer (COO)

•   CEO since May 2016                               • CFO since April 2011              • COO since September 2016
•   COO 2011 - 2016                                  • Industry experience since 1999    • Industry experience since 1995
•   Industry experience since 2000                   • Finance and Accounting,           • Project Development,
•   Sales, M&A, Procurement,                           Controlling, Risk Management,       Implementation, International
    Offshore, Human Resources,                         Legal                               Markets
    Communication

PNE AG    II Investor Relations Presentation   II   August 2018                                                             6
What we do

  We have a successful business model

    Development                    Financing                    Construction              Sale               Service
                                                                                           IPP

• Acquisition of             • Financial                    •   Grid connection   • IPP                • Technical and
  the site                     analysis                     •   Infrastructure    • Utility              commercial
• Wind analysis              • Legal concept                •   Assembly          • Infrastructure       management
• Selection of               • Sales/                       •   Start-up of         fund
  equipment                    marketing                        operations
• Permits                    • Project financing

  Development, planning,                              Premium, bankable                       Covering the entire value
  construction and operation                          projects with high certainty            chain – from a single source
  of wind farms onshore and                           of realization
  offshore

  PNE AG   II Investor Relations Presentation   II   August 2018                                                         7
What we achieved

    We generated strong earnings from 2011 – 2017…

          100
           90          Average EBIT 2011-2017                                             Ø EBIT of € 28.1m
                                                                                          - In average, an EBIT of € 28.1m
           80          Annual EBIT
                                                                                            was achieved per year
           70
           60                                                                             Ø EPS of € 0.29
           50                                                                             - In average, an EPS of € 0.29 was achieved
in € m.

           40                                                                               over the last seven years
           30
           20                                                                             Ø Dividend of € 0.08/share
                                                                                          - An average dividend of € 0.08/share
           10
                                                                                            was paid per year
            0
                  2011        2012       2013          2014        2015     2016   2017

      …and consistently delivered on our targets

                GUIDANCE                               GOAL                                ACHIEVED

                2011 – 2013                            € 60 – 72m                           € 64m

                2014 – 2016                            € 110 – 130m                         € 110m

                2017                                   € 17 – 23m (old: 0 – 15m)            € 23.1m

    PNE AG        II Investor Relations Presentation    II    August 2018                                                               8
What we achieved

           Financials improved significantly since 2011

                             Equity                                                     Output & Earnings                                        Liquidity
          350          Equity
                       Eigenkapital      EK-Quote
                                         Equity ratio 60%                      100                                              200                 Cash
                                                                                                                                                    Cash
                                                                                             EBIT
                                                                                             EBIT
                                              53%                               90                                              180
          300                                             50%
                      48%                           48%                         80           EBIT 3-Jahres-
                                                                                             EBIT  three                        160
          250                                                                                Durchschnitt
                                                                                             year average
                                                                                70                                              140
                                                          40%
                                  38%
                                                                                60                                              120
          200               34%         34%

                                                                                                                      in € m.
                                                                     in € m.
in € m.

                                                          30%                   50                                              100
          150
                                                                                40                                               80
                                                          20%
          100                                                                   30                                               60
                                                                                20                                               40
           50                                             10%
                                                                                10                                               20
              0                                           0%                     0                                                  0
                  2012 2013 2014 2015 2016 2017                                      2012 2013 2014 2015 2016 2017                       2012 2013 2014 2015 2016 2017

          ✓       Equity increased by more than                                ✓     Total output clearly increased             ✓       Continuous increase of liquidity
                  € 150m                                                       ✓     Ø EBIT of more than € 28m
          ✓       Solid equity ratio despite volatile                                between 2011 and 2017
                  earnings                                                     ✓     Cumulative EBIT of ca. € 130m
                                                                                     over the last three years

           PNE AG       II Investor Relations Presentation      II         August 2018                                                                                9
Track Record
Major deals in recent years
2012 2012-15 2015 2016-17 2017
OFFSHORE ONSHORE ONSHORE ONSHORE OFFSHORE
GODE WIND Various UK Wind farm
ATLANTIS I
Pipeline Deal Project sales Pipeline Deal portfolio
DONG INVESTORS BROOKFIELD ALLIANZ VATTENFALL
Gode Wind • KGAL PNE WIND UK ~ 142.5 MW of Atlantis I ~584 MW
~ 924 MW • CEE 1,200 MW of projects
• CHORUS projects • Low double
• Payments of • ALLIANZ • Enterprise value digit € m payment
€134m received • ENBW • GBP 40m upfront (EV) > €330m • Further milestone
• Up to €24m due • ENEL payment • Sales price in 2016 payments expected
as milestone • JOHN LAING • Up to GBP 63m €103m for 80%
payments in milestones • Subsequent sales
possible till 2021 price of €21m in
B. Riffgrund 2017 and increase
~ 760 MW of EV to > €360m
through optimiza-
tion of financing
PNE AG II Investor Relations Presentation II August 2018 10Agenda
I. 4
II. Market & Strategy 11
III. 25
PNE AG II Investor Relations Presentation II August 2018 11Market & Growth Drivers
Markets are becoming more integrated…
Electricity flow
Hydrogen
Battery
Battery storage
storage
Artificial natural gas
(generated through
green electricity)
Heat supply
E-Mobility Natural gas drive CO2
Solar PV Wind Power grid
Power grid Electrolysis
Power grid Methanation Gas grid
Hydrogen drive
Pump
and
compressed
air storage
Gas and steam power plants
Power-to-heat Households, businesses, industry Cogeneration power plants
Source: e/m/w 2017, PNE AG
PNE AG II Investor Relations Presentation II August 2018 12Market & Growth Drivers
Auction systems become the norm…
Global overview of renewable energy auctions
Countries with auctions or renewable energy tenders in use or planned
Onshore wind bids
Solar PV bids
Germany (2017) 42 €/Mwh
Germany (2017) 60 €/Mwh
UK (2015) $69.35/Mwh
Canada (2017) $85.94/Mwh
Spain (2017) 39 €/Mwh Italy (2016) 58 €/Mwh
Egypt (2016) $29.1/Mwh Dubai (2016) $30/Mwh
Mexico (2016) $35.85/Mwh
India (2017) $37.24/Mwh
Mexico (2016) $21.04/Mwh
Marokko (2016) $30/Mwh Abu Dhabi (2016) $24.2/Mwh
Peru (2016) $37.2/Mwh
Zambia (2016) $60.2/Mwh
Chile (2016) $21.9/Mwh
South Africa (2016) $38.32/Mwh
Chile (2016) $29.1/Mwh
Argentinia (2016) $49/Mwh
Argentinia (2016) $59/Mwh
Challenges in the current market
• Regulatory uncertainties
• Auctions for grid connections and tariffs
• Growth (in MW) in established markets is stagnating, returns are decreasing
Source: Bloomberg New Energy Finance
PNE AG II Investor Relations Presentation II August 2018 13Market & Growth Drivers
… and are significantly impacting project pricing
• Increasing market competition, also between various technologies in the renewable energy sector
• Fast decreasing tariffs in auctions – Solar PV is catching up
• Current price trends in tender markets partly anticipate future technological developments and cost
reduction effects
• Larger projects require higher security deposits and greater need for pre-financing
Announced wind and solar PV auction prices by commissioning date
180
160
140
Onshorewind
Onshore windaverage
averageauction
auctionprice
price
120
SolarPV
Solar PVaverage
averageauction
auctionprice
price
USD/MWh
100
80
60
40
20
0
2012 2013 2014 2015 2016 2017 2018 2019 2020
Source: Renewables 2017, IEA
PNE AG II Investor Relations Presentation II August 2018 14Market & Growth Drivers
…But growth drivers are fully intact
Minimum prices for CO2
emissions
PNE AG II Investor Relations Presentation II August 2018 15Market & Growth Drivers
Electricity prices will increase
• Electricity prices will increase as nuclear power plants will go offline in Germany and France
• Prices of CO2 certificates will increase
• This will open up new business opportunities (e.g. project sold in Sweden relies solely
on forecasted energy pricing)
Electricity prices Germany
Historical Modelled / Auctioned
100
90
80
70 Auction May 2017, 5,78 ct/kWh
EUR/MWh
60
50
40
30
20 Auction August 2017, 4,29 ct/kWh
10
0
2002 2003 2004 2005 2006 2007 2008 2009 2010 2011 2012 2013 2014 2015 2016 2017 2017 2018 2019 20202021
2021 2022
2022 2023
20232024 2025 2026 2027 2028 2029 2030
H1 H2
EEX Electricity 1-Year Future FiT tariffs
FiT tariffs Auction
Auctionresults
results Price
Priceprojection
projection
Source: PNE AG
PNE AG II Investor Relations Presentation II August 2018 16Market & Growth Drivers
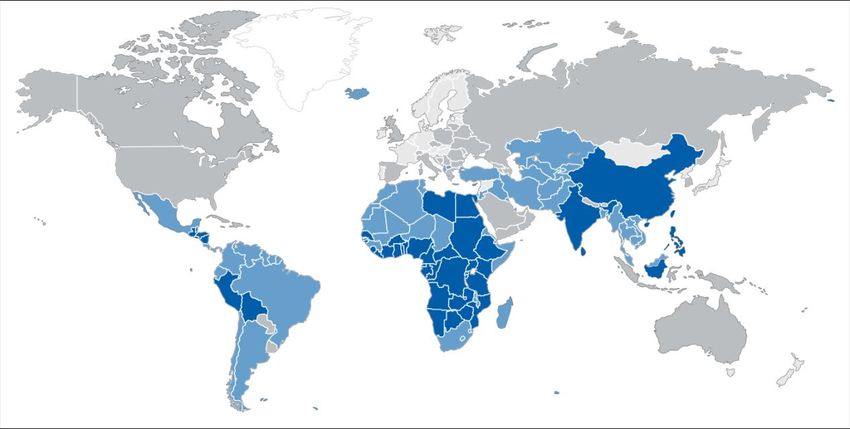
While established markets are stagnating,
growth will be mainly driven by emerging markets
• By 2020 more than 40 countries could
each install >1GW of wind energy
• Diverse development stages
in the different markets offer
different risk / reward profiles
• Emerging markets will experience
a strong increase in energy demand
due to growing populations und
economies
• Ca. 7,200 GW are necessary by 2040
to meet increasing electricity demand
and planned power plant shutdowns
WEAKEST WEAK STRONG STRONGEST
Source: Bloomberg New Energy Finance, Make Consulting, Baringa Analysis
PNE AG II Investor Relations Presentation II August 2018 17Market & Growth Drivers
Growth trend of renewable energies remains unbroken
and will continue in the future
• Wind and Solar PV will grow significantly and offer huge market potential in the short, mid and long term
• Will increasingly replace electricity generation from conventional energy sources
Global electricity production by generation type
70
Solar PV
60 Offshore Wind
50 Onshore Wind
Market potential
Solar PV
Hydro
Hydro
PWh/yr
40
Offshore Wind Other
Other
30
Gas-fired
Gas-fired
Onshore Wind
20 Nuclear
Nuclear
Oil-fired
Oil-fired
10
Coal-fired
Coal-fired
0
2015 2020 2025 2030 2035 2040 2045 2050
Source: DNV GL 2017
PNE AG II Investor Relations Presentation II August 2018 18Strategy
We are setting the course for the future:
We are developing
into a Clean Energy
Solution Provider
PNE AG II Investor Relations Presentation II August 2018 19Strategy
We are expanding our business:
SCALE
UP
SOLUTIONS Provide clean energy solutions
CORE Grow our core business
ADAPT Optimize our structures
PROJECT CLEAN ENERGY
LEVERAGE Leverage our expertise
DEVELOPER SOLUTION PROVIDER
EXPAND Expand along the value chain
We develop and implement We develop and implement projects
wind farms onshore as and solutions for the planning,
well as offshore. construction and operation of
renewable energy power plants.
PNE AG II Investor Relations Presentation II August 2018 20Strategy “Scale Up”
We capitalize on our core competencies…
Project development
• Will remain core business
• Significant volume increase above
400 MW p.a. across various
technologies in the mid term
• International markets will drive growth
• Combination of new technologies and
markets creates huge market potential
Strategic Portfolio
• Build-up of an onshore project
Services
portfolio of ca. 200 MW in
• Grow O&M business to >2200 MW
Europe by end of 2020
under operational management
• Optimization and sale – partially
• Start smart energy supply
or completely
management
• Acquisition of existing wind farms
• Expand consulting solutions and
over 15 years old for repowering
and acquisition of already well deliver everything necessary
developed projects around operation and optimization
for wind farms
…to open up further elements of the value chain
PNE AG II Investor Relations Presentation II August 2018 21Strategy “Scale Up”
We will drive down costs…
Reduction of Project costs Reduction of Overhead costs
1. Economies of Scale • Reduction of personnel costs
• Increase development output to • Reduction of other expenses
400 MW p.a. across all technologies
• Procurement synergies
• Increase Strategic Portfolio size
to 200MW • Strengthening of core processes
• Increase MW under operational • New IT solutions to improve efficiency SCALE
management to >2,200 and communication
2. Cost Reductions
• e.g. through cooperations with wind
turbine manufacturers
UP
• DEVEX
• CAPEX
• OPEX
3. Higher Energy Output
• More efficient wind turbines
PNE AG II Investor Relations Presentation II August 2018 22Strategy “Scale Up”
…and invest to increase our competitiveness
Smart Capital Allocation Investment
• Optimisation of financing structure Investment of € 10m p.a. on average for:
• € 100m corporate bond (8% coupon) paid • Acquisitions of companies at attractive
back successfully multiples before synergies
• € 50m growth financing secured through • Acquisition of project rights to expand the
successful placement of new corporate bond pipeline
with 4% coupon
• Investment in high potentials
• This results in a reduction of financing costs
and experts in markets
SCALE
of € 6m
• € 25mStrategy “Scale Up”
Scale Up Milestones
2023
• Finalisation of
… SCALE UP
• Add further new
2020 products/services
• Product range
• Sale of 200MW of different Hybrid
2019 portfolio share Power Plants is in
place
• Completion and
• Development of sale of 1st • Start the build-up
2018 project pipeline in developed project of next portfolio
the 1st new in new markets • Market entrance
• Completion of market • 1st PPA (Power 3rd market
2017 ramp-up phase • 1st PV project in Purchase • Identify remaining
• First new development Agreement) in white spots in
• Start of ramp-up products/services foreign markets regions, value
• Provide additional
phase available • Market entrance chain and
services and
• Structures / expand consulting 2nd market products
• First revenues
People / with new products solutions • Sale of 1st Hybrid
Processes and services • Expansion of project
• Implement Smart • Partnering Offshore
Development Development
Team Hamburg • Improvement of
financing structure
• Start build-up of
200MW portfolio
PNE AG II Investor Relations Presentation II August 2018 24Agenda
I. 4
II. 11
III. Highlights H1 2018 & Financials 25
PNE AG II Investor Relations Presentation II August 2018 25Current Business Development
Operational Highlights H1 2018
Successes in the onshore business
• Projects completed (37.5 MW): Looft, St. Martin-L‘Ars, Wangerland
• Projects under construction (66 MW): Gerdau-Schwienau, Laxaskogen, project in France
• New permits received (41.3 MW): Schlenzer, Kittlitz, Demeraucourt
• Tender wins (49.1 MW): Gerdau-Schwienau, Schlenzer, Kittlitz
Successes in the offshore business
• Further milestone payment of approx. € 4m for Gode Wind 3 from Ørsted booked
• Gode Wind 4 successful in first German Offshore tender in 2018
• Construction of Borkum Riffgrund 2 started
Progress in build up of new Wind Farm Portfolio 2020
• Repowering project Gerdau-Schwienau (21.6 MW) successful in first German onshore tender in 2018, construction
has already started
Strategy SCALE UP
• First successes in the service segment, e.g. construction management and financing for the project Wangerland
• WKN stake increased to 100% [July] - Additional synergies and productivity increases expected
PNE AG II Investor Relations Presentation II August 2018 26Current Business Development
Financial Highlights H1 2018
H1 results according to plan, earnings improve significantly yoy
• EBITDA at € 8.7m (H1 2017: € -1.8m), EBIT at € 4.1m (H1 2017: € -5.0m)
• Significant earnings increase yoy despite preparations for project implementation as well as investments in the
build-up of the „wind farm portfolio 2020“
• Earnings increase among others driven by offshore milestone payment and higher power generation
Resolutions of the AGM 2018
• PNE WIND becomes PNE – Pure New Energy
• Dividend of € 0.04 per share paid
Successful refinancing will reduce interest expenses by € 6m p.a.
• € 50m corporate bond successfully placed in the market at an attractive coupon of 4%
• € 100m / 8% corporate bond paid back on June 1
Financial basis remains strong
• Liabilities reduced by € 54.4m, Gross cash position at € 114.9m
• Equity ratio very solid at 53%
Positive outlook for FY 2018 confirmed
• EBIT of € 10-16m, EBITDA of € 20-26m expected
PNE AG II Investor Relations Presentation II August 2018 27Current Business Development
Onshore
Land I-II III IV Total MW H1 2018 Highlights:
Germany 1399 131 22 1552 • Germany
Bulgaria 121 0 0 121 • Repowering project Looft (16.5 MW) completed
France 321 124 19 464 • Wind farm Wangerland: construction completed
United Kingdom 43 0 0 43 • Repowering project Gerdau-Schwienau (21.6 MW)
Italy 70 14 0 84
successful in 1st German onshore tender in 2018,
construction has already started
Canada 505 0 0 505
• Permits for projects Kittlitz (21 MW) and
Poland 223 42 0 265 Schlenzer (6.5 MW) received
Romania 54 102 0 156 • Projects Kittlitz (21 MW) and Schlenzer (6.5 MW)
South Africa 230 30 0 260 successful in 2nd German onshore tender in 2018
Sweden 0 158 0 158 • France
Turkey 629 71 0 700 • Wind farm Saint-Martin-L’Ars (10.25 MW) put in
Hungary
operation
0 42 0 42
• Construction of another French project (19.2 MW)
USA 232 200 0 432
has started
Total 3827 914 41 4782 • Permit for project Dameraucourt (14.1 MW)
received
Phase I – II = Exploration & Development
Phase III = Planning • Sweden
Phase IV = Implementation till handover • Project Laxaskogen (25.2 MW) under construction
As of June 30, 2018 • Start of operation expected in Q1 2019
• 69 MW of own wind farms currently in operation
PNE AG II Investor Relations Presentation II August 2018 28Current Business Development
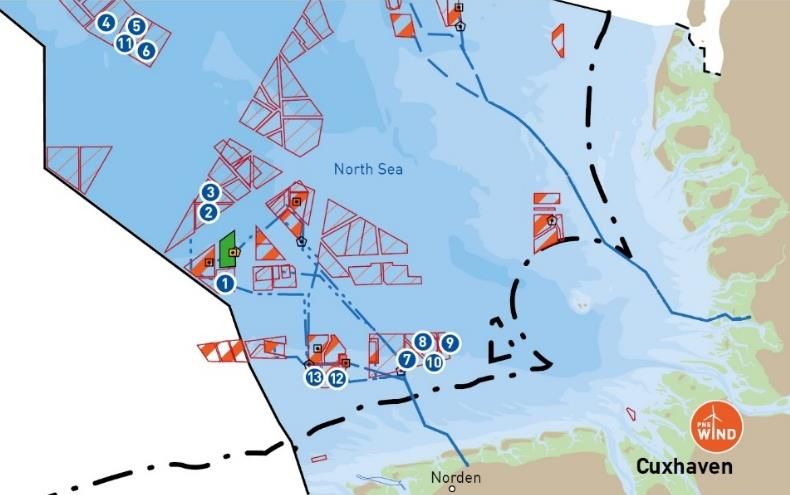
Offshore
Zone Sold projects Phase #WEA Total MW Sold to H1 2018 Highlights:
1 Borkum Riffgrund 1 8 78 312 Ørsted (DONG) • Milestone payment for Gode Wind 3 of around € 4m
1 Borkum Riffgrund 2 6 56 448 Ørsted (DONG) from Ørsted booked
1 Gode Wind 1 & 2 8/8 55 + 42 582 Ørsted (DONG) • Gode Wind 4 successful in offshore tender
1 Gode Wind 3 & 4 5/4 14 + 42 450 Ørsted (DONG) • Construction of Borkum Riffgrund 2 has started
2 Atlantis I 3 73 584 Vattenfall
• Active as service provider for projects sold
4 HTOD5 (Nautilus II) 2 68 476 Ventizz/Hochtief • Consultant agreements in place with Ørsted (DONG)
Total 428 2.852 and Vattenfall
• Further milestone payments expected
Phase 2 = Application conference held, 3 = Hearing held,
4 = Approval granted, 5 = Grid connection, 6 = Investment decision, • Up to € 19m from Borkum Riffgrund 2 and
7 = Under construction, 8 = In operation Gode Wind 4
• Regulatory Changes: Constitutional complaint filed
1 Atlantis I*
2 Atlantis II • According to WindSeeG all projects in Zone 3 to 5 will
3 Atlantis III be brought into the “Central Model” to be tendered off
4 Nemo
5 Nautilus I by the government
6 Jules Verne • Legal opinions conclude that parts of WindSeeG
7 Gode Wind 1*
8 Gode Wind 2* are unconstitutional
9 Gode Wind 3*
• A constitutional complaint has been filed in the end
10 Gode Wind 4*
11 Nautilus II* of July 2017 together with others
12 Borkum Riffgrund I*
13 Borkum Riffgrund II*
* Project sold, PNE
act as service provider
PNE AG II Investor Relations Presentation II August 2018 29Current Business Development
Income Statement H1 2018 (H1 2017)
H1 2018 Highlights: In € m H1 2018 H1 2017
Sales 28.4 39.5
• H1 results according to plan
Work in progress 6.2 8.3
• Total output at € 38.2m (€ 50.0m)
Other income 3.5 2.2
• Earnings increase significantly yoy Total output 38.2 50.0
• EBITDA at € 8.7m (€ -1.8m)
Cost of materials -7.8 -28.7
• EBIT at € 4.1m (€ -5.0m)
Personnel -13.3 -12.1
• Operating performance and earnings driven by: Others -8.3 -11.0
• Ongoing project development business and
EBITDA 8.7 -1.8
preparations for project implementation and project
sales in the remainder of the fiscal year Depreciation -4.7 -3.2
• Milestone payment for Gode Wind 3 (approx. € 4m) EBIT 4.1 -5.0
• Build-up of the „Wind farm portfolio 2020“ which is Financial result -6.0 -4.8
expected to be sold until 2020 EBT -1.9 -9.7
• Earnings accrued in the „Wind farm portfolio 2020“
Taxes 1.4 1.6
to date – which have not been realised yet – amount to
approx. € 18.8m (thereof approx. € 6.5m in H1 2018) Non-controlling interests -0.2 -1.6
• Power generation sales grow to approx. € 7.0m Net income -0.3 -6.5
(€ 3.7m) EPS (in €) 0.00 -0.08
EPS (in €) Diluted 0.00 -0.08
PNE AG II Investor Relations Presentation II August 2018 30Current Business Development
Balance Sheet H1 2018 (IFRS)
H1 2018 Highlights: • Equity at € 229.7m
• Property, Plant and 433.4 (493.3) 433.4 (493.3) • Equity ratio very solid at 53%
Equipment at € 96.7m (48% as of 31 December 2017)
Intangible Assets 66.5
• Transformer stations (66.8)
• Non-current debt at € 126.2m
€ 12.4m
• New corporate bond 2018/23
• Land and building € 11.5m (€ 50m, 4%) successfully
• Own wind farms € 65.9m
Property, plant and 96.7 229.7 Equity
equipment (103.9) (235.2)
placed in April
• 2014/19 convertible bond
• Inventories at € 109.4m
Other 16.5 € 6.4m
• Offshore € 24.7m (14.2)
• Liabilities to banks € 64.3m,
• Onshore Germany € 30.4m
which is mainly project
• Onshore International Inventories 109.4 financing (non recourse)
€ 40.1m (86.4)
• Current liabilities at € 77.5m
• Strong liquidity position 126.2 Non-current debt
Receivables and 29.4 • 2013/18 corporate bond
at € 114.9m other assets (28.0)
(78.9)
(€ 100m, 8%) paid back on
• Strong basis to fund June 1
implementation of Scale Up • Liabilities to banks € 20.7m,
strategy Cash 114.9
(194.0) 77.5 which is mainly project
Current liabilities
(179.2) financing (non recourse)
Assets
Assets Equity
Equity and
and
Liabilities
in € m as of June 30, 2018 (as of December 31, 2017)
(rounding differences possible)
PNE AG II Investor Relations Presentation II August 2018 31Current Business Development
Outlook
Onshore wind power
• Continue build-up of Wind Farm Portfolio 2020
• Continue to ride momentum in key international markets France and US (sales process for 200 MW Chilocco wind
farm is underway)
• Examination of entrance into new markets (e.g. Asia, Latin America)
Offshore wind power
• Ongoing consultant agreements with Ørsted (formerly DONG) and Vattenfall
• Explore new markets (e.g. USA)
Strategy SCALE UP
• First cooperation already started with VPC related to regional clean energy solutions
• First new products/services to become available in 2018
• Significant improvement of financing structure after successful completion of refinancing process
• Examine opportunities for inorganic growth and cooperations
Positive outlook for FY 2018 confirmed
• EBIT of € 10-16m, EBITDA of € 20-26m expected
PNE AG II Investor Relations Presentation II August 2018 32PNE AG
Stock & Bonds
3,5 120 5,5
3,3
PNE AG
PNE AGAktie
stock Corporate
Anleihe bond 2018/2023
2018/2023 5
115
3,1
110
Convertible bond
Wandelanleihe 2014/2019
2014/2019 4,5
2,9 4
2,7 105
3,5
2,5 100
3
2,3 95
2,5
2,1
90 2
1,9
1,7 85 1,5
1,5 80 1
WKN / ISIN AOJBPG / DE000A0JBPG2 Corporate bond 2018/2023 Coupon 4%
(WKN: A2LQ3M) Total volume € 50m
Number of shares Coupon 3.75%
76,556,026 Convertible bond 2014/2019
(7 August 2018) Strike price € 2.9971
(WKN: A12UMG)
Market capitalization Total volume € 6.6m
€ 192m
(7 August 2018)
Free Float Approx. 76%
Market segment Prime Standard
Indices CDAX Technology, ÖkoDAX
Designated Sponsors / Calendar
Commerzbank, ODDO Seydler Bank
Market Maker Publication of Quarterly Statement Q3 November 8, 2018
Reuters / Bloomberg PNEGn / PNE3 Analyst Conference November 2018
PNE AG II Investor Relations Presentation II August 2018 33PNE AG
CONTACT
Rainer Heinsohn
Head of Communication
Tel: +49 (0) 4721 – 718 - 453
Fax: +49 (0) 4721 – 718 - 373
E-mail: rainer.heinsohn@pne-ag.com
Christopher Rodler
Head of Investor Relations
Tel: +49 (0) 40 879 331 14
Fax: +49 (0) 4721 – 718 - 373
E-mail: christopher.rodler@pne-ag.com
Harnessing the power of the wind means for us www.pne-ag.com
connecting environmental responsibility with
corporate success
PNE AG II Investor Relations Presentation II August 2018 34You can also read