Investor presentation Creating for happier, healthier lives with love for nature. Let's imagine together - Givaudan

 
CONTINUE READING
Investor presentation Creating for happier, healthier lives with love for nature. Let's imagine together - Givaudan
Investor presentation
Creating for happier, healthier lives with love for nature.
Let’s imagine together.
Investor presentation Creating for happier, healthier lives with love for nature. Let's imagine together - Givaudan
What we do
Investor presentation Creating for happier, healthier lives with love for nature. Let's imagine together - Givaudan
Givaudan products
drive millions of consumer decisions every day!
Investor presentation Creating for happier, healthier lives with love for nature. Let's imagine together - Givaudan
Fragrance & Beauty, Taste & Wellbeing, provide our customers
compounds, ingredients and integrated solutions that engage
consumers

  Beverages      Savoury      Oral care    Personal care    Fine Fragrances

   Snacks         Dairy      Sweet goods    Household      Beauty & skin care

                                                                                4
Investor presentation Creating for happier, healthier lives with love for nature. Let's imagine together - Givaudan
How we do it
Investor presentation Creating for happier, healthier lives with love for nature. Let's imagine together - Givaudan
A unique business model driven by our purpose
Creating for happier, healthier lives with love for nature.

• Winning business assumes: being on a core supplier list, submitting a brief, developing a
  solution and being selected by the customer

• Our products are unique co-creations with our customers:
   • Consumer-differentiating, bespoke, value-added Fragrance and Beauty, Taste and Wellbeing
     solutions driven by innovation
   • Agility and service are key
   • Scent and taste determine consumer purchase and repeat decisions whilst representing only a minor
     fraction of costs 0.5-2.0% in flavours and consumer fragrances to 4-6% in fine fragrances, i.e. a
     very minor portion of the end product costs

• High barriers to entry and high shifting costs for customers

                                          Investor presentation January 2021                             6
Investor presentation Creating for happier, healthier lives with love for nature. Let's imagine together - Givaudan
A unique business model with high barriers to entry
Mastering complexity is a key feature of our space

• A research-driven innovation process and a deep understanding of consumer
  preferences around the world
• Sustainability goals creating significant innovation opportunities (e.g. move from non-
  renewable to renewable, etc.
• IP / formulae owned by Givaudan
• Mastering high complexity and volatility at every step:
   • >11,400 raw materials and a sophisticated supply chain with over 2,500 raw material suppliers
   • >122,600 products made to order, delivered just in time to >10,000 customers
   • >310,000 customer submissions / product briefs managed annually, and ca. 15% of our portfolio up
     for review due to the life cycle of products
• Compliance and regulations

                                          Investor presentation January 2021                            7
Investor presentation Creating for happier, healthier lives with love for nature. Let's imagine together - Givaudan
Operating in a significant addressable market                                                                                  Givaudan market share as of
                                                                                                                               2020

                                                                                                                               Market potential as of 2020

Givaudan’s expanded market space worth CHF 42bn

                                               +                                                 +

           Flavour & Taste                         Functional & Nutrition                            Fragrance & Beauty
           13.1 bn CHF                             14.1 bn CHF                                       14.8 bn CHF
           Market Potential as of 2020             Market Potential as of 2020                       Market Potential as of 2020
                                                   (Givaudan scope of activities)

Source: Based on Givaudan internal estimates

                                                            Investor presentation January 2021                                                      8
Investor presentation Creating for happier, healthier lives with love for nature. Let's imagine together - Givaudan
A research-driven innovation process
Supported by unrivalled capabilities and innovation
                                                                                                    Update figures

                       69                        >122,600                  CHF   536 mln           > 500            > 3,600
                       Creation and              Products sold             R&D spend in        Employees in         Active
                       application               per year                  2020                Science &            patents
                       Centres                                                                 Technology

                                                       Innovation initiatives and priorities

                           Supplier enabled                          Delivering differentiating         Enabling novel consumer
                              innovation                           technologies and solutions in       experiences in Fragrances:
                          partnerships with                          Flavours, nutritional and           naturals, new sensory
                        bioscience companies                       functional ingredients (clean        experiences, sustainable
                                                                  label delivery systems, health          new molecules and
                                                                   and wellbeing solutions etc.)             precursors etc.

                                  Investor presentation January 2021                                                          9
Investor presentation Creating for happier, healthier lives with love for nature. Let's imagine together - Givaudan
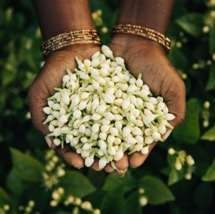
Business processes enabled by digital tools
Selected digital initiatives

    Carto - AI enabled                 Consumer and                    Robotic process
                                                                                                               Factory 2.0                       Traceability
     creative design                 customer foresight                  automation

A product creation experience:   Discover new consumer           Create a virtual workforce to         Identify how technology can       Guarantee traceability of
                                 behaviours through advanced     take over repetitive tasks,           improve the manufacturing         products and their
- Playful and multi-sensorial    analysis of social media and    creating bandwidth for more           environment:                      constituents, from source to
  human/machine interaction      other external data             value added activities                - Automation (robots,             consumer
- Smart suggestions powered                                                                               processes)
  by AI                          Capturing insights and          E.g. supply chain, HR,                - Safety (training, monitoring)   Leverage technology to
- Collaboration-oriented         converting them into business   compliance forms, etc.                - Decision making (forecasting,   enable source-to-consumer
  environment enabling           foresights                                                               predictive maintenance)        traceability of raw materials
  customer co-creation                                                                                 - Sustainability (greener
                                                                                                          processes)                     Track biodiversity impact,
                                                                                                                                         carbon footprint, water waste
                                                                                                                                         thanks to this traceability

                                                                  Investor presentation January 2021                                                                     10
Sustainable value creation
              Having a positive impact on nature

               Our ambition is to become a climate-                                           Protecting the environment through
               positive business (scope 1, 2, 3) before                                       industry-leading water stewardship and
               2050                                                                           waste management

               -70% absolute scope 1 +        100% renewable
Target

                                                                                Target
                                                                                              - 15% water per tonne of          - 20% waste per tonne
               2 GHG emissions between        electricity by 2025                             product by 20201                  of product by 20202
               2015 and 2030
               -20% absolute scope 3
               GHG emissions between
               2015 and 2030
Achievement

                                                                                Achievement
                                 2020                        2020                                              2020                                            2020

                            -30% scope 1+2                   81 %                                             -31 %                                          -14 %
                  GHG                        Renewable
                emissions   +11% scope 3     electricity                                        Water                               Waste

                                                                                                                                1. Use of municipal and groundwater, baseline 2009
                                                                                                                         2. Includes incinerated and landfilled waste, baseline 2015

                                                                Investor presentation January 2021                                                                           11
Sustainable value creation
Procurement practices bringing benefits to all involved
CHF      2.2 bn                  >225                                >11,400                        57%                        43%
 Raw material / consumable   People in global procurement                  Number of different         Natural                   Synthetic
      spend per year                   worldwide                          raw materials sourced     raw materials              raw materials

Sourcing for shared value
                                   Programmes                                                                  Overall impact

                                                                                                                     40
      Responsible                    Sourcing                                   Communities           Sourcing for
       Sourcing                      at Origin                                   at Source            Shared Value
                                                                                                      covers raw
                                                                                                      material
                                                                                                      categories

   Drive compliance and
 continuous improvement

Updated RS programme to be
                                  Secure supply
                                     locally
                                                                     Support producer communities
                                                                                                      Sourcing for Shared
                                                                                                      Value is rolled out in
                                                                                                                   countries
                                                                                                                               26
   launched in early 2021

                                                      Investor presentation January 2021                                                   12
Our unique positioning
A multi-year expansion, positioning Givaudan for multiple growth
opportunities
      1990s until today                         2000s until today                                          2007                              2010 until today
    Geographic expansion                     Customer diversification                                  Quest scale up                 Expanding core F&F and beyond

 • Expansion from mature to high           • Supporting growth of strong                   • F&F Market leadership secured              A combined growth and M&A
   growth markets, supporting                emerging local and regionals,                 • Further expansion across                   strategy (2015 & 2020 Plans),
   global customers expansion                e.g. private labels in Europe,                  geographies and customers                  resulted into:
 • Givaudan pioneer into India               Natura Boticario in Latam,                    • Applications portfolio
   and China in 1993-1994,                 • Further rapid expansion thanks                  expansion into: snacks, oral               •   Moving into: Health and
   Middle East in 1999                       to acquisitions: Expressions                    care, fine fragrances for women                wellness, Active Beauty
                                             Parfumées, drom, Ungerer,
                                                                                                                                        •   Becoming #1 in naturals and
                                             Golden Frog,..
                                                                                                                                            moving into adjacent food
                                                                                                                                            functional ingredients
                                                                                                                                        •   Expanding Integrated
                                                                                                                                            Solutions
                                                                                                                                        •   Expanding local and
                                                                                                                                            regionals customer base

                      SAP implementation                                                                                Givaudan Business Solutions (GBS)

                     Managing the business
                                                                                                         Enhance margins by streamlining operations and customer service
                      more consistently

                                                                  Investor presentation January 2021                                                                       13
Givaudan: A naturally-hedged portfolio
                               (products, geography, customers) for consistent growth
                                                         Savoury 38%                                   Our customers
                                                                                                       50% multi-national | 50% local and regional
                               6.3                       Beverages 32%
                               CHF billion
                               in sales                  Sweet goods 17%                                         Sales in North America          Sales in Europe, Africa and
                                                                                                                 28% of sales                    Middle East
                                                         Dairy 13%
                               58%                                                                               Production sites
                                                                                                                 12
                                                                                                                                                 36% of sales
                                                                                                                                                 Production sites
                               of sales in                                                                       Employees                       32
                               mature markets                                                                    2,879                           Employees
                                                  Taste & Wellbeing
                                                  54 % of Group sales                                                                            7,205
                               42%
                               of sales in high
                               growth markets

                               15,852                    Consumer Products    70%
                               full time                 Fine Fragrances   16%
                               employees
                                                         Fragrance Ingredients
                                                         and Active Beauty   14%
                               181
All figures as of 31.12.2019

                               locations          Fragrance & Beauty
                                                  46 % of Group sales
                                                                                                                               Sales in Latin America          Sales in Asia Pacific
                               77                                                                                              11% of sales                    25% of sales
                               production sites                                                                                Production sites                Production sites
                                                                                                                               11                              22
                                                                                                                               Employees                       Employees
                                                                                                                               2,142                           3,625

                                                                            Investor presentation January 2021                                                                    14
2020 Full Year Results
Excellent Financial Performance - 2020 Strategy delivered
2020 Full year results
Performance highlights
• Sales of CHF 6.3 billion, up 4.0% on a like-for-like* basis and 1.9% in Swiss francs
• EBITDA of CHF 1,397 million, an increase of 9.6%; comparable EBITDA margin of 22.8% up
  from 21.5% in 2019
• Free cash flow of CHF 811 million or 12.8% of sales
• Proposed dividend of CHF 64.00 per share, up 3.2% year-on-year
• Successful delivery of 2020 guidance; Over the five year period 2016-2020:
   Average like-for-like sales growth of 4.9%
   Average free cash flow of 12.6%

     “I am very pleased that in an unprecedented environment related to COVID-19, we have
     been able to deliver such a strong financial performance in 2020, as well as successfully
         delivering on all of our ambitious targets in relation to our 2016-2020 strategy.”
* Like-for-like: excludes the impact of currency, acquisitions and disposals
                                                                               Investor presentation January 2021   16
Sales performance
Good growth in both divisions
                in million CHF
                                                                         6,322

                                                                                                                            3,398
                                                                                                           2,924

                                                                                                         Fragrance &         Taste &
                                                                            Group
                                                                                                           Beauty           Wellbeing
                % 2020 growth on LFL* basis                                         4.0%                        5.4%           2.8%
                % 2020 growth in CHF                                                1.9%                        4.5%          -0.2%

* LFL (like-for-like) excludes the impact of currency, acquisitions and disposals

                                                                                       Investor presentation January 2021               17
Sales evolution by region
All regions contributing to the growth                                                                                                                    2,278
                                                                                                                                                  2,233
               in million CHF
                                                                                                                                          1,768
                                                                                                        1,630 1,602               1,641

                                                                              699 674

                                                                               FY        FY                 FY              FY      FY      FY      FY     FY
                                                                              2019      2020               2019            2020    2019    2020    2019   2020

                                                                                    LATAM                       APAC                 NOAM            EAME
               % 2020 growth on LFL* basis                                          17.6%                       0.6%                 5.7%             1.1%
               % 2020 growth in CHF                                                 -2.3%                     -1.9%                  7.2%             2.1%
* LFL (like-for-like) excludes the impact of currency, acquisitions and disposals

                                                                                      Investor presentation January 2021                                          18
Operating performance
Excellent financial performance
Sales of CHF 6,322 million, an increase of 4.0% on a
like-for-like basis* and 1.9% in Swiss francs
                                                                                                               40.8%         Gross margin
                                                                                                                                    in %
                                                                                                                                                42.1%
Gross margin of 42.1%, compared to 40.8% in 2019, as
a result of continued productivity gains, improved
                                                                                                                                                1,397
contribution of acquired companies, GBS savings and cost
discipline
                                                                                                                   1,275
EBITDA of CHF 1,397 million compared to CHF 1,275
                                                                                                                              EBITDA
                                                                                                                               in CHF million
million in 2019. Acquisition and restructuring costs of CHF
39 million, compared to CHF 25 million in 2019. Impact of
costs for GBS project of CHF 6 million in 2020, compared
with CHF 31 million in 2019

EBITDA margin of 22.1% compared to 20.6% in 2019,
with the underlying margin at 22.8% versus 21.5% in
2019                                                                                                               FY 2019                      FY 2020

                                                                                                                   20.6%      EBITDA margin     22.1%
                                                                                                As %
                                                                                                of sales                        Underlying
* Like-for-like excludes the impact of currency, acquisitions and disposals                                        21.5%      EBITDA margin
                                                                                                                                                22.8%
                                                                              Investor presentation January 2021                                          19
Free cash flow
Sustained underlying performance
                                                                                               Free cash flow
Free cash flow of CHF 811 million, compared to CHF 787                                            in CHF million
million in 2019. Free cash flow is 12.8% of sales
compared to 12.7% in 2019.                                                                                           811
Average Free cash flow over the 2016-2020 strategy
                                                                                     787
period of 12.6%

Operating cash flow of CHF 1,133 million, compared to
CHF 1,136 million in 2019

Total net investments of CHF 217 million, or 3.4% of
sales, as the Group continues to invest in growth and
information systems. The net investments in 2019 were
4% of sales, or 5.1% excluding the impact of the ZIC
transaction
                                                                                     FY 2019                         FY 2020
Net Working capital of 24.4% of sales compared to
24.0% in 2019
                                                                                     12.7%           As % of sales      12.8%

                                                Investor presentation January 2021                                              20
Strategy 2020
Responsible growth. Shared success.

                                                                                               Creating additional
                                                                                               value through 16 acquisitions
  Growing with                      Delivering with                     Partnering for         since 2014
  our customers                     excellence                          shared success
  4-5%                              12-17%                                                     CHF 1.5 bn                annualised

  Average organic sales
  growth*
                                    Average free cash
                                    flow as % of sales*
                                                                      Partner                  revenue contribution from companies
                                                                                               acquired since 2014

                                                                     of choice
                                                                                               Intention to maintain current
                                                                                               dividend practice as part of
    4.9%                                12.6%                                                  this ambition
                                                                                               • Dividend increased y.o.y every year
                                                                                                 since Givaudan was listed in 2000
        2016-2020                        2016-2020

* Over the five-year period 2016-2020

                                                          Investor presentation January 2021                                     21
Value creation through acquisitions
Expanding our portfolio
                                                                              Local and regional customers
                                                                              Naturex
                  Naturals                                                    Expressions Parfumées
                      Spicetec                                                drom
            Activ International                                               Fragrance Oils
                           Vika                                               Ungerer
             Centroflora Nutra
                       Naturex
                  Albert Vieille
                   Golden Frog
                                     Aligned with
                       Ungerer
                        Indena
                                   market trends and
                                     our strategic
                                      priorities                                 Integrated Solutions
                                                                                 Spicetec
        Active Beauty                                                            Vika
                Soliance
                                                                                 Activ International
              Induchem
                Naturex
                  AMSilk
                 Indena
                 Alderys

                                                             Ingredients
                                                             Ungerer
                                                             Albert Vieille
                                      Investor presentation January 2021                                 22
Strategy 2020 Successfully Delivered
 Highlights of key achievements 2016-2020
     Growing with our customers                      Delivering with excellence              Partnering for shared success

  High     Health and   Consumer                                Excellence
                                    Integrated                                         Innovators   Suppliers   People   Communities
 growth    well-being   preferred                              in execution
                                     solutions
 markets                 products

Expanding product and                            Successful implementation of          Strengthening global innovation
customer portfolio for growth                    Givaudan Business Solutions (GBS)     ecosystem with opening of new
                                                 with benefits of CHF 60 million per   flagship Innovation Centre in Zurich
Doubling sales in Naturals to                    annum
close to CHF 2 billion                                                                 Doubling of sales from innovation
                                                 Integration of acquired companies     linked to external collaborations
Achieving No. 1 position in Fine                 & improving financial
Fragrance                                        performance                           Launch of “Connect to win”
                                                                                       programme to accelerate innovation
Building CHF 100 million                         Establishment of the Givaudan         in partnership with suppliers
businesses in Active Beauty and in               Digital Factory in Paris
Plant based proteins                                                                   Strong improvement in employee
                                                 Earned key sustainability             engagement and in safety
Local & Regional customers                       recognitions, including CDP           performance
accounting for 54% of Group                      leadership scores & EcoVadis Gold
Sales                                            Status
Looking forward
Future value creation through our strategy 2025
OUR PURPOSE:

    Creations
                                      Creating for happier,
    Let’s imagine                        healthier lives                                    Communities
    together with                                                                           Let’s imagine
  customers that                      with love for nature.                                 together that all
      through our                                                                           communities benefit
  creations more                                                                            by working with
 people will enjoy                                                                          Givaudan
happier, healthier
              lives

                         Nature                                              People
             Let’s imagine together
                                                                             Let’s imagine together
             that we show our love
                                                                             that Givaudan is a place
           for nature in everything
                                                                             where we all love to be
                             we do
                                                                             and grow

                                                  Working
                                                to become a

                                        Investor presentation January 2021                                        25
Megatrends
Impacting 2025 strategy
         Consumer base is    Living longer and more                 Sustainability is of   COVID-19:
         growing             consciously                            high concern           E-commerce, self-care
                                                                                           and localisation gain
Trend                                                                                      importance

Impact   • Asia and Africa   • Consumer                             • Consumers will buy   • Consumers will buy
           leading the way     behaviours are                         more consciously       more online and
                               changing                             • Responsible            increase spending on
                                                                      companies will act     self-care
                                                                                           • Localisation will be
                                                                                             even more important

                                    Investor presentation January 2021                                          26
Strategy 2025
Committed to Growth, with Purpose

                   Creations                                                                       Nature
 We create inspiring solutions                                                                     We show our love for nature
  for happier, healthier lives                        GROWING                                      through impactful actions

                                                     TOGETHER
                                                      WITH OUR
                                                     CUSTOMERS

                     People                                                                        Communities
We nurture a place where we                                                                        We bring benefits to all
     all love to be and grow                                                                       communities that work with us

                                 Excellence, Innovation & Simplicity - in everything we do

                      4-5% GROWTH           PURPOSE LINKED TARGETS                           >12% FCF
                                                  Investor presentation January 2021                                         27
Best in class product offering
Leveraging the full portfolio to reach our growth ambitions

                           Flavour and taste                                              Health, wellbeing and
                           Strengthen our core                                            nutrition
                                                                                          Build market leadership

                                                                                                                    Naturals space

       Flavour and taste                                                        Natural functional ingredients
       Naturals                                                                            Colouring
       Protein                                                                           Preservatives
                                                                                          Texturants

                                                                                Natural nutritional ingredients
                                                                                          Microbiome
                                                                                          Botanicals

                                                                                                                       HW&N space

                                                 Integrated solutions
                                                  Investor presentation January 2021                                                 28
Best in class product offering
                                 Flavour and taste

                 Protein                                          Functional
                enablers                                          ingredients

             Health and
                wellbeing
        (salt, sugar, fat)

        Naturals (incl.                                           Nutritional
        biotechnology)                                            ingredients

                             Integrated solutions

                             Investor presentation January 2021                 29
Growing with all customers across all categories

                                    Deos, bath,
 Estimated              Fabric &
retail value                       shower, hair                       Fragrances       Skin care   Make-up
 (bn CHF)*             home care
                                    & oral care

                         160          200                                   50          140          70

* Source Euromonitor

                                                  Investor presentation January 2021                         30
New and superior product offering

          Biotechnology                                              Beauty
    Leverage our capabilities                                        Further expand our
     and acquisitions for our                                        offering in Active Beauty
                  ingredients

                                                                     Naturals
      Delivery systems
                                                                     Provide our customers with
           Provide the next                                          the most innovative and
      generation of bio-caps                                         qualitative ingredients

                                Investor presentation January 2021                                31
Strategy 2025
Performance commitments

            Sales growth                                                                 Free cash flow                                                       Purpose commitments

  4.0 – 5.0%                                                                    >12% of Sales                                                                         Purpose
                                                                                                                                                                   linked targets
             2021 – 2025                                                                     2021 – 2025                                                                   2021 – 2025
  Average like-for-like1 sales growth                                                  Average FCF2 as % of sales                                                  Progress towards all published
                                                                                                                                                                          purpose targets

1. Like-for-like (LFL) is defined as: (a) sales calculated using the invoicing exchange rates of the prior year, (b) excluding sales of businesses acquired from the acquisition date until the period end date, up to 12
   months from the acquisition date, and (c) excluding sales of the businesses disposed of from the disposal date until the period end date of the comparable prior period

2. Free Cash Flow (FCF) refers to operating cash flow after net investments, interest paid and lease payments

                                                                                          Investor presentation January 2021                                                                                           32
Strategy 2025
Performance commitment - Purpose linked targets

                                              People                                    Nature
                                                                                 Before 2030
                                          Before 2025
                                                                                        Our operations’ carbon
                                              Everyone on our sites will have           emissions will be cut by 70%
                                              access to mental and physical             and our supply chain emissions
                                              health initiatives, tools and             by 20%3                                 Communities
       Creations                              training2
                                                                                 Before 2030                                By 2030
   By 2030                                Before 2025                                   We will replace single-use              We will source all materials and
                                                                                        plastics with eco-friendly              services in a way that protects
       We will double our business            We will reduce our total
                                                                                        alternatives across our sites and       people and the environment2
       through creations that                 recordable injuries cases by
                                                                                        operations2
       contribute to happier, healthier       50%1
       lives1                                                                    Before 2040
                                          Before 2030                                                                       By 2030
                                                                                        Our operations’ will be climate
                                              50% of our senior leaders will            positive and our supply chain           We will improve the lives of
                                              be from high growth markets1              emissions will be cut by 50%3           millions of people in
                                                                                                                                communities where we source
                                          Before 2030                            Before 2050                                    and operate2
                                              50% of our senior leadership              Our supply chain will be climate
                                              will be women1                            positive

                                                                                                                                                             1. Baseline 2018
                                                                 Investor presentation January 2021                                          2. Baseline in process of setting   33
                                                                                                                                                             3. Baseline 2015
A strong track record of growth and value creation
Value creation history at Givaudan

                            Investor presentation January 2021   34
Key investment highlights
Givaudan has a strong track record of delivering with excellence

• A company inspired by its purpose, engaged in the B Corp certification and part of the B Builders
  Movement

• A highly resilient / defensive business model:
 • Key products that are the most important part of consumer staples and the decisive factor behind the repurchase
   decisions of consumers
 • High barriers to entry (complexity, R&D, consumer insight, regulations, etc.)
 • Competition focused on innovation, quality and service, not on price

• Natural hedges for sustainable growth:
 • Diversified exposures to all regions and market segments (including premium, private label and regional players in
   emerging markets)
 • Emerging markets/urbanisation-driven growth model

• Consistency in strategy, execution, result delivery and stability of management

                                                 Investor presentation January 2021                                     35
Value creation at Givaudan
Sustained value creation for shareholders
                                                                                                                               70
           Share price evolution vs SMI                                                   Dividend per share in CHF
                                                                                                                               60
1000%
                                                                                                                               50
 800%
                                                                                                                               40
 600%                                                                                                                          30
 400%                                                                                                                          20

 200%                                                                                                                          10

    0%                                                                                                                         0
      2000            2005          2010         2015           2020                   2000            2005   2010   2015   2020

                       Givaudan            SMI
                                      Average annual yield of
  >CHF   35 Billion                        13.3%
of Total Shareholder return since
             the IPO                       vs 4.1% of SMI

                                                                  Investor presentation January 2021                                36
Value creation at Givaudan
Dividend per share, increasing 3.2% over 2019

                                                                                                                                            54     56     58     60     62     64*
                                                                                                                              47     50
                                                                                                                       36

                                                                        19.5   20        20.6      21.5       22
                                                     17.6        18.8                                                                                                          811
                                 15.4      16.3                                                                                                                         787
                                                                                                                                            720                  703
                                                                                                                              662
                        8.1                                                                                                          604
    6.5        7                                                                                                                                    597   594
                                                                                          549
                                                                                                                       512
                                                                                                    437
                                            390
              340
                        273       295                 289
                                                                 262
    203
                                                                        157    145
                                                                                                             117

   2000       2001      2002      2003      2004      2005       2006   2007   2008       2009      2010     2011      2012   2013   2014   2015   2016   2017   2018   2019   2020

* Subject to approval of shareholders at the AGM in March 2021                 Free Cash Flow                        Dividend

                                                                                      Investor presentation January 2021                                                              37
Creating value for profit, people and the planet
Global recognition as a force for good business

       Committed to B Corp Certification, the gold
       standard for good business.

                                                                                       Givaudan has received CDP double
                                                                                       ‘A rating’ for Climate action and water
                                                                                       stewardship for the second consecutive
                                                                                       year.
        Awarded highest accolade, EcoVadis Platinum
        medal, with a score of 75/100, ranking us in the
                                                                                       And CDP leader board recognition for
        top 1%.
                                                                                       supplier engagement.

        Inclusion in FTSE4Good Index Series, ranking us
        in top 1% of performers among our peers.

                                                  Investor presentation January 2021                                             38
Disclaimer

No warranty and no liability: While Givaudan is making great efforts to include accurate and up-to-date information, we
make no representations or warranties, expressed or implied, as to the accuracy or completeness of the information
provided on this handout and disclaim any liability for the use of it.

No offer and no solicitation: The information provided on this handout does not constitute an offer of or solicitation for
the purchase or disposal, trading or any transaction in any Givaudan securities. Investors must not rely on this
information for investment decisions.

Forward-looking information: This handout may contain forward-looking information. Such information is subject to a
variety of significant uncertainties, including scientific, business, economic and financial factors, and therefore actual
results may differ significantly from those presented.

Copyright © 2021 Givaudan SA. All rights reserved.

                                                    Investor presentation January 2021                                       39
Follow us on social media
                                                                  @givaudan

Investor relations contact:
Pierre Bénaich
Head of Investor and Media Relations
T +41 22 780 9053
E givaudan.investors@givaudan.com

                             Investor presentation January 2021               40
You can also read