HALF YEAR RESULTS 2021 - 25th May 2021 - AWS
←
→
Page content transcription
If your browser does not render page correctly, please read the page content below
HALF YEAR
RESULTS 2021
25th May 2021
IMPORTANT NOTICE AND DISCLAIMER

This presentation has been prepared by Napier Port Holdings Limited (together with Port of Napier Limited, "Napier
Port"). This presentation is being provided to you on the basis that you are, and you represent and warrant that you are,         Past performance: Any past performance information given in this presentation is given for illustrative purposes only
a person to whom the provision of the information in this presentation is permitted by the applicable laws and regulations        and should not be relied upon as (and is not), a promise, representation, warranty or guarantee as to the past, present
of the jurisdiction in which you are situated without the need for registration, lodgement or approval of a formal disclosure     or the future performance of Napier Port.
document or any other filing or formality in accordance with the laws of that foreign jurisdiction.                               Future performance: This presentation contains "forward-looking statements", which include all statements other than
Information only; No reliance: This presentation is for information purposes only and you should not rely on this                 statements of historical facts, including, without limitation, any statements preceded by, followed by or that include the
presentation. This presentation does not purport to contain all of the information that you may require or be complete.           words "targets", "believes", "expects", "aims", "intends", "will", "may", "anticipates", "would", "could" or similar
The historical information in this presentation is, or is based upon, information that has been released to NZX Limited           expressions or the negative thereof. Indications of, and guidance or outlook on, future earnings or financial position or
("NZX"). This presentation should be read in conjunction with Napier Port's other periodic and continuous disclosure
announcements, which are available at www.nzx.com.                                                                                performance are also forward-looking statements. Such forward-looking statements involve known and unknown risks,
                                                                                                                                  uncertainties and other important factors beyond the control of Napier Port that could cause the actual results,
The information in this presentation does not constitute a personal recommendation or service or take into account the            performance or achievements of Napier Port to be materially different from future results, performance or achievements
particular needs of any recipient. The information in this presentation should be considered in the context of the
circumstances prevailing at the date and time of the presentation and is subject to change without notice. No person is           expressed or implied by such forward-looking statements. No assurances can be given that the forward-looking
under any obligation to update this presentation nor to provide you with further information about Napier Port. This              statements referred to in this presentation will be realised. Given these uncertainties, you are cautioned not to rely on
presentation does not constitute or form part of an offer to sell, or a solicitation of an offer to buy, any shares, securities   such forward-looking statements.
or financial products in any jurisdiction. This presentation has not been and will not be filed with or approved by any           Confidentiality and copyright: This presentation is strictly confidential and is intended for the exclusive benefit of the
regulatory authority in New Zealand or any other jurisdiction.
                                                                                                                                  person to which it is presented. This presentation should not be copied, reproduced or redistributed without the prior
Investment risk: An investment in securities in Napier Port is subject to investment and other known and unknown risks,           written consent of Napier Port. Distribution of this presentation may be restricted or prohibited by law. The copyright of
some of which are beyond the control of Napier Port. Napier Port does not guarantee any particular rate of return or the          this presentation and the information contained in it is vested in Napier Port.
performance of Napier Port.
                                                                                                                                  Acceptance: For purposes of this Notice, "presentation" shall mean the slides, the oral presentation of the slides by
No liability: Napier Port, its shareholders, their respective advisers and affiliates, and each of their respective directors,    Napier Port, any question-and-answer session that follows that oral presentation, hard copies of this document and any
shareholders, partners, officers, employees and representatives accept no responsibility or liability for, and make no            materials distributed at, or in connection with, that presentation. By attending an investor or analyst presentation or
representation, warranty or undertaking, express or implied, as to, the fairness, accuracy, reliability or completeness of,       briefing, or accepting, accessing or reviewing this presentation, you acknowledge and agree to the terms set out in this
and to the maximum extent permitted by law hereby disclaim and shall have no liability whatsoever (including, without
limitation, arising from fault or negligence or otherwise) for any loss or liability arising from, this presentation or any       Notice.
information contained, referred to or reflected in it or supplied or communicated orally or in writing to you or any other
person. The information in this presentation has not been independently verified or audited.
Financial data: All dollar values are in New Zealand dollars (NZ$ or NZD) unless otherwise stated. Any financial
information provided in this presentation is for illustrative purposes only and is not represented as being indicative of
Napier Port's views on its future financial condition and/or performance.
Investors should be aware that certain financial data included in this presentation are 'non-GAAP financial measures'.
Investors are cautioned not to place undue reliance on any non-GAAP financial measures included in this presentation,
they do not have a standardised meaning prescribed by New Zealand Generally Accepted Accounting Standards and,
therefore, may not be comparable to similarly titled measures presented by other entities, nor should they be construed
as an alternative to other financial measures determined in accordance with New Zealand Generally Accepted
Accounting Standards.

                                                                                                                                                                                                                                                         2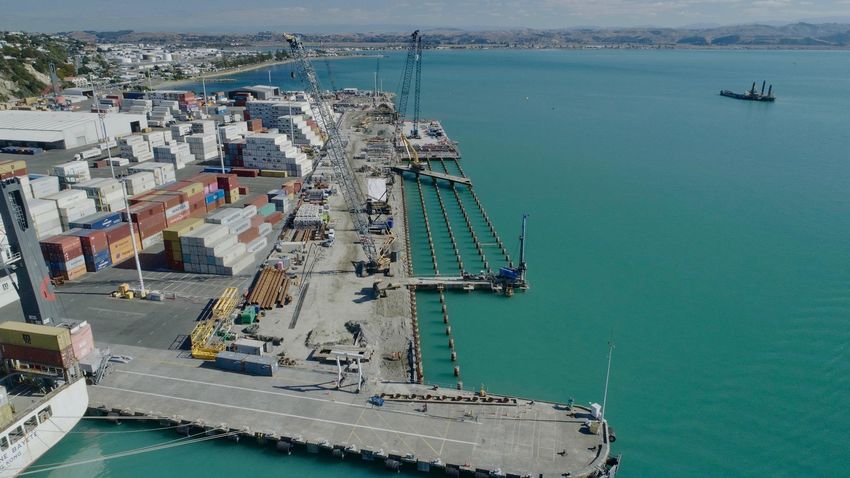
PRESENTING TODAY

       ALASDAIR MACLEOD   TODD DAWSON           KRISTEN LIE
            CHAIRMAN       CHIEF EXECUTIVE   CHIEF FINANCIAL OFFICER

                                                                       3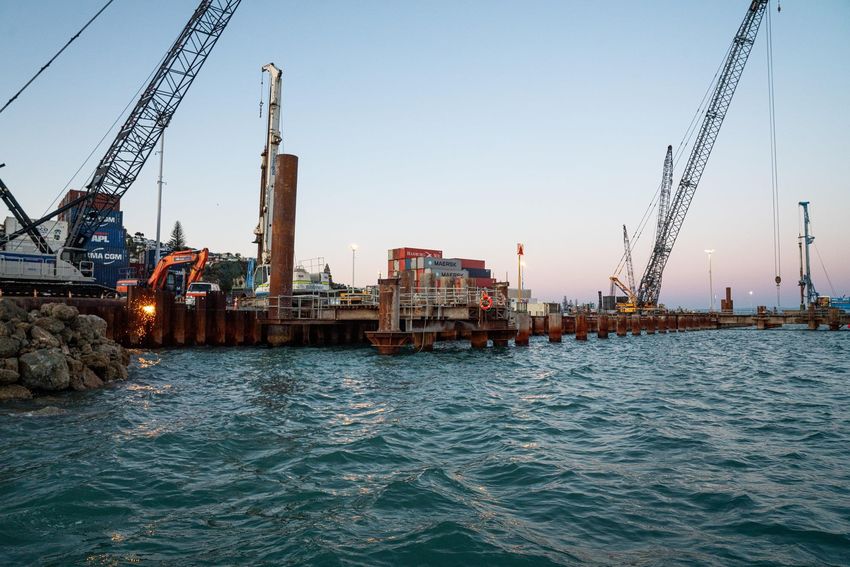
WELCOME & INTRODUCTION

COVID-19 remains a major factor in logistical supply chains

Resilient half year trading and financial result for Napier Port

Continued good progress on strategic initiatives, including 6 Wharf

Board sustainability sub-committee established

Share concerns with regional primary sector on continuing impacts of seasonal labour shortages

                                                                                                 4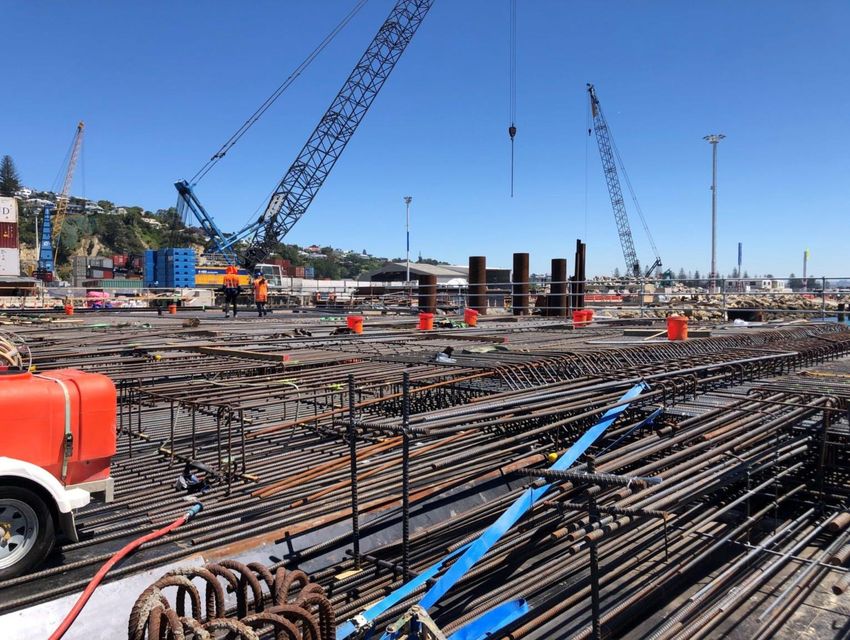
HIGHLIGHTS
HALF YEAR HIGHLIGHTS

Resilient half year revenue and earnings, despite the absence of cruise vessels

Sustained strong log export market conditions driving bulk cargo revenue growth

 Primary sector labour shortages and container supply chain challenges

Renewed WPI partnership for at least a further 10 years

Good progress on strategic development initiatives

                                                                                  6
STRATEGIC PROJECTS UPDATE

• 6 Wharf - on time and within budget
• Whakatu inland port planning
• Bulk cargo value-add projects approved
    - Mobile Harbour Crane log loading trial
    - Log debarking service
• Launch of in-house logistics service
    - Initial cargo wins
    - Napier – Palmerston North - Longburn rail capacity
•   Advanced H&S development programme

                                                           7
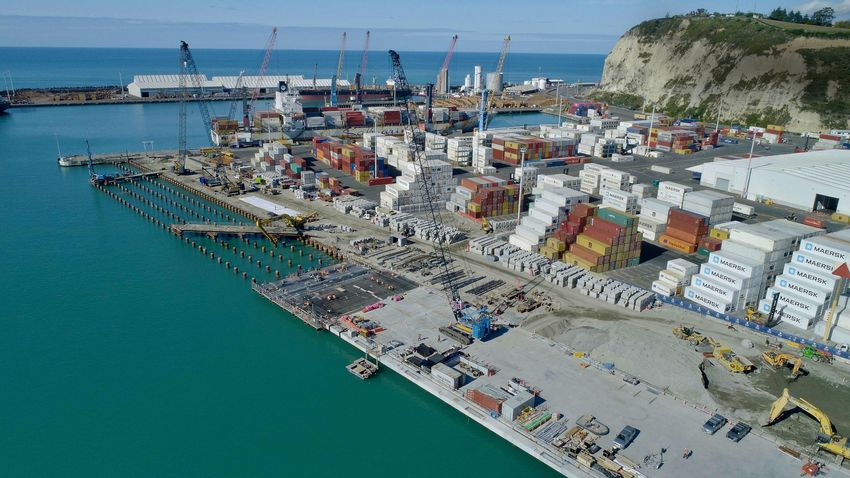
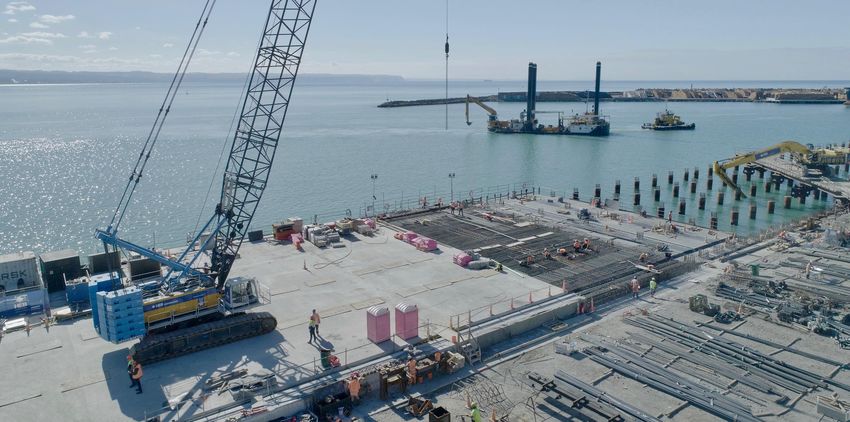
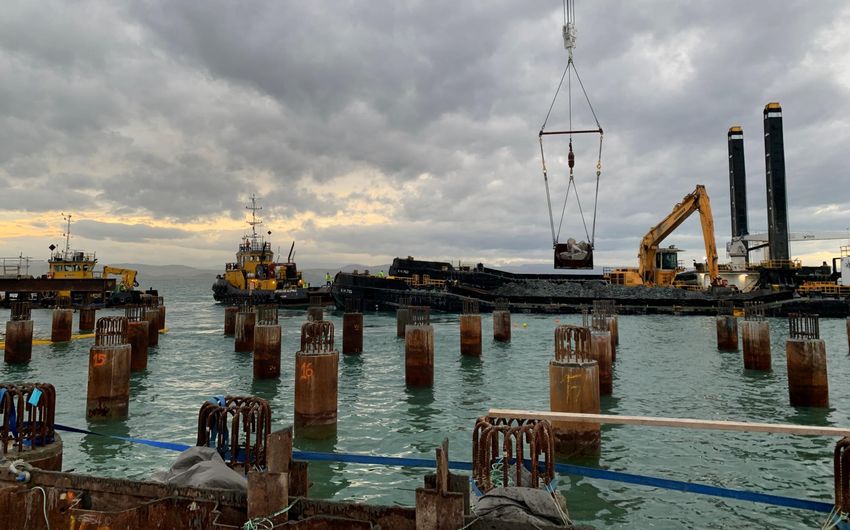
6 WHARF CONSTRUCTION PROGRESS ON-PLAN

STATUS1:
• 362 of 400 reinforced concrete piles completed
• Deck construction commenced, 10 of 32 deck pours completed
• Dredging – 621,000 cubic metres of around 1.3 million
  cubic metres has been completed
• 2,720 of 4,500 revetment armour blocks cast,
  1,757 are now in place
• No material change to completion timing (late 2022)
  or cost ($173m - $190m2)

1 – As at 10 May 2021                                                  8
2 - Accruals basis excluding capitalised overheads and finance costs

POSITIVE TRADE RESULT DRIVEN BY LOG EXPORTS
TRADE VOLUME OVERVIEW

                                                                             Variance
    Volume                                        HY2021    HY2020
                                                                      kT / TEU           %
    Total cargo (kT)                               2,786     2,527     +259             +10.2
    Containerised cargo (TEU)                     135,000   135,000      -                -
    Bulk cargo (kT)                                1,870     1,597     +273             +17.1
         - Logs exports (kT)                       1,428     1,184     +244             +20.6

•    Record log volumes in the half year
•    Total container volumes in line with prior year

                                                                                                9
RESILIENT FINANCIAL RESULT DESPITE NO CRUISE REVENUE
FINANCIAL RESULTS OVERVIEW
HY2021 HY2020 Variance
$M $M $M %
Revenue 52.6 52.3 +0.3 +0.6
Result from operating activities 21.3 21.7 -0.4 -2.0
Net profit after tax
- Reported 10.6 12.4 -1.8 -14.9
- Underlying¹ 10.6 11.1 -0.5 -5.2
Cash flow from operations
- Reported 14.6 13.4 +1.2 +8.5
- Underlying¹ 14.6 13.9 +0.7 +4.5
• Maintained revenue despite no cruise revenue in current year ($4.2m in prior year)
• Result from operating activities better than expected due to growth in bulk cargo revenues
• Lower net profit due to operating result and non-recurring net gains in prior year
• Higher cash flow from operations from lower first half year net working capital growth in current year
1 - Refer to appendices for reconciliations of underlying metrics
10FINANCIAL & OPERATING PERFORMANCE
BULK CARGO REVENUE OFFSETS NO CRUISE REVENUE

• 0.6% revenue growth half year-on-half year (HoH)
• Bulk cargo up 26.5%, container services up 0.5%, nil cruise revenue

                                                                                 HY2021 REVENUE
                                                                                    Other
                                                                                    $1.3m
                                                                                                  Container
                                                                                                  services
                                                                          Bulk
                                                                                                   $31.1m
                                                                         cargo
                                                                        $20.2m
 Millions

                                                                                                              12
CONTAINER SERVICES REVENUE STEADY ON TRADE MIX CHANGES
• Container Services revenue up 0.5% HoH
• Container volume in line with prior year: 135,000 TEU
- Shipping schedule disruptions resulted in -5,000 TEU empty containers and +5,000 tranships and DLRs
- Reefer volume growth +6.0% offsets drop in dry volume -2.1%
• Average revenue per TEU increased 0.6% to $230/TEU from $229/TEU
- Containers remaining on port for longer periods offset lower volumes through PortPack and Depot and fewer vessel calls
HY2020 TEUs HY2021 TEUs
$35 $232
$30.9 $31.1 Other Other
$30 7k 11k
$231 Reefers Reefers
Average revenue per TEU
23k 24k
$25
$230
Empty
Millions
$20
Empty
55k
50k
$229
$15
$228
$10
$227 Dry Dry
$5 51k 50k
$- $226
HY2020 HY2021
Revenue (LHS) Average revenue per TEU (RHS)
13HIGHER BULK CARGO REVENUE DRIVEN BY VOLUME INCREASE
• Revenue up 26.5% HoH to $20.2m
• Driven by 17.1% volume increase
• Average revenue per tonne increased 8.0% to $10.80/T from $9.99/T
- Includes one-off cost recovery revenue of $0.45/T
- Remainder driven by log exports
HY2020 REVENUE HY2021 REVENUE
$25 $11.20
Other Other
$11.00 Cruise 2.5%
$20.2 2.3%
8.0% Container Container
$20
Average revenue per tonne
$10.80 services services
Bulk 59.1% Bulk 59.1%
$16.0 $10.60 cargo cargo
$15 30.5%
Millions
38.4%
$10.40
$10.20
$10
$10.00
$5 $9.80
$9.60
$- $9.40
HY2020 HY2021
Revenue (LHS) Average revenue per tonne (RHS)
14RECORD HY LOG VOLUMES
• Log exports volumes up 20.6% HoH with sustained strong log export market conditions
- Record half year log export volume of 1.43 million tonnes
- Prior year log volumes were negatively impacted by Chinese market disruptions leading
up to NZ’s COVID-19 Alert Level 4 lockdown
• Less volume volatility
• Solid volumes continuing into Q3 FY2021 (to date)
HY2021 ALL CARGO EXPORTS (WEIGHT)
3.0
Other
2.58
Apples & pears 10%
2.5 2.37 2%
Fresh produce
Millions (tonnes)
2.0 3%
Meat
1.43 6%
1.5
1.25 1.18
Timber
1.0 6%
Woodpulp Logs
0.5
10% 63%
0.0
2019 2020 2021
Logs (HY) Logs (FY)
15OPEX INCREASE: LED BY INVESTMENT IN PEOPLE
2.4% INCREASE IN TOTAL OPERATING EXPENSES
• FY2021: unwinding of COVID-19 response measures in FY2020 & strategic investment in people and capability
• Employee benefit expenses up 5.4% HoH
• Property and plant expenses down 6.7% due to timing of maintenance spend
• Other operating expenses up 2.6% due to increasing insurance premiums and technology costs
EMPLOYEE BENEFIT EXPENSES OTHER OPEX HY2021
Other staff expenses
$20 40.0%
$0.6m
$17.5 Property and plant
$16.6 Contract expenses
$16 38.0% labour $5.1m
Percentage of revenue
$2.3m
Millions
$12 36.0%
$8 34.0%
$4 32.0%
Administration Occupancy
expenses expenses
$- 30.0% $2.8m $3.0m
HY2020 HY2021
Employee Benefit Expenses (LHS) Percentage of Revenue (RHS)
Note: the components of total operating expenses have been reclassified in the half-year 2021 financial statements and comparative 2020 data has been restated on a comparable basis. Refer to the notes to the NPH Group consolidated 16
financial statements for half year to 31 March 2021 for further information.OPERATING MARGIN MAINTAINED >40%
• Result from operating activities down $0.4m (2.0%)
• Operating margin maintained at >40% in HY2021
RESULT FROM OPERATING ACTIVITES
% Revenue
$30
41.6% 40.5%
$21.7 $21.3
$20
Millions
$10
$-
HY2020 HY2021
17NPAT DOWN WITH LOWER OPERATING RESULT
• Underlying NPAT1 decreased by 5.2% to $10.6m
- Lower operating result (-$0.4m pre-tax)
- Increased depreciation and amortisation (-$0.3m pre-tax)
$15.0
$12.4
$11.1
$10.6 $10.6
$10.0
Millions
$5.0
$-
HY2020 HY2021
Reported NPAT Underlying NPAT
1 - Refer to appendices for reconciliations of underlying metrics 18CAPITAL EXPENDITURE FOCUS ON DELIVERING 6 WHARF
• Capital expenditure of $49.4m1
• 6 Wharf:
• $45.1m2 in HY2021
• Cumulative construction spend of $78m to March 2021
• $90m - $110m spend expected for FY2021 – increased from $70m - $90m
HY2021 CAPITAL EXPENDITURE
$60
Replacement
$ 53.1
$ 49.4
$2.3m
$50 Other development
$1.9m
$40
Millions
$30
$20 $ 18.8
$10
6 Wharf
$- $45.1m
FY2019 FY2020 HY2021
Development - 6 Wharf Development - Other Replacement Other
1 - Including accounting accruals. HY2021 cash spend $45.8m
19
2 - Including accounting accruals. HY2021 cash spend $40.8mCASH FLOW & LIQUIDITY
HY2021 HY2020 Var
$M $M $M
Operating cash flows 14.6 13.4 +1.2
Investing cash flows (45.7) (23.2) -22.5
Proceeds from bank debt 36.0 - +36.0
Dividends (10.0) (5.0) -5.0
Other financing cash flows (0.1) (0.3) +0.2
Net (decrease) in cash & cash equivalents (5.2) (15.1) +9.9
• FY2020 full year dividend of $10m (5.0 cps) paid December 2020
• Bank facilities drawn balance of $36.0m at end of March 2021
• $180m total bank facilities
- 66% expires Q4 2024
- 33% expires Q4 2023
20CAPITAL MANAGEMENT
• Increase in Net Debt to EBITDA ratio above 3.5x likely based
on current environment (including cruise disruption) but
remains a point of focus to mitigate this increase over time
• Expectation that the ratio will be managed to within its long-
term target range of 2.0x – 3.0x over time, following completion
of 6 Wharf
21CONCLUSION & OUTLOOK
CONCLUSION

Resilient half year revenue and earnings given ongoing
effects of COVID-19

Benefits of diversity of the trade portfolio shown in first half

Shipping and supply chain challenges & risks continuing

Good progress with strategic development initiatives

                                                                   23
CURRENT OUTLOOK
COVID-19 EFFECTS CONTINUE TO CLOUD OUTLOOK
• Demand for the region’s food and fibre exports remains robust
• Continued friction in getting products to markets via regional and global supply chains
– continuing supply chain stress and capacity shortages likely for at least remainder of the
current financial year
• Relative weakness expected in our container trades arising from primary sector seasonal labour
shortages, shipping and supply chain disruption
– apple export full year volume uncertain
• Good log export volume momentum carried into Q3 (to date)
• Continued investment in people & capability & focus on strategy implementation for second half
• Affirm recent guidance of FY2021 underlying result from operations between $39m and $42m
• Cruise return timing - unlikely for FY2022
24HY2021 INTERIM DIVIDEND • Interim dividend of 2.8 cps declared • Fully imputed • Record date: 11 June 2021 • Payment date: 25 June 2021 • Compared to nil in prior year See Appendix for dividend policy summary 25
QUESTIONS
APPENDICES

The following appended financial information provides a summary of financial information for the
half year period ended 31 March 2021 (HY2021) compared to the corresponding half year period
in 2020 (HY2020).
Reconciliations provided are extracted from and should be read in conjunction with the Supplemental
Selected Financial Information document released with NPH’s 2021 Half Year Report on the NZX
announcements platform and the Napier Port website Investor Centre.

                                                                                                      27
REVENUE
NZ$000 HY2021 HY2020
Revenue from Port Operations 51,405 51,240
Revenue Other 1,180 1,044
Total operating income 52,585 52,284
NZ$000 HY2021 HY2020
Container Services 31,065 30,921
Bulk Cargo 20,192 15,966
Cruise - 4,177
Sundry revenue 148 175
Revenue from port operations 51,405 51,240
Property income 1,180 1,044
Operating income 52,585 52,284
28OPERATING EXPENSES
Employee benefit expenses
NZ$000 HY2021 HY2020
Wages & salaries 16,093 15,402
Other employee benefit expenses 1,362 1,166
Total employee benefit expenses 17,455 16,569
Property and plant expenses
NZ$000 HY2021 HY2020
Plant expenses 2,510 2,715
Site expenses 664 732
Fuel & Power 1,917 2,010
Total property and plant expenses 5,091 5,457
29OPERATING EXPENSES
Other operating expenses
NZ$000 HY2021 HY2020
Administration expenses 2,824 2,796
Occupancy expenses 3,016 2,483
Contract labour 2,301 2,268
Other staff expenses 605 975
Total other operating expenses 8,746 8,522
30CAPITAL EXPENDITURE
NZ$000 HY2021 HY2020
Development capex
6 Wharf pre-construction - 970
6 Wharf construction 45,129 11,197
Additional tug - 4,681
Acquisition and development of off-port depot services land - 2,565
Refrigerated container capacity 1,075 -
Other development capex 846 623
Total development capex 47,049 20,036
Replacement capex 2,307 6,894
Compliance and other capex - 246
Total capex including capitalised finance costs 49,357 27,177
Movement in fixed asset creditors (3,597) (3,955)
Capex per cash flow 45,759 23,222
31RECONCILIATION OF UNDERLYING NET PROFIT AFTER TAX1
NZ$000 HY2021 HY2020
Reported net profit after tax 10,574 12,430
Adjustments:
IPO transaction and related costs/ (reversals) - (201)
Impairment of infrastructure assets for 6 Wharf development - 551
Tax impact of adjustments - (123)
Tax benefit of reinstatement of tax depreciation on buildings - (1,508)
Underlying net profit after tax 10,574 11,149
1 - Underlying net profit after tax is a non-NZ GAAP measure – refer to the Supplemental Selected Financial released with NPH’s 2021 Half Year Report on the NZX announcements platform for
32
further information related to this measureRECONCILIATION OF UNDERLYING
NET CASH FLOWS FROM OPERATING ACTIVITIES1
NZ$000 HY2021 HY2020
Reported net cash flows from operating activities 14,563 13,426
Adjustments
IPO transaction and related costs - 478
Tax impact of adjustments - 31
Underlying net cash flows from operating activities 14,563 13,935
1 - Underlying net cash flows from operating activities is a non-NZ GAAP measure – refer to the Supplemental Selected Financial Information released with NPH’s 2021 Half Year Report on the
33
NZX announcements platform for further information related to this measureDIVIDEND POLICY
• The Board is targeting paying total dividends within a range of 70% to 90% of Free Cash Flow1
• Free Cash Flow1 is a non-NZ GAAP measure adopted by Napier Port. It excludes capital expenditure
on development projects (including 6 Wharf) and the interest costs which will be capitalised during
construction
• The payment of dividends is not guaranteed and will be at the discretion of the Board and depend on a
number of factors. These factors include the general business environment, operating results (including
our ability to grow Free Cash Flow1) and financial condition of Napier Port, future funding requirements,
any contractual, legal or regulatory restrictions on the payment of dividends by Napier Port and any other
factors the Board may consider relevant. In declaring dividends, Napier Port must comply with the
solvency test under the Companies Act and the covenants in its banking facilities
• Dividend payments are expected to be split into an interim dividend paid in June, targeting
40% of the total expected dividend for the financial year, and a final dividend paid in December.
Napier Port intends to impute dividends to the maximum extent possible
1a non-NZ GAAP measure, being NPAT, adjusted for the post-tax impact of fair value revaluations of derivatives and investment properties, plus depreciation, amortisation and impairment, less the average replacement 34
capital expenditure of maintaining Napier Port's asset base. Average replacement capital expenditure is based on an assessment of the long term average cost of maintaining assets for Napier Port in real terms.OUR STRATEGY BUILDS ON A STRONG BUSINESS
A LONG TERM ASSET ESSENTIAL TO THE HEALTH OF THE HAWKE’S BAY ECONOMY
RELEVANCE
DURING
COVID-19
AN INFRASTRUCTURE ASSET ESSENTIAL TO THE HEALTH OF THE HAWKE’S BAY ECONOMY
Napier Port is an essential regional infrastructure asset and, by connecting Hawke’s Bay and central New Zealand to global markets, is an active participant in driving regional prosperity
STRONG REGIONAL ECONOMIC GROWTH DRIVERS AND STRONG KEY CUSTOMER RELATIONSHIPS
The Hawke’s Bay region has experienced strong growth, supported by international demand for its diverse range of export cargo.
Strong key customer relationships see the Port embedded as an essential supply chain partner
DIVERSIFIED TRADE PORTFOLIO MITIGATES SECTOR AND COUNTRY-SPECIFIC RISKS
The Port handles a diversified mix of export and import products including logs and forestry products, pipfruit, oil products and fertiliser, which are shipped to or from over
110 countries globally
WELL-POSITIONED GIVEN FUTURE CARGO VISIBILITY AND FULLY-CONSENTED DEVELOPMENT PLANS
Future cargo visibility enables robust planning for strategic growth projects. Development of 6 Wharf is expected to significantly increase the Port’s capacity and improve
operational efficiency
STRONG HISTORICAL FINANCIAL PERFORMANCE AND A RECORD OF EXECUTION ON GROWTH OPPORTUNITIES
Napier Port delivered annual average revenue growth of 8.4% over the last four years (2016 - 2020), while consistently delivering EBITDA margins of above 40%
EXPERIENCED MANAGEMENT TEAM THAT IS WELL CONNECTED WITH CARGO OWNERS AND OTHER STAKEHOLDERS
Extensive commercial and infrastructure expertise and broad depth of senior leadership experience in New Zealand and overseas, and management enjoys strong relationships
with key stakeholders and the local community
35FURTHER INFORMATION ON NAPIER PORT
To learn more about Napier Port and what it does please refer to our website at www.napierport.co.nz
See our website Investor Centre for:
• Share price information
• Links to NZX results and market announcements
• Key calendar dates
• Publications, including:
- Annual Reports
- Sustainability Framework
- Investment Key Facts
- Investing in Napier Port
• Key policies and governance documents
36You can also read