Investor Presentation - March 2019 - NSE
←
→
Page content transcription
If your browser does not render page correctly, please read the page content below
Investor Presentation
        March 2019      1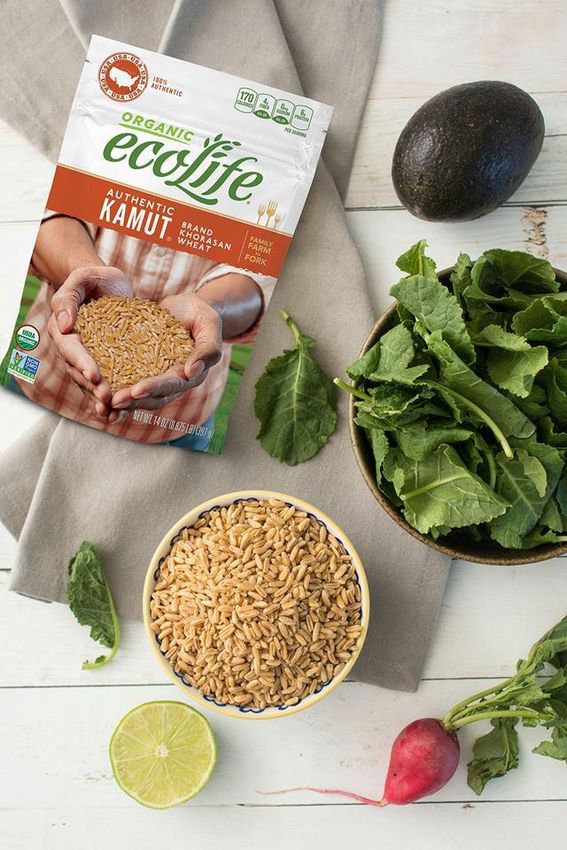
Safe Harbor

 This presentation and the accompanying slides (the “Presentation”), which have been prepared by LT Foods Limited (the
 “Company”), have been prepared solely for information purposes and do not constitute any offer, recommendation or
 invitation to purchase or subscribe for any securities, and shall not form the basis or be relied on in connection with any
 contractor binding commitment whatsoever. No offering of securities of the Company will be made except by means of a
 statutory offering document containing detailed information about the Company.

 This Presentation has been prepared by the Company based on information and data which the Company considers
 reliable, but the Company makes no representation or warranty, express or implied, whatsoever, and no reliance shall be
 placed on, the truth, accuracy, completeness, fairness and reasonableness of the contents of this Presentation. This
 Presentation may not be all inclusive and may not contain all of the information that you may consider material. A ny
 liability in respect of the contents of, or any omission from, this Presentation is expressly excluded.

 This presentation contains certain forward looking statements concerning the Company’s future business prospects and
 business profitability, which are subject to a number of risks and uncertainties and the actual results could materially differ
 from those in such forward looking statements. The risks and uncertainties relating to these statements include, but are not
 limited to, risks and uncertainties regarding fluctuations in earnings, our ability to manage growth, competition (both
 domestic and international), economic growth in India and abroad, ability to attract and retain highly skilled professionals,
 time and cost over runs on contracts, our ability to manage our international operations, government policies and actions
 regulations, interest and other fiscal costs generally prevailing in the economy. The Company does not undertake to make
 any announcement in case any of these forward looking statements become materially incorrect in future or update any
 forward looking statements made from time to time by or on behalf of the Company.

LT Foods Investor presentation, March 2019                                                                                         2
LT Foods – At a glance

                         3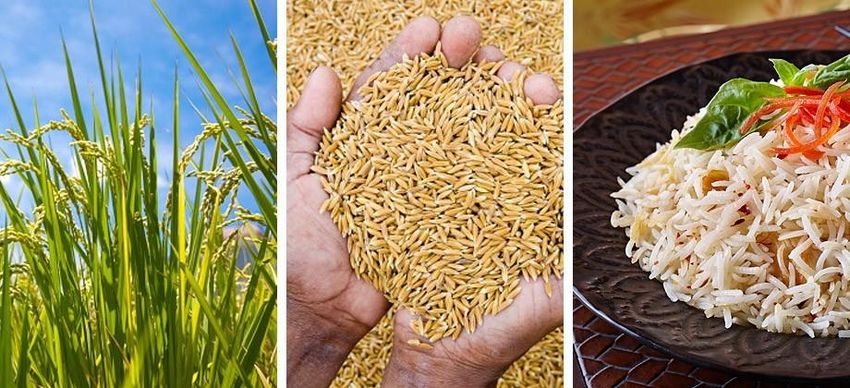
LT Foods Limited is a leading rice-based food company
     with strong global brands of basmati and other specialty
     rice, organic foods and rice-based convenience products

               “DAAWAT” - the flagship brand is the                                 FY18 Financials
               leading brand in India and 65+
Iconic         countries
                                                                                      Net Sales               Net Profit           EBITDA           EPS
Brands         “Royal” - the No. 1 and the largest
               selling basmati rice brand in North
               America                                                                ₹ 3650 crs               ₹ 144 crs          ₹ 414 crs         ₹ 4.8

                         Integrated operations span across                                                                 FY18 Revenue by
 Integrated              the entire rice value chain                              Presence across 65 countries                  Geography
 Operations              Operations include contract                              Established ground presence in the
  – ‘Farm to             farming, procurement, storage,            Strong         US, Europe and Middle East territories
        Fork’            processing, packaging, and                Global         Manufacturing facility in Rotterdam
                         distribution                                                                                              9%                India
                                                                 Footprint        (Netherlands) and three packaging
                                                                                  facilities in the US along with 5          11%                     US
                                                                                  manufacturing facilities in India                           38%
                                             Access to 1,50,000 retail outlets,
                                                                                                                                                     Europe
                               Wide          3,600 wholesalers, and 2,500                                                   12%
                        Distribution         modern trade stores                                                                                     ME
                           Network           40 international distributors to
                                                                                                                                                     ROW
                                             cater to the global market                                                            30%

LT Foods Investor presentation, March 2019                                                                                                                    4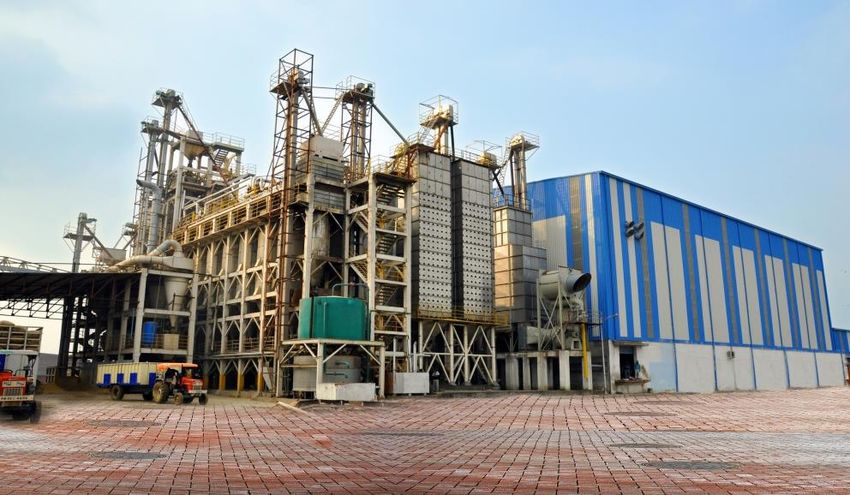
Our journey of 50 years from a bulk rice player to a leading rice-based
food company with strong global brands of basmati and other specialty
rice, organic foods and rice-based convenience products
Strategic Acquisitions
Foundation
Expanded our presence to 65+ countries
1950s- Founded by Focus on Brands and Product Value Chain
the Arora Family Launched “Ecolife” in USA & India ( limited channels)
Presence extended to 35+ countries
1978- 1st Rice mill Acquired “Gold Seal Indus Valley”, “Rozana”, “817
Became a public listed company
Elephant”
Pre 1985- 1995- 2007- 2015- 2016-
1985 1995 2006 2014 2016 2018
Next Stage of Growth
Focus on B2B (Private Label) Globalization
Launched premium rice based snacks
Incorporation of LT Overseas Ltd Acquired ‘Royal’ brand in US “Kari Kari” through a JV
1980s - Launched ‘DAAWAT’ brand Infusion of equity by Rabobank - India agri Inaugurated new facility in the US for
‘DAAWAT’ launched internationally business fund Ready to Heat products
in 20 countries DAAWAT- Leading position among basmati Commenced operations in Rotterdam,
rice brands in India Netherlands
Launched value added staples Launched the new avatar of “DAAWAT”
Renowned investors have invested
through QIP
Equity infusion by Rabo PE fund in Nature
Bio Foods 5
LT Foods Investor presentation, March 2019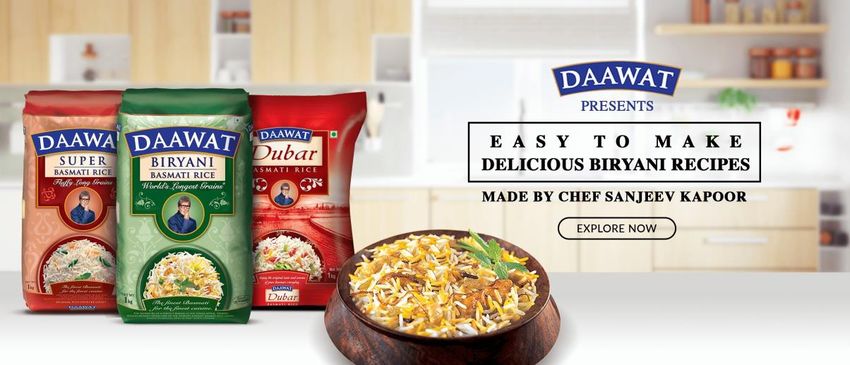
Drivers of Growth

                  Creating                   Building   Deepening
                  Enduring                   Strong     Global
                  Value                      Brands     Presence

LT Foods Investor presentation, March 2019                          6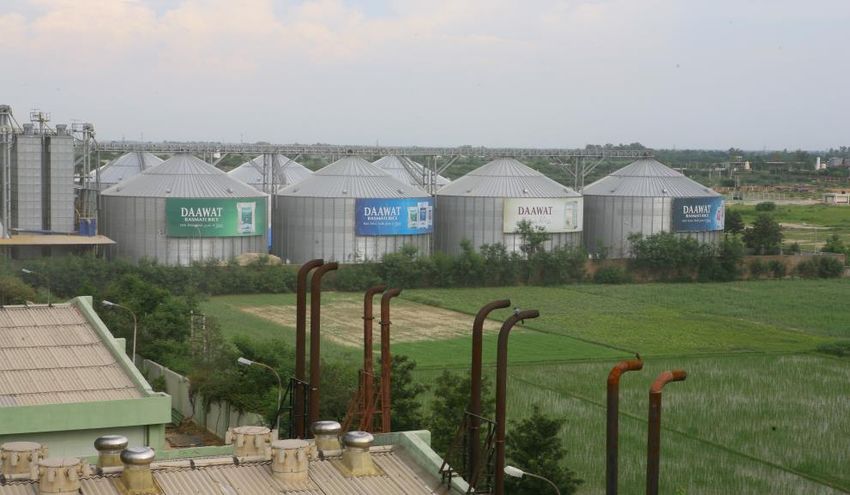
Creating Enduring Value

                          7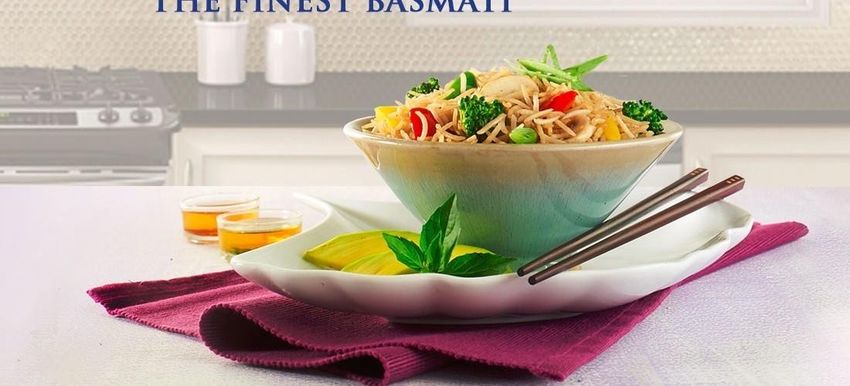
The opportunity landscape of quality food segment
 • In 2017, India accounted for 23% of global rice production. India is also one             • Rising affluence and urbanisation are changing consumption patterns in
   of the greatest consumers of rice, (97 m tonnes in 2017).                                   India.
 • ‘Basmati’ rice is the most premium, with superior product characteristics.                • Consumer behaviour and spending patterns are shifting with evolving
   India and Pakistan, are the only suppliers of Basmati in the world. Total size              Indian society and rising income.
   of the industry is 7 MMT.
                                                                                             • Convenience food and health food are the two emerging trends arising out
 • Indian Basmati rice industry has grown to 2 MMT from 1.2 MMT in last 5 years.               of the changing demographics of the country.
 • Rising disposable income; increasingly spending on premium quality grains                 • Organic food now has become a viable alternative for an increasing
   is benefiting the basmati rice market.                                                      number of consumers. Organic packaged food and beverages is an
                                                                                               emerging niche market in India.
 • Majority of Basmati is exported (around 75%). Overseas markets for Basmati
   include the Middle East, U.S., U.K. and parts of EU.                                      • The global organic food and beverages market is expected to reach
                                                                                               $323.09 billion by 2024 2.
 • The Basmati Exports grew by over 11.13% in value terms during FY2018 over
   the previous year 1.
 • The outlook for the Indian Basmati rice industry continues to be favourable,                 Global Organic Food and Beverages Market
   supported by demand improvement from the international market and
   potential upside from branded demand/ premiumisation domestically.                              500
                                                                                                                                                                     19.0%   20%
                                                                                                                                                             17.9%
                                                                                                                                                     16.9%
             India’s exports of rice (Volume in MMT)                                               400
                                                                                                                             14.1%
                                                                                                                                     15.0%   15.9%
                                                                                                                    13.3%                                             328    15%
                                                                                                            12.6%
                               Basmati               Non-Basmati                                   300                                                        275
                                                                                                                                                     234
            15                                                                                                                               200                             10%
                                                                                                   200                               172
            12                                                                                                       131    150
                                                                                                            116
                                                                                                                                                                             5%
             9                                                                                     100
                                 8.2                                   8.6
                     7.0                       6.4            6.8
             6                                                                                       0                                                                       0%
                                                                                                            2015    2016    2017     2018    2019    2020    2021     2022
             3
                     3.8         3.7           4.0            4.1      4.1
                                                                                                                      Revenue (USD bn)               Y-o-Y Growth
             0
                   2013-14    2014-15        2015-16       2016-17   2017-18
                                                                               1 - Source: APEDA
                                                                               2 – Allied market research
LT Foods Investor presentation, March 2019                                                                                                                                         8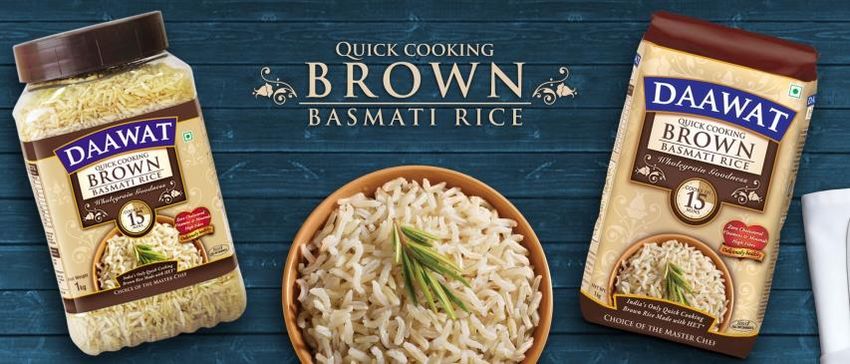
Driven by ‘Farm to Fork’ – our integrated business model…
Robust backward integration through partnerships with
                                                                                                         Continuous innovation of processes and systems
farmers under Sustainable Rice Production Programs.
                                                                                                         to enhance competitive position and improve
Provides technical knowhow to farmers for rice                                                           business process efficiencies.
                                                             State-of the-art packaging
farming.
                                                             facilities not only in India but US         All facilities certified by internationally acclaimed
Associated with 80,000+ farmers for Organic food.            and Europe as well.                         third-party certification and accreditation bodies.

                                                    State of
                                                    the art                                             Finest
     Farming
                                                    Processing                                          Quality
                                                    facilities

                                                                           Wide                                                    Strong
                               Procurement                                 Distribution                                            Brands
                                                                           Reach

A wide procurement network with strong                  Strong Pan-India distribution serving 1,50,000+ retail     Brands with an offering for every
quality control across all mandis.                      outlets, 3,600 wholesalers, and 2,500 modern trade         occasion and every recipe.
Present across 234 mandis with 270 agents.              stores. Robust presence in HoReCa.
Strong relationships built with traders/mandis.         Leading direct reach coverage across the globe.            DAAWAT - Leading brand in India and
                                                                                                                   65+ countries; Royal - Largest selling
                                                                                                                   basmati rice brand in the North America.
LT Foods Investor presentation, March 2019                                                                                                                   9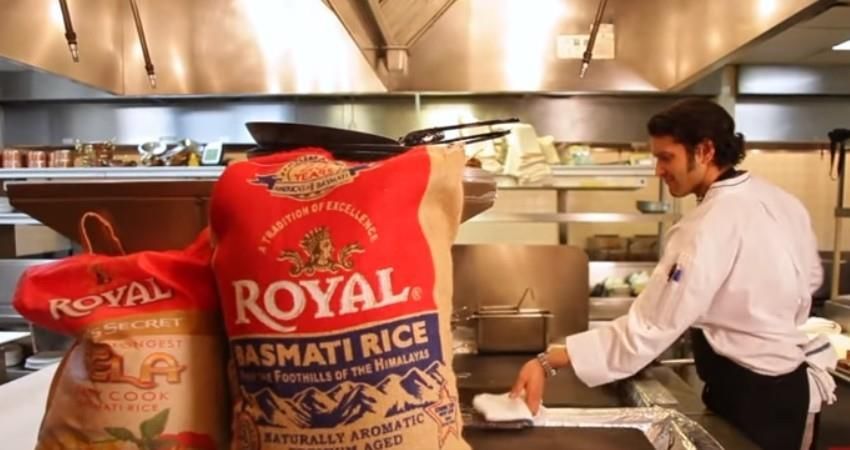
…and our Integrated Manufacturing
                               Sonepat            Sonepat
                                                                       Bhopal               Amritsar        Varpal
                             (Bahalgarh)        (Kamaspur)

 Rice Capacity
 (TPH)                             43         5 (organic rice)           35                    6              12

 Key products                                                    Rice, plain chips,                    Rice (golden,
                                             Organic rice        chips seasoning,     Rice and         creamy, boiled,
                         Raw rice
                                             and snack           rice/wheat flour,    parboiled rice   parboiled and
                                                                  brown rice                           raw)

 Accreditation           ISO, SQF, BRC,      ISO, NOP,
                                                                 FSSC, Halal,
                         SA, Kosher, OU,     NPOP, EEC                                ISO              FSSC and BRC
                                                                 Kosher and BRC
                         Halal               and Kosher

LT Foods Investor presentation, March 2019                                                                               10
Perfectly positioned to leverage on the growing opportunity
FY18 Revenue
Our Business Segments Direct customers Brands
share
DAAWAT, Royal,
Includes the flagship brand ‘DAAWAT’ &
Established Gold Seal Indus
Branded ‘Royal’(No. 1 in US)
channel partners Valley, Rozana, ~60%
Business Other brands in this segment include Indus Valley, across all segments Heritage, 817
817 Elephant, Heritage, Devaaya and Rozana Elephant
Private Deals with large institutional customers Large institutional Mars, Okam, ~26%
Long-term partnerships across geographies customers Trader’s Joe
Label
Providing authentic organic ingredients to global Majorly a B-to-B
Institutional
Organic
consumers. Diverse portfolio, comprising of cereal
grains, flour, Pulses, Oil and Oil Seeds, Nuts, Spices, customers & direct business; recently
launched Ecolife
~10%
Herbs, Millets and Sweeteners consumers
brand
New Innovative products for health conscious and
convenience-seeking Consumers Established Under brand
Products
Includes brown basmati, rice based sauces and
channel partners
across all segments
DAAWAT, Kari-Kari ~4%
snacks
LT Foods Investor presentation, March 2019 11Business segment performance over the years (ending 9MFY19)
All Figures in Rs Cr unless specified
Branded Revenue Private Label Revenue Organic Revenue
2,130 962 352
1,802 1,690
1,564 742 776 274
241
605 224
FY16 FY17 FY18 9MFY19 FY16 FY17 FY18 9MFY19 FY16 FY17 FY18 9MFY19
Branded & Private Label Volume Branded Domestic Revenue & Volume Branded Export Revenue & Volume
2,00,000 1,200
1,82,244 1,73,536
2,92,290 3,02,171 1,50,000
1,000 1,28,635
2,41,508 1,50,000 1,44,110 1,500
2,27,176 1,31,364 1,10,046
800
892 1,00,000 97,399 95,812 1,200
1,59,709 792 1,238
1,00,000 600
1,17,296 1,29,646 685 900
1,04,176 624 1,010 1,005
400 939
50,000 600
50,000
200 300
- - - -
FY16 FY17 FY18 9MFY19
FY16 FY17 FY18 9MFY19 FY16 FY17 FY18 9MFY19
Branded Volume (MT) Private label Volume (MT) Domestic Volume Domestic Revenue (Cr) Export Volume Export Revenue (Cr)
LT Foods Investor presentation, March 2019 12Raising the bar through continuous innovation
Product Innovation
Two product innovation centres, one in Gurugram, India and ‘DAAWAT Rozana Gold Plus’ - a unique
one in California, USA, with a team of dedicated research blend of flavoursome white basmati and
personnel. fibre rich Brown Rice.
In the process of developing additional products to expand its This product leverages the innovative
range of convenience foods and develop a healthy snack concept of introducing a ‘high fiber
segment. blend’ into the basmati rice category.
Products under development include ‘90 second ready-to-
heat’ pouched rice, fortified rice and ‘5 minute meal-in-a-cup’.
15 minute DAAWAT Quick-Cooking
Brown Rice range.
Made using the unique hydration
enhancement technology (HET) which
moisturizes the bran layer. This helps Successful launch of premium rice-based
water penetrate the grain easily while snacks brand ‘Kari Kari’ for the Indian market.
cooking.
DAAWAT Saute Sauces
LT Foods Investor presentation, March 2019 13Building
Strong
Brands
14Our strong brands drive superiority in core markets
29% Market share in India – Rural & Urban
By Independent
By Reader’s Digest By Economic times
Organization
Branding expenses ( Rs crs)
30% Market share in India – Modern Trade
Branding Exp. As % of sales
150 5%
108 4%
100
94
3%
3.3%
60
2.6% 2%
50 2.1%
1%
45% Market share of US basmati segment
0 0%
FY17 FY18 9M FY19
Source : AC Nielsen Q4-18
LT Foods Investor presentation, March 2019 15Our strong brand portfolio
Wide range of brands, with an offering for every occasion and every recipe, enabling it to cater to
various customer segments, across income groups
The flagship brand, with a Strengthening our position in
legacy of over 30 years, Saudi Arabia, UAE and
offers premium quality Kuwait
basmati rice
The No. 1 and the largest Leading brand in markets
selling basmati rice brand in like Western India, Mauritius
the US and Iraq
The organic food range Targeting the Indian &
includes rice, pulses, oil Middle Eastern ethnic
seeds, cereal grains, spices, population in US and
nuts, fruits, and vegetables Canada
Premium rice based snacks
Offers branded Basmati rice brand. Test launched in India
and staples like wheat flour, via a JV with a Japanese
refined flour, flattened rice, snack food major Kameda
chickpea flour, and semolina Seika
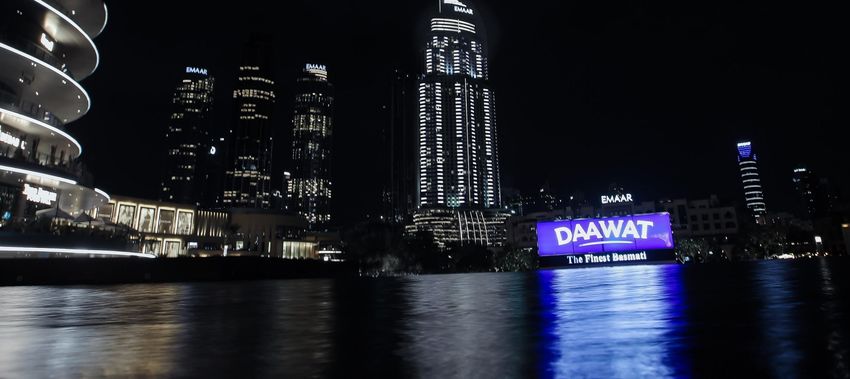
LT Foods Investor presentation, March 2019 16Brand DAAWAT (The Finest)
Leading brand in 65+ countries
A legacy of over 30 years
29%+ share in
• Offering premium quality basmati rice across all branded rice
points in India and globally. market in India
• Consumer need based product range – recipe
variants such as biryani and pulao, food service
cooking need based range - DAAWAT Chef’s
secretz 35%+ market
• Equity extended to NPD - seven flavourful share in Premium
DAAWAT Rice Saute Sauces, DAAWAT Fast segment
Cooking Brown Basmati Rice and DAAWAT
Rozana Gold Plus.
LT Foods Investor presentation, March 2019 17Brand Royal (No. 1 in US)
Largest selling basmati rice brand in the US 45%+ share of
the US basmati rice
• The brand’s product portfolio consists of Basmati
segment
rice, Jasmine rice, Arborio rice, wheat flour, and
flavoured rice.
• Leveraging the brand’s equity and distribution
network, to expand the product portfolio in the US
market. 39%+ share of
the branded
• Introduced atta under the Royal brand segment
LT Foods Investor presentation, March 2019 18Organic foods - Ecolife
Organic business is one of the fastest growing segments 44% CAGR
in LT Foods between 2013 and
• Nature Bio Foods Limited (wholly owned subsidiary), 2018.
has emerged as a trustworthy and innovative global
leader in providing authentic organic ingredients to
the global consumers.
90% of business is
• NBFL - engaged in the organic foods business since from export sales
1997.
• Ecolife – Recently launched organic food brand.
• Range includes rice, pulses, oil seeds, cereal grains, First organic
spices and nuts. company in the
country to be
• Introducing a range of organic “ready to heat” conferred with the
products for the overseas market with a facility in the coveted CII Food
United States. Safety Award
LT Foods Investor presentation, March 2019 19Deepening Global Presence
20LT Foods is a globally significant player
Broadening our footprint globally, presence in 65 countries Augmented our capabilities in geographies
where already present - such as the US and
Middle East the EU; and building strengths in others like
UK; Europe • Brand ‘817 Elephant’ helped the Middle East.
• Well-entrenched sales penetration into ethnic population
USA; Canada network Operating 60,000 of ME. • Commenced operations of manufacturing facility
• #1 with 45% market share MT rice processing plant at • Strengthening presence in Saudi in Rotterdam, Netherlands, with a capacity of
• Presence with flagship brand Rotterdam Arabia, UAE and Kuwait with 60,000 metric tonnes per annum.
‘Royal’ and acquired brand • Strengthening presence acquisition of ‘Indus Valley’ &
‘817 Elephant’ with DAAWAT brand ‘Rozana’ brands • In Europe, new processing unit will help save on the
heavy import duty of 170 Euro/MT on white basmati
rice.
Australia
• Established a ready-to-heat plant in Houston, USA.
• Presence with strong
sales network
• Organic business - subsidiaries in Netherlands and
USA to cater more intensively to customers.
• Acquired brands of Gold Seal Indus Valley and
Rozana are steadily growing, and improving our
position within the Middle-East markets.
• Also helped us enter into specific new markets of
Qatar, Oman, and Bahrain. Leveraging these
brands, reinforced our existing presence in Saudi
Arabia, UAE and Kuwait.
India • Brand ‘817 Elephant’ acquisition is helping in
• Strong player with 29% market share strengthen our presence in Canada, USA, Australia,
• 5 Manufacturing Facilities with total and Israel.
100 + TPH capacity
LT Foods Investor presentation, March 2019 21Financials
22Our growth through the years (ending 9MFY19) All Figures in Rs Cr unless specified
Revenue EBITDA & EBITDA Margin
3,650 EBITDA EBITDA Margin
3,293
2,980 2,897 12.2% 12.3%
600 11.3% 11.0% 12%
406 414 9%
400 363
319
6%
200
3%
0 0%
FY16 FY17 FY18 9MFY19 FY16 FY17 FY18 9MFY19
PAT & PAT Margin Working Capital
PAT PAT Margin Inventory Days Receivable Days
300 Payable Days Working Capital Days
3.9% 3.9% 4.0% 4.0% 274
200 4% 225 248 219 236 264
237 236
144 200
150 129 3%
117 116
100 2%
100
46 51 47 47 52 62
50 1% 23 33
- 0% 0
FY16 FY17 FY18 9MFY19 FY16 FY17 FY18 9MFY19
LT Foods Investor presentation, March 2019 23Earnings highlights - Q3FY19 & 9MFY19 All Figures in Rs Cr unless specified
Quarterly % growth is YoY
EBITDA & PAT &
19% Revenue 9% EBITDA Margin PAT Margin
115 112 39 38.5
10.8% 10.7% 39 38.2 5%
1,117 110 10.1% 37.8
10% 38 4%
104 38 4.0% 4.1%
105 3.4% 3%
Q3FY19
958 100 37
932 100 5% 37 2%
36
95 1%
36
90 0% 35 0%
Q3FY18 Q2FY19 Q3FY19 Q3FY18 Q2FY19 Q3FY19 Q3FY18 Q2FY19 Q3FY19
EBITDA & PAT &
13.5% Revenue 2.9% EBITDA Margin 5.45% PAT Margin
EBITDA EBITDA Margin PAT PAT Margin
2,897 319
2,551 320 12.2% 120
4.3%
4.5%
116
9MFY19
315 10% 115
310 11.0% 110 4.0% 4.0%
310 110
5% 3.5%
305 105
300 0% 100 3.0%
9MFY18 9MFY19 9MFY18 9MFY19 9MFY18 9MFY19
LT Foods Investor presentation, March 2019 24Earnings highlights - Business segment performance
All Figures in Rs Cr unless specified
Branded Revenue Private Label Revenue Organic Revenue
382 406 107
557 565 587 568
535 95
88 83 84
234 235
135
Q3FY18 Q4FY18 Q1FY19 Q2FY19 Q3FY19 Q3FY18 Q4FY18 Q1FY19 Q2FY19 Q3FY19
Q3FY18 Q4FY18 Q1FY19 Q2FY19 Q3FY19
Branded & Private Label Volume Branded Domestic Revenue & Volume Branded Export Revenue & Volume
300 500
70000
247 242
250 227
77800 76,487 78,025 75,216 217 216 60000 400 360 60,000
73,936 47098 348 319
200 43,122 42,883 45,359 50000 310 326
61,012 40,212 300
54,465
150 40000
30702 36,276 34,903 40,000
31,053 29,856
40094 30000 200
30,174 100
19,537 20000 20,000
50 100
10000
0 0 0 0
Q3FY18 Q4FY18 Q1FY19 Q2FY19 Q3FY19 Q3FY18 Q4FY18 Q1FY19 Q2FY19 Q3FY19 Q3FY18 Q4FY18 Q1FY19 Q2FY19 Q3FY19
Branded Volume (MT) Private label Volume (MT) Domestic Volume (MT) Domestic Revenue (Cr) Export Volume (MT) Export Revenue (Cr)
LT Foods Investor presentation, March 2019 25Earnings highlights – Inventory & Working capital
Working capital days
Inventory Days 273 274 Dec-17 Dec-18 263 264
273 274
241 68 62 58 52
222
196 190 186
Inventory daysPayables days Receivables Working
days capital days
Inventory Volume (Th MT)
Q1FY18 Q2FY18 Q3FY18 Q4FY18 Q1FY19 Q2FY19 Q3FY19 Paddy Rice
124
116
286
221
Procurement of Paddy starts in Q3-Q4; this results in increase in
inventory from Q3-Q4. Dec-17 Dec-18
Basmati Rice is aged for average 12-18 months to enhance &
Inventory Value ( Rs Crs)
intensify taste, aroma ,and cooking characteristics. This requires
company to maintain large inventory of paddy & rice. Paddy Rice
724
602
683 919
Dec-17 Dec-18
LT Foods Investor presentation, March 2019 26Earnings highlights – Key financial ratios
2.08 1.92
1.26 1.26 1.25 1.22
1.06
Net Debt/ Equity
Q1FY18 Q2FY18 Q3FY18 Q4FY18 Q1FY19 Q2FY19 Q3FY19
1,318 1,399
1,198 1,232 1,267
689 774
Net Worth
In Rs Cr
Q1FY18 Q2FY18 Q3FY18 Q4FY18 Q1FY19 Q2FY19 Q3FY19
16.2% 16.1% 14.8%
12.8% 12.8% 12.2% 13.2%
ROCE
Q1FY18 Q2FY18 Q3FY18 Q4FY18 Q1FY19 Q2FY19 Q3FY19
LT Foods Investor presentation, March 2019 27Shareholding pattern
As on Dec 31, 2018
Other - 30%
Promoter -
56%
FPI - 2%
MF - 12%
LT Foods Investor presentation, March 2019 28Promoters & Next Gen Leaders
Vijay Kumar Arora Ashok Kumar Arora Surinder Kumar Arora Ashwani Kumar Arora
Chairman and Managing President Punjab Managing Director Managing Director & CEO
Director Operations
Abhinav Arora Aditya Arora Gursajan Arora Anmol Arora Ritesh Arora
President, LTFA Director, LT Foods Director, LT Foods Middle Director, NBFL Head – India & Far
Europe East DMCC East Business
LT Foods Investor presentation, March 2019 29Management Team
Vivek Chandra Monika Chawla Jaggia Kamal Poplai Dipol Dhole Sachin Gupta
CEO – Global Branded VP – Finance & Head, Quality Vice President, HR & General Manager,
Business Strategy Admin Finance
J.S. Oberoi Rohan Grover Sanjeev Uppal Manoj Chugh
Anubha Bajaj Head, Procurement
CEO, NBFL Director, NBFL B.V. Group Head, SCM &
Vice President, Sales
Operations
LT Foods Investor presentation, March 2019 30CIN: L74899DL1990PLC041790
Investor Contact Website: http://www.ltgroup.in/
Ms Monika Jaggia
Email - Monika.Jaggia@ltgroup.in Address : Unit-134, 1st Floor,
Rectangle-1, Saket District
Tel - 0124-3055210 DaawatBasmatiOfficial Centre, Saket,
AuthenticRoyalFoods New Delhi-110017
31You can also read