MKK May 2019 - Investor Relations
←
→
Page content transcription
If your browser does not render page correctly, please read the page content below
MKK May 2019
Agenda
1.   STS at a glance
2.   History and Footprint
3.   Business Model
4.   IPO - Strategic Projects
5.   Financial Year 2018
6.   Why invest in STS

                  www.sts.group   Slide 2
Investor Presentation

                               Key Facts                                                                                 Key Figures
STS at a                           u   Leading global supplier of soft and hard trim parts and
glance                                 systems to international commercial vehicle OEMs.                                    401 mEUR
                                                                                                                            23.7 mEUR
                                                                                                                                            Revenue 2018
                                                                                                                                            Adjusted EBITDA 2018
                                   u   Diversified customer base and significant share of business as
                                       single source.                                                                          2,500+       Employees
                                   u   Vertical integration contributes to stable performance.                                         17   Sites
                                   u   Highly attractive growth prospects based on market                                               4   R&D Centers
                                       penetration and expansion in existing and new geographies                                  80+       Years in the Industry
                                       along existing portfolio.

   STS Group as the            Sales 1)                          China                                                   Top Customers
preferred global acoustics                                                             Europe
and plastics solution                                     Americas 12%
                                                                   6%
provider for transportation                                                                 Agric. & others
systems when it comes to           Materials
                                                                                                  8%
design, comfort and                                7%
                                 China 12%                                       82%     LV 23%
efficiency.                                                  31%
                                                                                                           58%
                                                                     Acoustics                  13%
                              Plastics                                                   LCV                     MHCV
                                                49%

                                1) 2017/2018, based on management estimates.
                                                                                       ~71% Commercial vehicles

                              www.sts.group                                                           STS Group © 2019                                              Slide 3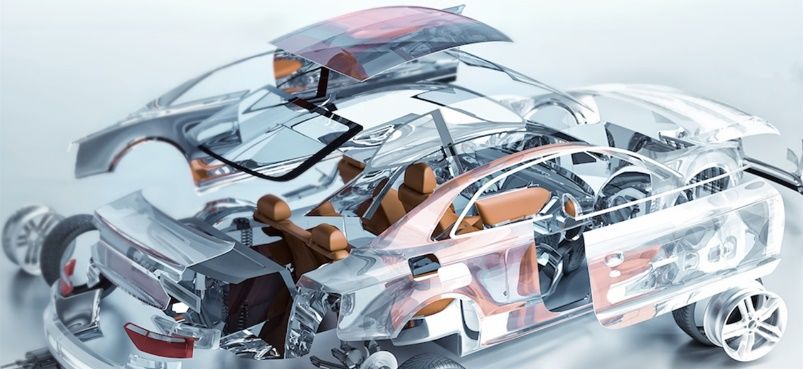
Investor Presentation

                              all values
                              in mEUR                                                                                                                Q1/2019 – Third plant
History                                                                                                                                              China
                                                                                                                                                Q4/2018 - New
                                                                                                                                                headquarters China
                                                                                                                                   2017 - Acquisition of a
                                                                                                                                   production site for truck parts
                                                                                                                                   in Brazil from Autoneum Group
                                                                                                                                   Composites – SMC
                                                                                                Plastics                           2017 - Acquisition of global
                                                                                                                                   truck supplier business from
                                                                                                               Injection molding   Plastic Omnium Group
                                              Acoustics                                                        2016 - Acquisition of two       310
  Long history to                                                                                              production sites for plastic
become one of the                                                              2015 - Start of                 truck parts from
leading global Tier 1 truck                   2013 - Establishment of STS as   greenfield plant                Mecaplast Group
suppliers for soft and                        carve-out of Autoneum’s          in Poland
                                              commercial vehicle and Italian                                                                                401
hard trim.                                    business.                                                                                310
  Till 2013 part of
Autoneum (former Rieter                             112               113            135                           136
Group) as Truck Division
and Italian Business Unit.                         2013              2014            2015                          2016                2017                 2018

                                              Spin-off                                                                                   HQ Munich           IPO

                              www.sts.group                                                 STS Group © 2019                                                           Slide 4
Investor Presentation

                                                                   France                  Germany
Global                                        St. Désirat       § Blainville                    Hallbergmoos (HQ)
                                                                                             § Kandel
                                              Précigné          § Félines
Footprint                                     Izernore          § Andance                                 Poland
                                              Tournon                                                         Międzyrzecz

                                                                                                                            China
                                                                                                                                Wuxi
                                           Mexico                                                                               Qingdao
                                               Ramos
                                                                                                                                Shiyan
                                                                                                                                Jiangyin
                                                      Brazil                                    Italy
                                                          Bétim                                           Santhiá
   STS’ global footprint
allows proximity to key                                                                                   Desio
customers enabling quick                                                                                  Pignataro
expansion into new
markets.                                                      Europe      Americas   Greater China            Total
                           Headquarters                           1                                              1          -   Headquarters
                           Manufacturing sites                   8              2           2                   12          -   R&D center
                                                                                                                            -   Manufacturing
                           Satellite sites                       4              -           -                   4
                                                                                                                            -   Satellite sites, e.g. just-in-
                           R&D centers                           3              -           1                   4               sequence
                           Employees 1)                        1,829           257         478                2,564
                           1) Based on management estimates

                           www.sts.group                                               STS Group © 2019                                                          Slide 5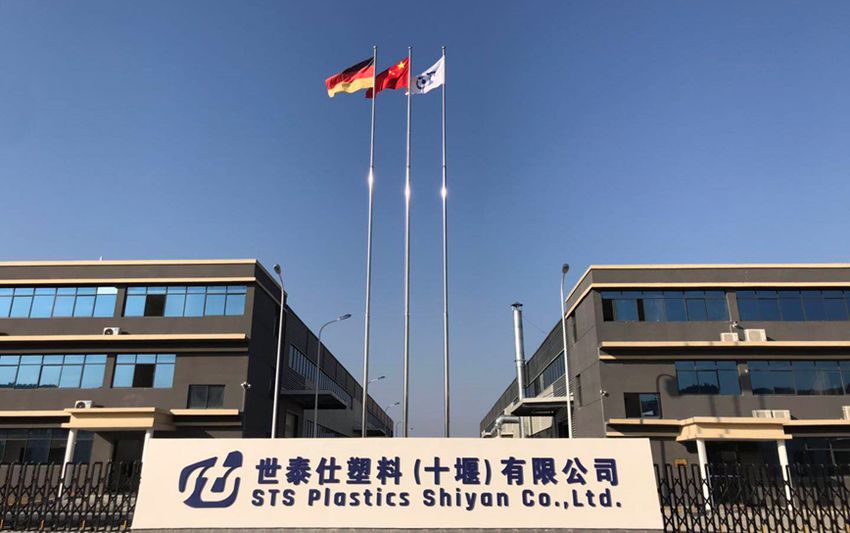
Investor Presentation

STS Group’s
                                                                                           1 Technological know-how for structural,
USP                                                                                               visual, acoustic, and thermal parts

                                                                     2                     2 Vertically integrated production from
                                                             HIGH VERTICAL                        semi-finished goods to complete
                                                              INTEGRATION                         systems
                                                               COMBINE
                                                             TECHNOLOGIES
   STS provides a vertical
integrated production                           4                                3         3 Customer-centric batch-size flexibility
process for various batch                                             1                           to meet decreasing lot sizes, e.g. for
                                              GLOBAL                         BATCH-SIZE
sizes and offers its                          REACH                          FLEXIBILITY          commercial, passenger, agricultural &
customers local                                                                                   construction vehicles
production through its
global footprint.

                                                                                           4 Global customer reach through local
                                                                                                  production
                             Source: STS, expert interviews, gp analysis

                              www.sts.group                                                 STS Group © 2019                               Slide 6
Investor Presentation

                                          Acoustics Technologies,          Composite                  Injection molding
Technology                                Felt thermoforming,
                                          PU foaming, Textile lamination
                                                                           thermocompression:
                                                                           SMC, BMC, AMC
Vertical                  Raw             Fiber                            Glass fiber                Pellets (PP, PC,
Integration               Material        Resins                           Resins                     ABS, PA, POM)

                                              BU Acoustics                   BU Materials
                                          • Cotton, polyester,             • Resin paste
                          Semi              polyamide, glass               • Glass fiber
                          Finish            wool                             reinforcement
                                          • Phenolic, polyester,           • Compression
                                            thermoplastic                  • Maturation
   The broad technology
competence and the                        • Binder                          BU Plastics / BU China
strong vertical                           • Mold design                    • Mold design              • Mold design
integration create a      Molding
                                          • Prototyping                    • Prototyping              • Prototyping
quite unique market                       • Process control                • Process control          • Process control
position for STS.                                                          • In mold coating (IMC)
                                          •   Cutting                      •   Deburring, machining   •   Deburring, machining
                                          •   Textile lamination           •   Painting               •   Painting
                          Finishing       •   PVC lamination               •   Gluing                 •   Gluing
                                          •   Assembly                     •   Assembly               •   Assembly
                                          •   Quality control              •   Quality control        •   Quality control
                          www.sts.group                                            STS Group © 2019                              Slide 7
Investor Presentation

                               Drivers for                                                            Drivers for
                               potential sales growth                                                 additional profit

                        Expanding in China:                                     Improving footprint/cost structure in Europe:
                   ü New HQ and R&D center in Wuxi                             ü New plant in best cost country
                   ü Third plant in Shyian                                     o Optimization of actual footprint
                   o Additional technology with introduction                   o Improving cost structure (e.g. BU Acoustics)
                     of injection molding

                        Entering the US Market:                                 Process Innovation:
                    ü First order from premium NAFTA truck brand               o    Increased automation in production (ongoing)
                    o New plant follows business award                         o    Operation excellence within all plants
                    o Footprint by acquisition or greenfield

                        Benefitting from system approach & new technologies:
                    ü Development of new product systems & innovations
                    ü First EV order (New customers & new applications)
                    o Expansion of new products & technologies

                                www.sts.group                                      STS Group © 2019                                Slide 8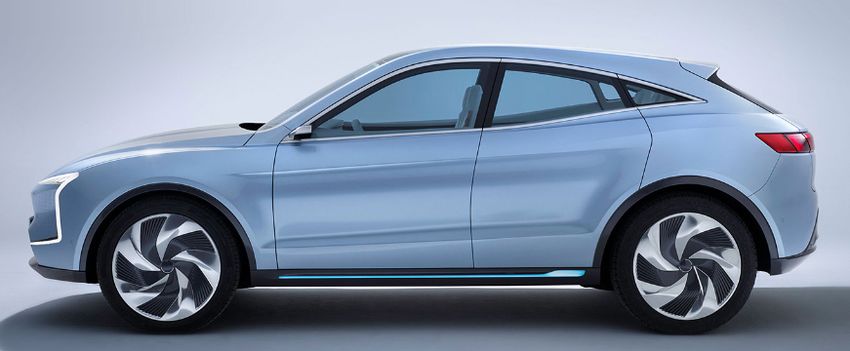
Investor Presentation
Strategic Rationale:
Expanding in u China is the world’s biggest market for medium and heavy commercial vehicles (MHCV).
u STS will gain market share significantly. based on technology know-how,
China quality and customer contact. Bejing
u Newly implemented restrictions and regulatory changes (longnose, EURO6), STS - Quingdao
are expected to have positive effect on truck demand. STS - Shiyan
STS - Wuxi
Shanghai
STS - Jiangyin
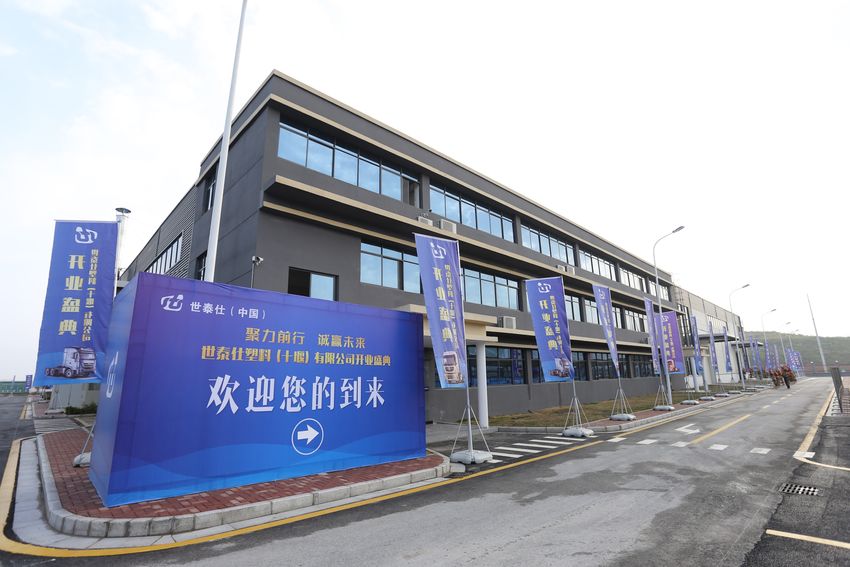
Status:
u New headquarter and R&D center in Wuxi (tech-hub, highly
qualified people) opened end of 2018
u Third plant (SMC, painting) in Shiyan opened on
11th April 2019 (SOP in Q1 2019)
Next Steps:
u Introduction of injection molding technology beside SMC 1,502
u Extend portfolio and further develop to system supplier 1,346 1,286 1,205 1,150 1,146 1,267 1,301
in China
u Further growth due to extension of market share
2018 2019 2020 2021 2022 2023 2023 2025
MHCV production China / values in 1.000 units per year / based on management estimates
www.sts.group STS Group © 2019 Slide 9
Investor Presentation
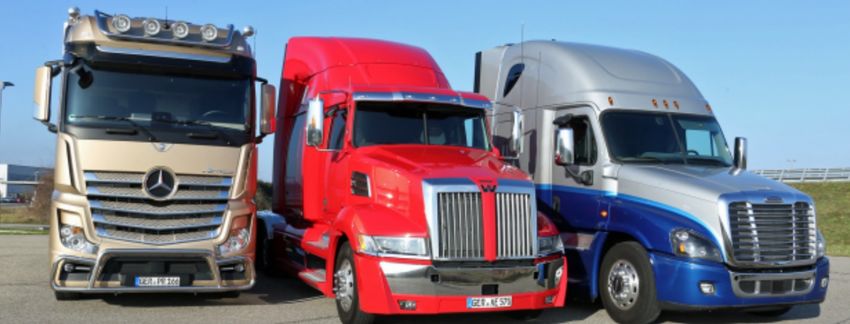
Strategic Rationale:
Entering the u North America is the world’s third biggest market for medium and heavy
commercial vehicles (MHCV).
US Market u Great demand for technological progress, such as light-weight plastic based components.
u High number of RFQ’s, with high demand for STS advanced technology.
STS - Ramos
https://www.karelfoto.com/
Status:
u Strategic first order from premium NAFTA truck brand,
will be supplied initially from plant in Mexico
u Order presents a new customer for SMC exterior parts,
with program lifetime 10 years (SOP 2020).
Next Steps:
u Discussion with major American truck OEMs are ongoing
u Establishment of local footprint (green field or 602 639 561 561 570 576 593 599
acquisition) will be analyzed after award of significant
business
2018 2019 2020 2021 2022 2023 2023 2025
MHCV production North America / values in 1.000 units per year / based on management estimates
www.sts.group STS Group © 2019 Slide 10Investor Presentation
Strategic Rationale:
Improving u Europe is the world’s second biggest market for medium and
STS - Międzyrzecz
Footprint in u
heavy commercial vehicles (MHCV).
Poland is the best cost country in Europe for Commercial Vehicle
Europe u
Interior Trim.
Several customers are placed in North Europe.
Status:
u Greenfield Plant Międzyrzecz is ramping up.
Total capacity 600,000 parts/a.
Lean Batch and JIS production for European Truck OEMs.
u Expansion: High number of new RFQ’s.
u STS invests into latest technology for
PVC Vacuum Lamination.
Next Steps:
u Further improvement to increase profitability in
Poland plant. 701 724 736 767 782 806 797
662
u New projects for better capacity utilization of Poland
plant in pipeline.
2018 2019 2020 2021 2022 2023 2023 2025
MHCV production Europe / values in 1.000 units per year / based on management estimates
www.sts.group STS Group © 2019 Slide 11Investor Presentation
Product Entry to electromobility market with order for battery
cover for e-SUV.
Innovation u New customer.
u Volume: 30,000 per year.
u SOP second half 2019.
Tech-Days in Jiangyin strengthen cooperation with
customers.
u 30 participants from 19 OEMs from automotive industry.
u Exchange information with actual and potential
customers.
u Strengthen STS’ leading technical supplier image.
Strong need for tier 1 system suppliers.
u High interest in parts for e-mobility (e.g. battery cover).
u The four STS R&D centers in Italy, China and two in
France linked their expertise and work in close
cooperation.
u STS combines acoustic, esthetic and structural
functions.
u STS further develops low density SMC (light weight).
www.sts.group STS Group © 2019 Slide 12Investor Presentation
Process Fully automated machine loading.
u High productivity.
Innovation u High quality.
Automation
Fully automated milling and deburring.
u Difficult geometry possible.
u High productivity.
u High accuracy.
www.sts.group STS Group © 2019 Slide 13Investor Presentation
Market Trend STS 2018 Comments
Market Europe +1% u European MHCV with slight increase in 2018
Development MHCV 658 662 701
u STS Group below market due to planned phase out of
truck project within BU Plastics
2017 2018 2019e
-1% u European LV market slightly down in 2018
u Acoustics negatively impacted by weak Italian LV
LV 22,216 21,981 21,645
market (-10%)
2017 2018 2019e
China u Chinese MHCV market shrinked significantly in 2018
-5% u STS considerably outperformed market with an
revenue increase of +2.4%
STS Group market share u Further contraction of Chinese market expected
MHCV 1,581 1,502 1,346 in 2019
China u STS plans to increase market share and benefit from
2017 2018 2019e new emission regulations
Americas 12%
6%
Americas u Market increase offers potential for planned market
entry in the US
+17%
82%
MHCV
Europe 636 743 794
2017 2018 2019e
all values based on management estimates / in 1.000 Units
www.sts.group STS Group © 2019 Slide 14Investor Presentation
Revenues in mEUR Key Messages:
Revenues & 29.4%
Adj. EBITDA 401 u Revenue rose by around 29% to 401.2 mEUR
310 (prior year: 310.0 mEUR).
u Increase in adjusted EBITDA of around 67% to 23.7
mEUR
(prior year: 14.2 mEUR).
2017 2018
u Adjustments (11.9 mEUR) refer to costs for IPO and
STS Group achieves Adj. EBITDA in mEUR integration costs
guidance 2018.
66.9% u Integration of acquired units completed in 2018.
23.7
14.2 5.9%
4.6%
2017 2018
www.sts.group STS Group © 2019 Slide 15Investor Presentation
Revenues in mEUR
Revenues & 23.3
20.0
-4.8
u Revenue decrease of BU Acoustics primarily due to
lower volumes of Italian LCV/LV market
Adj. EBITDA 60.9
u Growth of BUs Plastics and Materials due to full year
per Business 401.2
effect of businesses acquired in 2017
Unit 310.0 -8.3 u Organically, BU Plastics decreased due to planned
phase out of truck project
u Organic growth of BU China amounts to +2.4%
2017 BU Acoustics BU Plastics BU China BU Materials Conso 2018
Top line growth Adj. EBITDA in mEUR
essentially attributable to 3.0 0.7 u BU Plastics and BU China with major contributions to
acquisitions carried out in -0.5 growth of Adj. EBITDA, also due to numerous
10.3
financial year 2017. efficiency measures
u Decline of Adj. EBITDA of BU Acoustics due to lower
23.7 topline and ramp-up costs of Polish plant
14.2
-4.0
2017 BU Acoustics BU Plastics BU China BU Materials Conso 2018
www.sts.group STS Group © 2019 Slide 16Investor Presentation
Net Result y.e. 2018 in mEUR
Net Result & 5.9%
u EBITDA adjustments for IPO costs and integration of
2017 acquired activities
Equity u Depreciation in line with CAPEX, which refers mainly
-3.8 3.0%
23.7
to investments for maintenance, new projects and
-7.9
11.9
strategic growth
-0.3% -1.2%
-4.8 u Exluding adjustments net result would be
-13.2 -1.3
-3.5 positive in 2018
Adj IPO Integ. EBITDA Deprec. EBIT Interest/Tax Net
EBITDA Result
Negative net result in Equity in mEUR
2018 but increase of equity u Strong increase of equity due to IPO
level.
u Solid equity level with ard. 30%
26.5 30.1%
22.1%
-4.9
82.5
60.9
2017 y.e. Cap Increase Result 2018 2018 y.e.
www.sts.group STS Group © 2019 Slide 17Investor Presentation
Net Liquidity Dec. 31, 2018 in mEUR
Net Debt u Positive net liquidity position as of Dec 31,
(prior year: -8.7 mEUR)
2018
31.2
& Liquidity u Liquidity situation gives financial flexibility
(e.g. for acquisitions)
-22.9 8.3
Cash Debts Net Liquidity
Solid financial position. Liquidity in mEUR
u Significant increase of liquidity in 2018
22.1 u Operating Cash-flow positive despite high payouts
for special items
7.1
u CAPEX ard. 3.5% of Sales
31.2
u Financing Cash-flow positive due to capital increase
15.8 -13.9
2017 y.e. Operating CF CAPEX Financing CF 2018 y.e.
www.sts.group STS Group © 2019 Slide 18Investor Presentation
Share Price Shareholder Data
Share Value in t pcs.
180
in €
30
160
Free Float 27.2%
25
140 Mutares AG 64.8%
120 20
100
15
80
60 10
Main First 8.0%
40
5
20
ISIN: Jun 1 8 Jul 18 Jul 18 Aug 18 Sep 18 Oc t 18 Nov 1 8 Dec 18 Jan 1 9 Feb 19 Mar 1 9
0
DE000A1TNU68
Ticker symbol:
Date Publ. Target Rec. ISIN: DE000A1TNU68
SF3
15/04/2019 SMC Research 15.10 € Speculative Buy Number of Shares: 6,000,000
Regulated Market:
Prime Standard 05/04/2019 MainFirst 12.00 € Outperform Market Cap: 63 mEURO
27/02/2019 H&A 17.00 € Buy EV/EBITDAx ard. 3.5
www.sts.group STS Group © 2019 Slide 19Investor Presentation
mid-term
2019 &
mid-term
2019e 2023e
Guidance
u Market environment in the u Attractive future growth
automotive industry will perspectives.
continue to be challenging
Attractive future growth u Revenue expected to remain at u Target revenue ≥ 500 mEUR
perspectives. previous year's level
u Adjusted EBITDA at least at u Target EBITDA margin ≥ 10%
previous year’s level
(2018: 23.7 mEUR), increase of
EBITDA by ≥ 100% compared to
previous year (2018: 11.9 mEUR)
www.sts.group STS Group © 2019 Slide 20Investor Presentation
Why invest One of the leading global system suppliers for interior and exterior trim
Excellent market position
in STS parts with focus on commercial vehicles
Group? Outstanding visibility Solid order book with approx. 1.9 bnEUR of revenue already contracted
until 2022, plus additional pipeline
Cross-selling Trusted Tier 1 partner for leading European and Chinese truck OEMs with
significant cross-selling potential through combination of technologies
Strong growth prospects Expansion in China to benefit from strong truck market and direct entry
into the US with own production
Vertical integration Vertically integrated along the value chain and technological expertise
resulting in full process control and securing competitive advantage
Solid entry barriers Material and process know-how as significant and customer-relevant
entry barriers, matching industry trends emission and weight reduction
www.sts.group STS Group © 2019 Slide 21Investor Presentation
Disclaimer This presentation may contain forward-looking statements that are subject to risks and
uncertainties, including those pertaining to the anticipated benefits to be realized from
the proposals described herein. Forward-looking statements may include, in particular,
statements about future events, future financial performance, plans, strategies,
expectations, prospects, competitive environment, regulation and supply and demand.
STS Group AG has based these forward-looking statements on its current views and
expectations and on certain assumptions of which many are beyond STS Group AG’s
control. Actual financial performance could differ materially from that projected in
forward-looking statements due to the inherent uncertainty of estimates, forecasts and
projections, and financial performance may be better or worse than anticipated. Given
these uncertainties, readers should not put undue reliance on any forward-looking
statements. The information contained in this presentation is subject to change without
notice and STS Group AG does not undertake any duty to update the forward-looking
statements, and the estimates and assumptions associated with them, except to the
extent required by applicable laws and regulations.
This presentation includes references to non-IFRS financial measures, including, but not
limited to: FCF, EBITDA, EBITA, EBIT, EBITA margin, capital expenditure as percentage of
revenue, other operating income, net financial debt, and net working capital. We have
provided these measures and other information in this presentation because we believe
they provide investors with additional information to assess our performance. Our use of
these supplemental financial measures may vary from others in our industry and should
not be considered in isolation or as an alternative to our results as reported under IFRS.
Due to rounding, numbers presented throughout this and other documents may not add
up precisely to the totals provided and percentages may not precisely reflect the
absolute figures.
www.sts.group STS Group © 2019 Slide 22Thank you for your attention
Contact Us
Stefan Hummel
Head of Investor Relations
ir@sts.groupAgenda Upcoming conferences / publications…
7/8 May 2019 MKK Munich Capital Market Conference, Munich
1. STS at a glance
15 May 2019 Publication Quarterly Statement (call-date Q1)
2. History and Footprint 17 May 2019 Annual General Meeting
3. Business Model 28 May 2019 MainFirst SMID CAP Event, Frankfurt/Main
4. IPO - Strategic Projects 4 June 2019 Prior Capital Market Conference, Frankfurt/Main
5. Financial Year 2018 27 June 2019 Market Capital Day, Frankfurt/Main
6. Why invest in STS 7 August 2019 Publication half-yearly financial report
7. Financial Calendar 2/3 September 2019 Autumn Conference, Frankfurt/Main
11 September 2019 ZKK Zurich Capital Market Conference, Zurich
6 November 2019 Publication Quarterly Statement (call-date Q3)
25/27 November 2019 German Equity Forum 2019, Frankfurt/Main
www.sts.group Slide 24Investor Presentation
Executive Board
STS Group
Board
Andreas Becker Dr. Ulrich Hauck Patrick Oschust
CEO CFO COO
STS Board Member since 2013 STS Board Member since 2019 STS Board Member since 2013
22 Years Industry Experience 20 Years Industry Experience 19 Years Industry Experience
Highly experienced Supervisory Board
managers with track
record in the automotive
industry.
Robin Laik Dr. Kristian Schleede Bernd Maierhofer
Chairman Supervisory Board Member Supervisory Board Member Supervisory Board
STS Board Member since 2018 STS Board Member since 2014 STS Board Member since 2018
20 Years Industry Experience 30 Years Industry Experience 29 Years Industry Experience
www.sts.group STS Group © 2019 Slide 25Investor Presentation
Product Systems
Plastics / Injection molding
Portfolio Exterior Trim - Storage Compartment
Plastics / SMC - Under Bunk Storage
STS Group - Roof Spolier
Interior Trim for Engine
Acoustic / Acoustic Isolation
Thermal Isolation: & SMC Covers
- Rear/Side Wall - Engine Hoodliner
STS offers the complete
set of product solutions - Headliner
for interior trim, exterior
trim and acoustics of a
truck cabin.
STS components Exterior Trim
contribute to comfort, Plastics / SMC
functionality, aerodynamic - Side Panels Exterior Trim
and weight reduction. - Fender Plastics / Injection molding
- Tailgate & SMC
- Frontmodul
www.sts.group STS Group © 2019 Slide 26Investor Presentation
Medium and Heavy Commercial Vehicle (MHCV) Light Commercial Vehicle (LCV)
Product Headliner NVH Cabin NVH Cabin
Rear Wall
Portfolio Module Trim Floor
Roof Deflector
MHCV, LCV Door Panels
Exterior Pillar Emblem
Trim Support
Storage Complete
Compartment Front Module
STS offers a complete
Thermo-
set of product solutions Light Casing acoustic
for interior trim, exterior
trim and acoustics. Under Bunk Entry Step
Storage Module
NVH Cabin NVH Engine NVH Outer
Floor Hoodliner Door Guards
Dash
NVH - Noise Vibration Harshness
www.sts.group STS Group © 2019 Slide 27Investor Presentation
Revenues in mEUR
Revenues & u Second half year with lower topline than first six
months due to lower production in Europe due to
Adj. EBITDA holiday season (>10% less working days)
1HY vs. 2HY -12.8
0.4
u Phase out of truck project of BU Plastics
2018 218.2
-15.8 -3.3 -3.7 183.0 u Decline of European Passenger Car market in the
second half
1HY 2018 BU Acoustics BU Plastics BU China BU Materials Conso 2HY 2018
Second half year 2018 Adj. EBITDA in mEUR
weaker than first half. u Adjusted EBITDA decreased in second half of the
year, mainly due to lower revenues
u BU results negatively affected by true up of HQ cost
-3.2 allocation in fourth quarter
15.9 2.0
-5.0
-1.3 7.8
-0.7
1HY 2018 BU Acoustics BU Plastics BU China BU Materials Conso 2HY 2018
www.sts.group STS Group © 2019 Slide 28Investor Presentation
Key Revenue in mEUR Adjusted EBITDA in mEUR
Financials BU Acoustics
124.4
BU Acoustics
-1.2
2018 by BU
132.6 2.7
198.6 16.7
BU Plastics BU Plastics
137.7 6.4
48.6 7.2
BU China BU China
25.3 4.1
∑ STS Group ∑ STS Group
40.0 consolidated: 1.9 consolidated:
BU Materials 401.2 mEUR BU Materials 23.7 mEUR
20.0 1.2
(310.0 mEUR PY) (14.2 mEUR PY)
12M/2018
Adjusted EBITDA in % of revenue CAPEX in mEUR*
12M/2017
-1.0% 3.8
BU Acoustics BU Acoustics
2.1% 11.9
8.4% 3.1
BU Plastics BU Plastics
4.6% 42.7
14.7% 3.8
BU China BU China
16.4% 14.8
∑ STS Group ∑ STS Group
consolidated: consolidated:
4.8% 0.4
BU Materials 5.9% BU Materials 12.0 mEUR
6.2% 9.2
(4.6% PY) (79.1 mEUR PY)
*values for 2017 include investments in intangible/tangible assets from acquisitions
www.sts.group STS Group © 2019 Slide 29Investor Presentation
Income
Statement mEUR IFRS FY2018 FY2017
Revenue 401.2 310.0
Inventory changes 5.8 2.5
Other operating income 4.5 55.7
Cost of materials -233.8 -190.6
Personnel expenses -103.9 -75.6
Other operating expenses -61.9 -47.0
EBITDA 11.9 55.0
Revenue FY2017
Depreciation and amortisation -13.2 -8.2
(310 EURm) increased by
>29% to 401.2 EURm for EBIT -1.3 46.9
FY2018 due to past Financial result -2.0 -3.1
acquisition. EBT -3.3 43.8
Adjusted EBITDA Taxes -1.5 3.1
margin increased to Net result -4.8 47.0
5.9%. Adjusted EBITDA 23.7 14.2
Adjusted EBITDA in % of revenue 5.9% 4.6%
www.sts.group STS Group © 2019 Slide 30Investor Presentation
Balance
31 Dec 31 Dec 31 Dec 31 Dec
Sheet mEUR IFRS
2018 2017
mEUR IFRS
2018 2017
Intangible assets 25.6 24.6 Total equity 82.4 60.7
Property, plant and equipment 78.7 79.0 Contract liabilities 1.1 0
Contract assets 0.1 0
Trade payables 0.8 0.6
Other financial assets 0.2 0.3
Other financial liabilities 13.2 17.1
Tax receivables 0.1 1.6
Other assets 3.0 0.8 Provisions 20.1 21.1
Deferred tax assets 8.0 8.6 Deferred tax liabilities 4.0 7.0
Non-current assets 115.6 114.8 Non-current liabilities 39.2 45.9
Cash and cash Inventories 29.9 28.1 Contract liabilities 4.7 0
equivalents amount Contract assets 5.0 0.0 Trade payables 70.0 83.8
increased to 31.2 mEUR. Trade and other receivables 81.1 99.3
Other financial liabilities 49.2 45.6
Other financial assets 1.2 13.1
Equity ratio increase Other assets 6.6 3.8
Provisions 1.1 3.4
to 30%. Tax receivables 1.2 0.0 Income tax liabilities 0.1 1.7
Cash and cash equivalents 31.2 15.8 Other non-financial liabilities 27.1 33.9
Restricted cash 2.0 0.0 Current liabilities 152.3 168.4
Current assets 158.2 160.2 Total equity and liabilities 273.8 275.0
Total assets 273.8 275.0 Equity ratio in % 30% 22%
www.sts.group STS Group © 2019 Slide 31Investor Presentation
Cash
31 Dec 31 Dec
Flow mEUR IFRS
2018 2017
Net Income -4.8 47.0
Change in NWC 1.9 -7.2
Operating NCF 7.1 -8.7
Investing NCF -13.9 -17.2
Financial NCF 22.1 39.2
Net increase/decrease 15.3 13.2
Cash at the beginning of period 15.8 2.6
Financing Cash-flow
positive due to capital Cash at the end of period 31.2 15.8
increase.
www.sts.group STS Group © 2019 Slide 32You can also read