KION GROUP AG Corporate Presentation - Frankfurt, July 2019
←
→
Page content transcription
If your browser does not render page correctly, please read the page content below
KION GROUP AG
Corporate Presentation
Frankfurt, July 2019
KION Group at a glance
A world leader in Supply Chain Solutions, Industrial Trucks, Services

                   European                                        Global presence
                                                                                                          Global
                                                                     in more than
      No. 1 + Global No. 2                                                                                No. 1
    in Industrial Trucks and Services
                                                                         100
                                                                                              in Supply Chain Solutions
                                                               countries with more than
                                                                      33,000
                                                                      employees

                1.4 million                                                                    More than 6,000
                                                                                                installed warehouse
            Growing truck base                                      Around 1,700
            worldwide support                                                                          systems
                                                             sales and/or service locations
            after sales business                                                                    at customers

                                                            World-renowned brands
                                                               are clear industry leaders

2      KION GROUP AG | Corporate Presentation | July 2019                                        © 2019 KION GROUP AG. All rights reserved.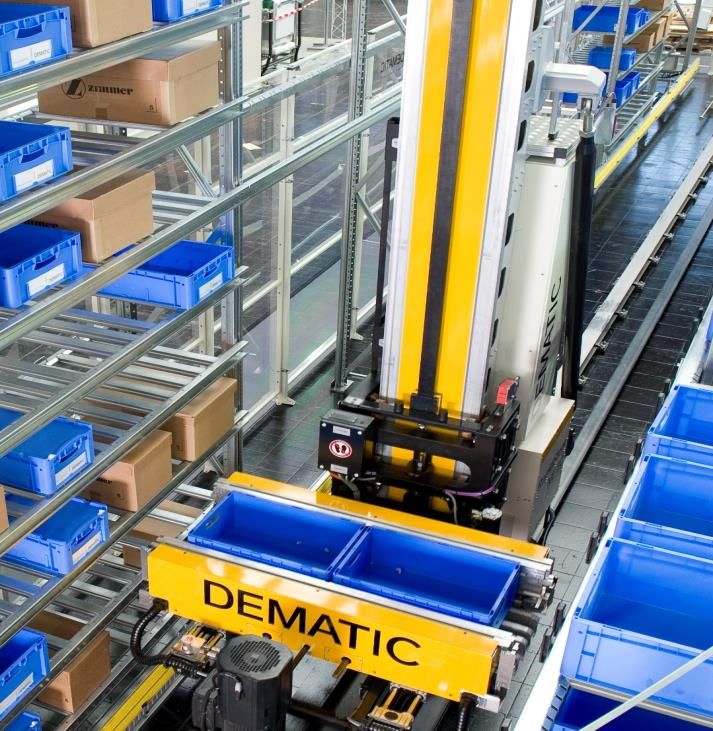
KION Group at a glance
A truly global player with a well-balanced portfolio

                                      2018                               Revenue 2018

    €€€        € 8.0 billion revenue                                    74%                           26%
                                                         Industrial Trucks                   Supply Chain
                                                         and Services                           Solutions
                9.9% adjusted EBIT margin
                                                           21%                 68%                           11%
                                                         Americas             EMEA                        APAC

               > 33,000 highly skilled employees

                                                                     57%                        43%
                                                         New Business                                Services

3   KION GROUP AG | Corporate Presentation | July 2019                            © 2019 KION GROUP AG. All rights reserved.
Our shared KION Group values

       INTEGRITY                              COLLABORATION                    COURAGE               EXCELLENCE

                                                                                                     We create outstanding
     We do what is right.                           We trust each other.   We change and innovate.
                                                                                                       customer value.

4   KION GROUP AG | Corporate Presentation | July 2019                                                © 2019 KION GROUP AG. All rights reserved.
Strategy “KION 2027“
Aspiration for profitable growth

                                                                                           Grow above the material
                                                                                           handling market
                                                                          Growth

    Provide attractive return on
    capital for shareholders
                                                             Capital     Profitable   Profita-
                                                            efficiency    growth       bility
                                                                                                        Remain most profitable
                                                                                                        player in the industry

                                                                         Resilience
                    Maintain profitability
                    across business cycle

5      KION GROUP AG | Corporate Presentation | July 2019                                                 © 2019 KION GROUP AG. All rights reserved.
Strategy “KION 2027“
Strategic fields of action set priorities

                                                                 Digital solutions
                                                                  and processes
    Efficient use of energy,                                                                            Automation solutions
    new energy sources                                                                                     for our customers

                                              Energy                    Digital            Automation

                                                           Innovation             Performance

Innovation ecosystem,                                                                            High-performing products,
agile development processes                                                                             efficient processes

6     KION GROUP AG | Corporate Presentation | July 2019                                                 © 2019 KION GROUP AG. All rights reserved.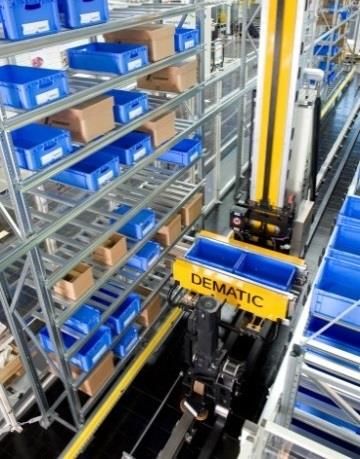
Growth drivers and trends
Attractive market with growth profile above GDP

Industrial trucks demand grows approx. 1.5x World                                                                         Growth drivers
GDP1
Growth in % per year                                              Global new trucks                Global GDP
                                                                                              8.6%                             Globalization
                                                                                                                               Globalisation                Industrialization
                                                                                                                                                             Industrialisation
          4.1%                         4.2%
                    3.3%                       2.8%               3.0% 2.5%                             2.8%

         1980 - 1990                 1990 - 2000                2000 - 2010                  2010 - 2018                                   Fragmentation ofof
                                                                                                                                           Fragmentation
                                                                                                                                            Supply  Chains
                                                                                                                                             supply chains
    Automation systems: Growth indicators 2018

                     +14%                                                        +9%                                            E-Commerce
                                                                                                                                E-Commerce                       Industry  4.0
                                                                                                                                                                 Industry 4.0
                     Global                                                     Global
                  E-commerce                                                  warehouse
                    growth2                                                    capex3
                                                                                                                                Automation
                                                                                                                                Automation                     Digitalization
                                                                                                                                                                Digitisation

1   Calculated based on CAGRs for new truck sales and GDP for 1980-2018
2   Outlook for global e-commerce growth in 2018; E-Commerce Foundation
3   Projected capital expenditure growth for warehousing equipment and technology in 2018; Peerless Research Group 2018                            Source: WITS/FEM, IMF; Modern Materials Handling 2011-2018

7           KION GROUP AG | Corporate Presentation | July 2019                                                                                              © 2019 KION GROUP AG. All rights reserved.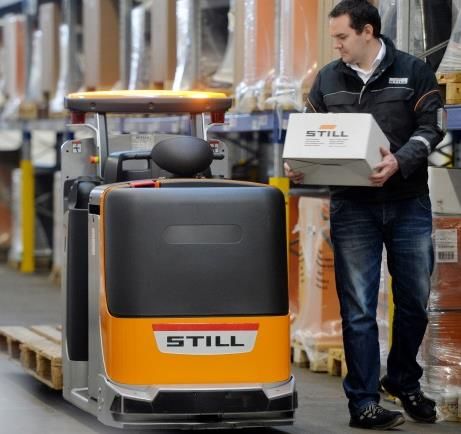
KION Group segments
A unique and complete material handling offering

                                                             KION Group segments

     Industrial Trucks and Services                          Supply Chain Solutions     Corporate Services

                  Operating Units                                Operating Unit
    incl. Financial Services

                Linde MH EMEA                                       Dematic           Internal service entities
                   STILL EMEA                                                            Holding functions
                 KION Americas
               KION Asia Pacific

8       KION GROUP AG | Corporate Presentation | July 2019                                  © 2019 KION GROUP AG. All rights reserved.
KION Group segments
A unique and complete material handling offering

              Industrial Trucks and Services             Supply Chain Solutions

                                                                                                               Corporate Services
9   KION GROUP AG | Corporate Presentation | July 2019                       © 2019 KION GROUP AG. All rights reserved.
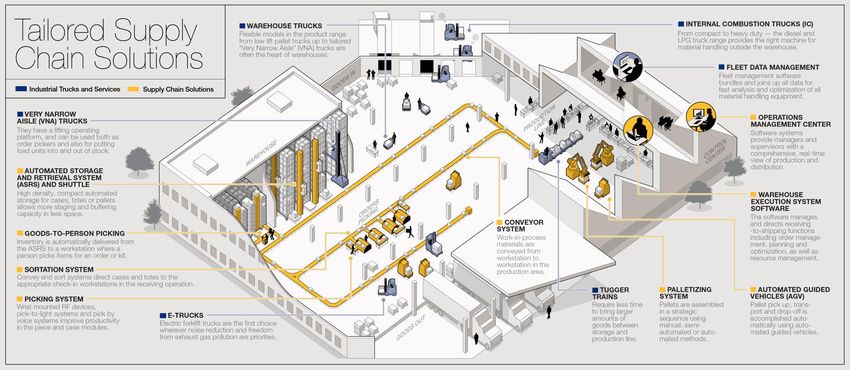
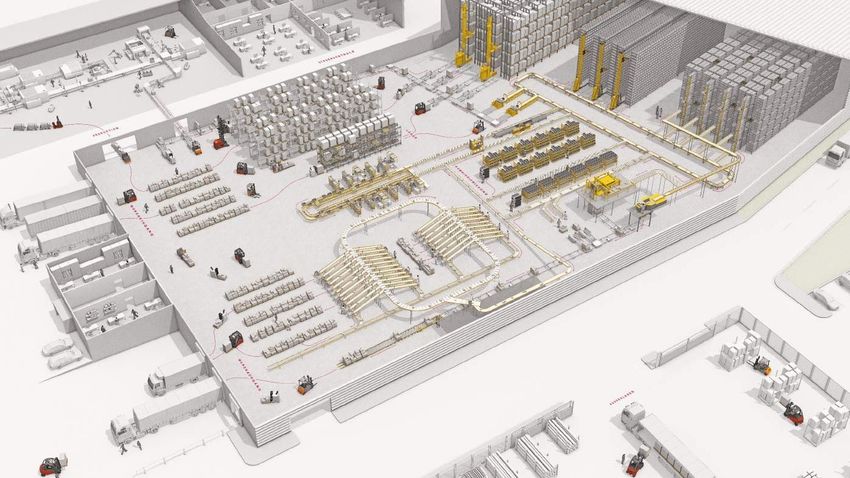
Integrated total offering across KION
From industrial trucks to fully automated warehouses

                                                          Fleet data   Warehouse
                                                                                   E-trucks               IC-trucks
                                                          management   trucks

10   KION GROUP AG | Corporate Presentation | July 2019                                       © 2019 KION GROUP AG. All rights reserved.
Industry 4.0 and Internet of Things (IoT)
How the KION Group adds value to customer operations and warehouses
Automation systems
Automated trucks
Cloud based fleet data Customized integrated
management soft- and hardware
Full range of automated intralogistics solutions
Intelligent trucks series trucks
Fleet data services Solutions for robotic
connect trucks with Enable automation of the piece picking
Trucks equipped with management tool entire material flow
electronic control unit
Financial and security
Increased efficiency also benefits
from driver assistance
systems
11 KION GROUP AG | Corporate Presentation | July 2019 © 2019 KION GROUP AG. All rights reserved.Benefits for the customer
Cost-efficient material handling
68%
EMEA
✓Acceleration of ✓Prevention of ✓Optimization of
product handling accidents & operation times &
& shipment damages energy consumption
12 KION GROUP AG | Corporate Presentation | July 2019 © 2019 KION GROUP AG. All rights reserved.Market-leading positions globally
A unique player in Intralogistics 4.0
Industrial trucks Automation systems
Top 6 suppliers 2018 Top 6 suppliers 2018
− Unique combination
1 Toyota + 1
of industrial trucks
2 2 SSI Schäfer and automation
systems
3 Mitsubishi Logisnext 3 Toyota (Vanderlande + Bastian)
4 Jungheinrich 4 Daifuku
− Market-leading
5 Crown 5 Honeywell (Intelligrated) positions globally
6 Hyster-Yale 6 Knapp
Source: Börsen-Zeitung, 26 April 2019
13 KION GROUP AG | Corporate Presentation | July 2019 © 2019 KION GROUP AG. All rights reserved.Industrial Trucks and Services 14 KION GROUP AG | Corporate Presentation | July 2019 © 2018 KION GROUP AG. All rights reserved.
Industrial Trucks and Services: Segment overview
A world leader in industrial trucks with a strong service business

     Key financials                                                                                                                Revenue by product5
     (in €m)                                          Q1-Q2 2019                2018            20171             2016
     Order intake                                                3,084          6,211           5,859            5,383                                  Services                                      New Business
                                                                                                                                                            48%                                       52%
     Revenue                                                     3,147          5,922           5,572            5,203
     Adjusted EBIT2                                                 327           655              643              587
     Adjusted EBIT Margin2                                      10.4%      11.1%               11.5%            11.3%

     Revenue by geography3,5                                                                                                       Truck order intake by industry4,5
                      South America 2% RoW 3%
                                                                                                                                               Other Industries 22%                        Logistics 17%
                    North America 2%
                         Asia 10%            Germany 24%
                                                                                                                                              Paper & Print 3%                                      Metals 12%
                            EEU 9%                                                                                                           Construction 6%
                                                                          France 15%                                                               Beverage 6%                                        Food 10%
               Rest of WEU 15%
                                                                                                                                                     Wholesale 7%
                                      Spain 4%        UK 7%                                                                                                                                Chemicals 10%
                                                                                                                                                          Automotive 8%
                                              Italy 7%
1 Including   effects of the first-time adoption of IFRS 15 and IFRS 16     2   Adjusted in line with KION Group’s adjusted financial performance indicators   3 May   not add up to 100% due to commercial rounding
4 Calculation   based on German customer base                               5   Financial Year 2018

15            KION GROUP AG | Corporate Presentation | July 2019                                                                                                                           © 2019 KION GROUP AG. All rights reserved.
Integrated Industrial Trucks and Services business model
Global capital goods ecosystem of products and services
New
~ 48% of new truck sales Financial
truck
carry financing contracts Services
sales
Products
Ongoing customer relationship Most financing contracts
(e.g. short-term rental) also contain service
triggers new truck sales contracts
Services
Rental After duration of financing, Aftersales
and used trucks are used in rental fleet and service
trucks or sold as used trucks solutions
16 KION GROUP AG | Corporate Presentation | July 2019 © 2019 KION GROUP AG. All rights reserved.Industrial Trucks and Services
A unique range of products1 serving customer needs worldwide
Internal combustion (IC) counter-balanced
trucks
Mainly used outside
Electric (E) counter-balanced trucks
Mainly used inside
Warehouse technology: rider trucks
Faster transportation of loads
Specially designed for warehouse requirements
Warehouse technology: pedestrian trucks
Transportation of loads at a walking pace
Tractors
Industrial processes / train stations /
airports
Automated and autonomous vehicles
Warehouse & distribution solutions
1 The products shown are just a selection of our comprehensive product range.
17 KION GROUP AG | Corporate Presentation | July 2019 © 2019 KION GROUP AG. All rights reserved.Supply Chain Solutions 18 KION GROUP AG | Corporate Presentation | July 2019 © 2019 KION GROUP AG. All rights reserved.
Supply Chain Solutions: Segment overview
Leading in material handling automation solutions

     Key financials                                                                                                          Revenue by product3
     (in €m)                                         Q1-Q2 2019            2018        20171                2016                                      Services
     Order intake                                               1,109      2,425       2,099                  431
                                                                                                                                                          26%
                                                                                                                                                                                        Business solutions
     Revenue                                                    1,211      2,055       2,010                  366                                                                       74%
     Adjusted EBIT2                                                112      180             189                   6
     Adjusted EBIT Margin2                                       9.2%      8.8%         9.4%                1.6%

     Revenue by region3                                                                                                      Revenue by industry3

                                        APAC 9%                                                                                                   Other 12%
                                                                                                                                          Parcel 1%
                                                                                                                                                                                    E-Commerce 47%
                                                                                                                                       Grocery 5 %
                                                                                                                                    Wholesale 6%
                          EMEA 25%
                                                                                                                             Food and beverage 6%
                                                                          Americas 66%
                                                                                                                                                    Apparel 8%
                                                                                                                                     General merchandise 15%
1 Including   effects of the first-time adoption of IFRS 15 and IFRS 16        2 Adjusted   in line with KION Group’s adjusted financial performance indicators   3   Financial Year 2018

19            KION GROUP AG | Corporate Presentation | July 2019                                                                                                             © 2019 KION GROUP AG. All rights reserved.
Supply Chain Solutions
Comprehensive integrated range of high-end automation solutions
Advanced warehouse execution system and asset management system
Conveyor Sortation Storage Picking Palletising
− All conveyor types − Focus on fast, − Complete storage − Voice-directed − Mixed case
for assembly, reliable sortation range including picking palletising
manufacturing and − Full sortation AS/RS1, shuttles − Pick and Put-to- solutions
distribution technology range and racking Light systems
− Robotic picking
Customer service, upgrades and refurbishments
1 AS/RS = Automated storage and retrieval systems
20 KION GROUP AG | Corporate Presentation | July 2019 © 2019 KION GROUP AG. All rights reserved.Supply Chain Solutions
Total life cycle support optimizes system productivity
Worldwide service network
Spare parts • More than 600 service employees in 18 countries reach
service 90% of customers within two hours
Moderni-
Consulting, • Remote monitoring, diagnostics and support
zation,
training • Focus on faultless system
upgrades
Dematic
service Modernization and upgrades
solutions 68% • New life for old systems regardless of make or model
Operations EMEA
support
Remote • Increased throughput, productivity and accuracy
monitoring
onsite • Customized programmes can be implemented with
Customer minimal disruption to operational schedule
service
onsite
21 KION GROUP AG | Corporate Presentation | July 2019 © 2019 KION GROUP AG. All rights reserved.KION Group history
Two centuries of leadership
First manufacturer First steps towards using
Start of forklift truck Launch of lithium-ion battery modules in
World’s first Production of first to introduce ergonomic
Start of production at STILL. hybrid trucks various electric truck models
Automated DEMAG storage and 351 series sets model in India Acquisition
forklift truck new design and
First electric trolleys Guided Vehicle retrieval machines of
production at
Operational
and forklift trucks (AGV) performance Dematic
Fenwick standards for Start of iGoEasy
forklift trucks Launch of 39X
truck
Start of Start of forklift truck
forklift truck production at LMH Launch of energy Start of KION
Strategy 2020
production Hubtrac – First saving program Strategy
at OM forklift truck with Blue Q 2027
hydro-static drive
1819 1900 1910 1920 1930 1940 1950 1960 1970 1980 1990 2000 2010 2012 2013 2014 2015 2016 2017 … 2019
JV with Strategic
Acquisition of
Baoli Partnership
Retrotech
Foundation with Weichai
Acquisi-
of OM Power
tion of
Corporate
Foundation Fenwick Formation of Dematic acquires
of Voltas KION Group, SDI Group and
acquisition JV with Voltas Reddwerks
Foundation of by Voltas
Güldner Motoren- Linde AG
KKR/GSCP becomes
Gesellschaft by takes over
Formation of Combination of KION India Acquisition of
Carl von Linde, STILL
Rapistan (USA) OM and STILL in Egemin Handling Joint venture
Hugo Güldner and Foundation of Baoli Italy Automation with BMZ for
partners lithium-ion
Formation of Demag, Mech. batteries
Foundation of Foundation IPO of KION
Werkstätten (Germany) Dematic acquires HK Linde NA becomes
STILL of Colby (Australia) Linde AG takes over OM GROUP AG
Systems KION North America
22 KION GROUP AG | Corporate Presentation | July 2019 © 2019 KION GROUP AG. All rights reserved.Shareholder structure
Included in MDAX, STOXX Europe 600 indices and MSCI World
Shareholder structure June
Aktionärsstruktur zum 2019
22. Juli 2016
KION GROUP AG
0.1 %
Free float Weichai Power
54.9 % 45.0 %
23 KION GROUP AG | Corporate Presentation | July 2019 © 2019 KION GROUP AG. All rights reserved.Global manufacturing network
Production facilities for Industrial Trucks and Supply Chain Solutions
Hamburg
Dinklage
Holland Grand Rapids
Zwijndrecht Bielefeld
Suzhou Jingjiang
Geisa
Salt Lake City HQ Frankfurt
Kahl
Pune Stříbro
Heusenstamm/
Summerville Offenbach Českŷ Krumlov
Xiamen
Monterrey Aschaffenburg Weilbach
Reutlingen
Châtellerault
Milan
Luzzara
Belrose
Indaiatuba
24 KION GROUP AG | Corporate Presentation | July 2019 © 2019 KION GROUP AG. All rights reserved.Strong global sales and service network provides unique access
to a global customer base
Americas EMEA Asia Pacific (APAC)
~ 360 sales and/or ~830 sales and/or ~520 sales and/or
service locations service locations service locations
More than 1,700 sales and/or service locations in over 100 countries with ~18,000 multi-skilled
industrial trucks service staff1 and more than 3,000 systems engineers
1 Includes direct and additional external service staff
25 KION GROUP AG | Corporate Presentation | July 2019 © 2019 KION GROUP AG. All rights reserved.Financials
Key figures
Incl. KION GROUP AG
KION GROUP AG
Dematic (excl. Dematic)
(in € m) Q1-Q2 2019 2018 20171 20172 2016 2016
Order intake 4,197 8,657 7,979 7,979 5,833 5,553
Revenue 4,364 7,996 7,598 7,654 5,587 5,328
Adjusted EBITDA3 804 1,555 1,496 1,224 932
Adjusted EBITDA margin3 18.4% 19.4% 19.7% 16.0% 16.7%
Adjusted EBIT3 408 790 777 766 537 527
Adjusted EBIT margin3 9.3% 9.9% 10.2% 10.0% 9.6% 9.9% 1 Including
effects of the first-time adoption of
IFRS 15 and IFRS 16
Net income 218 402 423 426 246 2 Annualreport 2017, without effects of the first-
time adoption of IFRS 15 and IFRS 16
ROCE4 – 9.3% 9.3% 9.9% 6.9% 12.4% 3 Adjusted for PPA items and non-recurring
items
Capital expenditures5 113 258 218 218 167 4 ROCE is defined as the proportion of EBIT
adjusted to capital employed
Total R&D spending 112 222 212 212 147 5 Capital
expenditures including capitalised
development costs, excluding right of use
assets
Free cash flow6 -32 520 474 378 -1,850 317
6 Freecash flow is defined as cash flow from
operating activities plus cash flow from
Net financial debt 2,129 1,870 2,096 2,096 2,903 investing activities
7 Number of employees (full-time equivalent) as
Employees7 33,740 33,128 31,608 31,608 30,544 at end of period
26 KION GROUP AG | Corporate Presentation | July 2019 © 2019 KION GROUP AG. All rights reserved.KION Group
A world leader in supply chain solutions, industrial trucks and services
Attractive market with growth profile above GDP
A global leader: strong home base & well positioned in growth markets
Technology leadership with strong position in warehouse automation
Robust integrated business model with high contribution from services
KION Group
Profitability benchmark – well prepared for future value creation
Highly motivated and qualified employees
Strategy „KION 2027“: maintains aspiration for profitable growth
27 KION GROUP AG | Corporate Presentation | July 2019 © 2019 KION GROUP AG. All rights reserved.Disclaimer This document has been prepared by KION GROUP AG (the “Company”) solely for informational purposes. This disclaimer shall apply in all respects to the entire presentation (including all slides of this document), the oral presentation of the slides by representatives of the Company (or any person on behalf of the Company), any question-and-answer session that follows the oral presentation, hard copies of the slides as well as any additional materials distributed at, or in connection with this presentation (collectively, the “Presentation”). By attending the meeting (or conference call or video conference) at which the Presentation is made, or by reading the written materials included in the Presentation, you (i) acknowledge and agree to all of the following restrictions and undertakings, and (ii) acknowledge and confirm that you understand the legal and regulatory sanctions attached to the misuse, disclosure or improper circulation of the Presentation. The Presentation is private and confidential and may not be reproduced, redistributed or disclosed in any way in whole or in part to any other person without the prior written consent of the Company. None of the Company, its affiliates or any of their respective directors, officers, employees, agents or any other person shall have any liability whatsoever (in negligence or otherwise) for any loss howsoever arising from any use of the Presentation or its contents or otherwise arising in connection with the Presentation. The information and opinions contained in this Presentation do not purport to be comprehensive, are provided as at the date of the document and are subject to change without notice. The Company is not under any obligation to update or keep current the information contained in the Presentation. The Presentation does not constitute or form part of, and should not be construed as, an offer to sell or issue, or the solicitation of an offer to purchase, subscribe to or acquire, securities of the Company, its affiliates or an inducement to enter into investment activity in the United States or any other country. No part of this Presentation, nor the fact of its distribution, should form the basis of, or be relied on by any person in connection with, any contract or commitment or investment decision whatsoever. Certain industry, market and competitive position data contained in this Presentation, if any, come from official or third party sources. Third party industry publications, studies and surveys generally state that the data contained therein has been obtained from sources believed to be reliable, but that there is no guarantee of the accuracy or completeness of such data. While the Company believes that each of these publications, studies and surveys has been prepared by a reputable source, the Company has not independently verified the data contained therein, and the Company assumes no responsibility whatsoever in respect of the accuracy and completeness of any such data. In addition, certain industry, market and competitive position data contained in this Presentation come from the Company's own internal research and certain estimates are based on the knowledge and experience of the Company's management in the market in which the Company operates. While the Company believes that such research and estimates are reasonable and reliable, they, and their underlying methodology and assumptions, have not been verified by any independent source for accuracy or completeness and are subject to change without notice. The Company, therefore, also assumes no responsibility whatsoever in respect of the accuracy and completeness of any such research and estimates. Accordingly, no reliance should be placed on any of the industry, market or competitive position data contained in this Presentation. Statements in the Presentation, including those regarding the possible or assumed future or other performance of the Company and its affiliates or its industry or other trend projections, constitute forward- looking statements. These statements reflect the Company’s current knowledge and expectations and projections about future events and may be identified by the context of such statements or words such as “anticipate”, “believe”, “expect”, “intend”, “project” and “target”. By their nature, forward-looking statements involve known and unknown risks, uncertainties, assumptions and other factors because they relate to events and depend on circumstances that will occur in the future whether or not outside the control of the Company. Such factors may cause actual results, performance or developments to differ materially from those expressed or implied by such forward-looking statements. Accordingly, no assurance is given that such forward-looking statements will prove to have been correct. They speak only as at the date of the Presentation and the Company undertakes no obligation to update these forward-looking statements. IFRS financial information for any previous fiscal year figures is adjusted in the Presentation as necessary pursuant to changes to IFRS or other mandatory reclassifications. The addition of the totals presented may result in rounding differences. In addition to figures prepared in accordance with IFRS, the Presentation also includes certain non-GAAP financial performance measures (e.g., EBITDA, EBITDA margin, adjusted EBITDA, adjusted EBITDA margin, adjusted EBIT, adjusted net profit, free cash flow, gross debt, and net debt, order intake, order book and ROCE). These non-GAAP measures have been included because we believe that investors may find them helpful to measure our performance as reported under the relevant IFRS measures. However, these non-GAAP measures should be considered only in addition to, but not in isolation or as a substitute for, the information prepared in accordance with IFRS. Non-GAAP financial performance measures are not subject to IFRS or any other generally accepted accounting principles, and other companies that report similarly named non-GAAP measures may define or calculate these financial performance measures in different ways. 28 KION GROUP AG | Corporate Presentation | July 2019 © 2019 KION GROUP AG. All rights reserved.
You can also read


