Fletcher Building Half Year Results to 31 December 2019
←
→
Page content transcription
If your browser does not render page correctly, please read the page content below
FOC US

Fletcher Building
Half Year Results to
31 December 2019
ROSS TAYLOR
— Chief Executive Officer

BEVAN MCKENZIE
— Chief Financial Officer

19 February 2020
Important Information

This presentation has been prepared by Fletcher Building Limited and its group of companies (“Fletcher Building”) for informa tional purposes. This disclaimer
applies to this document and the verbal or written comments of any person presenting it.

This presentation provides additional comment on the Interim Financial Results 2020 dated 19 February 2020. As such, it should be read in conjunction with
and subject to the explanations and views given in that document. Unless otherwise specified, all information is for the half year ended 31 December 2019.

In certain sections of this presentation, Fletcher Building has chosen to present certain financial information exclusive of the impact of significant items and/or
the results of the businesses divested in the year ended 30 June 2019. For the six months ended 31 December 2019, the Group’ s financial statements are
prepared in accordance with the new lease accounting standard NZ IFRS 16, adopted from 1 July 2019. In prior periods, lease costs were fully reported in EBIT.
Under NZ IFRS 16, the two components of lease costs are reported separately: (1) the depreciation of right-of-use assets is reported in EBIT and (2) the
deemed interest portion of the lease liability is reported in net interest expense. Financial tables in this presentation (w here indicated) show both the reported
result for the prior period, as well as a pro forma restatement of the prior period to illustrate the impact of NZ IFRS 16 ha d it been applied and to allow for a
like-for-like comparison. A number of non-GAAP financial measures are used in this presentation which are used by management to assess the performance of
the business and have been derived from Fletcher Building’s financial statements for the six months ended 31 December 2019. You should not consider any of
these statements in isolation from, or as a substitute for the information provided in the Interim Financial Statements for the six months ended 31 December
2019, which are available at www.fletcherbuilding.com.

The information in this presentation has been prepared by Fletcher Building with due care and attention, however, neither Fletcher Building nor any of its
directors, employees, shareholders nor any other person given any representations or warranties (either express or implied) a s to the accuracy or
completeness of the information and to the maximum extent permitted by law, no such person shall have any liability whatsoeve r to any person for any loss
(including, without limitation, arising from any fault or negligence) arising from this presentation or any information suppl ied in connection with it.

This presentation may contain forward looking statements, that is statements related to future, not past, events or other mat ters. Forward looking statements
may include statements regarding our intent, belief or current expectations in connection with our future operating or financ ial performance, or market
conditions. Such forward looking statements are based on current expectations, estimates and assumptions and are subject to a number of risks and
uncertainties, including material adverse events, significant one-off expenses and other unforeseeable circumstances. There is no assurance that results
contemplated in any of these projections and forward looking statements will be realised. Actual results may differ materially from those projected. Except as
required by law, or the rules of any relevant stock exchange or listing authority, no person is under any obligation to updat e this presentation at any time after
its release or to provide further information about Fletcher Building.

The information in this presentation does not constitute financial product, legal, financial, investment, tax or any other ad vice or a recommendation.

2       Fletcher Building Half Year Results Presentation | © February 2020

FOC US

 Agenda
 1. Results Overview                      Ross Taylor

 2. New Zealand Operations                Ross Taylor

 3. Australia Operations                  Ross Taylor

 4. Financial Results                 Bevan McKenzie

 5. Outlook                              Ross Taylor

Fletcher Building
Half Year Results Presentation 2020
Revenue in line with expectations, full year earnings guidance
reconfirmed
                             Revenue ($bn)                                                      Revenue
                     4.2                                                                        • NZ core revenue steady
                                                       4.0
                                                                                                • Construction revenues lower as legacy projects
                      1.5                              1.4                                        complete
                                                                                                • Australia lower from residential and infrastructure
                                                                                                  market decline
                      2.7                              2.6

                    HY19                          HY20
                        NZ                   Australia

                                 EBIT1 ($m)                                                     EBIT – First Half
                     248                                                                        • NZ core earnings solid, except Steel
                                                      219
                                                                                                • Timing of Residential and Development sales second
                                                                                                  half weighted
                                                                                                • AU cost-out benefits flow more fully in second half

                                                                                                EBIT – Full year guidance of $515m-$565m reconfirmed
                                                                                                • Earnings weighted to 2H20 on Steel improvement,
                    HY19                             HY20
                                                                                                  Residential sales timing, Australia turnaround

4   Fletcher Building Half Year Results Presentation | © February 2020
                                                                         Note: All metrics are for continuing operations unless stated otherwise. RTG and Formica were sold during the prior year
                                                                         1 Measures before significant items are non-GAAP measures used by management to assess the performance of the business and

                                                                         has been derived from Fletcher Building’s financial statements for the six months ended 31 December 2019. Details of signific ant
                                                                         items can be found in note 2A of the financial statements
Reported net earnings in line with expectations

                 Reported Net Earnings ($m)                                                     Net Earnings
                      89                                                                        • Incorporates changes to operations and accounting
                                                       82                                         changes
                                                                                                • HY20 includes $35m sig items associated with the
                                                                                                  Australian cost out programme

                    HY19 1                           HY20

              Return on Funds Employed2 (%)                                                     ROFE
                   12.3%                            12.4%                                       • Group ROFE steady
                                                                                                • NZ delivering above target
                                                                                                • AU remains below target but turnaround plans in
                                                                                                  place to drive through uplift

                    HY19                             HY20

5
                                                                         1 $142m for continuing operations
    Fletcher Building Half Year Results Presentation | © February 2020   2 Rolling12 month EBIT to average funds (net debt and equity less deferred tax assets). Measures before significant items are
                                                                         non-GAAP measures used by management to assess the performance of the business and has been derived from Fletcher Building’s
                                                                         financial statements for the six months ended 31 December 2019. Details of significant items can be found in note 2 of the fi nancial statements
Strong cash performance through working capital improvement

                     Trading Cash Flow1 ($m)                                                    Trading Cash Flow Improvement
                                                       88                                       • Driven by working capital improvements, especially
                                                                                                  inventory

                      36

                    HY19                             HY20

                             Net Debt ($m)                                                      Net Debt
                                                                                                • Net debt increased as expected - from share buyback
                                                      766
                                                                                                  and legacy construction projects
                                                                                                • Strong balance sheet: leverage ratio 0.8x, undrawn
                                                                                                  credit of $925m, cash on hand of $570m
                     325

                    FY19                             HY20

6   Fletcher Building Half Year Results Presentation | © February 2020
                                                                         Note: All metrics are for continuing operations unless stated otherwise. RTG and Formica were sold during the prior year
                                                                         1 Trading cash flow from continuing operations excluding legacy construction projects
Interim dividend of 11 cents per share declared

                                  EPS (cps)                              EPS
                    10.4                                                 • Slightly down half on half in line with earnings
                                                      9.8

                    HY19                             HY20

                      Interim Dividend (cps)                             Interim Dividend
                                                      11.0
                                                                         • Interim dividend payment to be made on 9 April
                                                                            2020
                      8.0                                                • Return to normal split between interim and final
                                                                            dividends

                    HY19                             HY20

7   Fletcher Building Half Year Results Presentation | © February 2020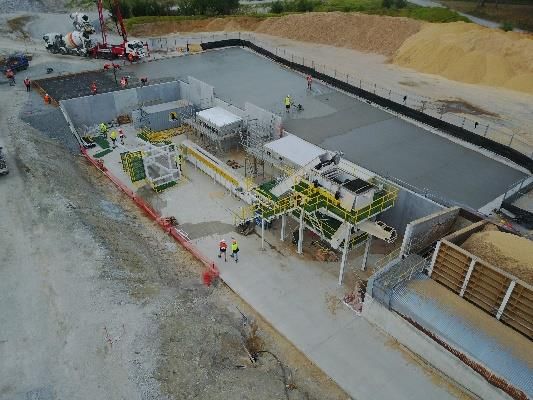
Strong focus on ‘Protect’ reset, Science Based Targets verified

                                    Safety                                                        Safety
               Total Recordable Injury Frequency Rate 1                                           • Major safety program ‘Protect’ reset launched across
                                                                                                    all businesses
        6.7             6.9                                                                       • Our aim is to be injury free as a business
                                       5.1            5.0           5.15                          • Focus is on culture, mindsets, skills and the
                                                                                                    identification and effective management of critical
                                                                                                    risks
                                                                                                  • Success will see TRIFR fall to well under 5.0 in the
       FY16           FY17           FY18           FY19           HY20                             coming years

                              Sustainability                                                      Sustainability
                       Carbon Emission Intensity2                                                 • Committed to reduce carbon emissions by 30% by
                                               149
                                                                                                    2030
         143                141                                                                   • Aligns with aims to limit global warming to below 2o C
                                                                  139
                                                                                                  • First building materials and construction company in
                                                                                                    NZ or Australia to have accredited Science-Based
                                                                                                    Targets for carbon reduction

        FY16               FY17               FY18               FY19

8
                                                                         1 TRIFR   = Total no. of recorded injuries per million man hours worked.
    Fletcher Building Half Year Results Presentation | © February 2020   2 Carbon    Emission Intensity = FBU Co2 Tonnes for every $1m of revenue. ISO 14064-1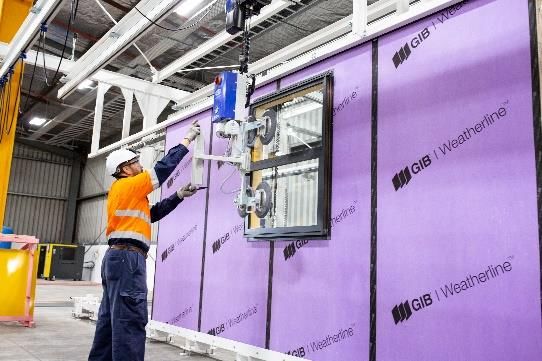
FOC US

 Agenda
 1. Results Overview                      Ross Taylor

 2. New Zealand Operations                Ross Taylor

 3. Australia Operations                  Ross Taylor

 4. Financial Results                 Bevan McKenzie

 5. Outlook                              Ross Taylor

Fletcher Building
Half Year Results Presentation 2020
New Zealand market steady year on year, outlook remains positive

                    FBU Revenue by Market (%)                                                     Residential
                                                                                                  • Activity levels steady year on year:
                                                                                                    ‒ Consents growth weighted to multi-unit dwellings
                                                                 NZ
                                                                                                      (smaller floor area, typology mix change)
                                                                 Residential
                                                                                                    ‒ Standalone housing flat on total floor area basis
                                                        29%                                         ‒ New subdivision trending slightly lower

                                                                                                  Commercial
                                                                                                  • Activity levels trending slightly lower

                                                       16%
                                                                                                  Infrastructure
                                22%
                                                                NZ                                • Softer activity in 1H20 on project timing and wet first
          NZ
          Infrastructure
                                                                Commercial                           quarter
                                                                                                  • Strong long term outlook supported by $12b
                                                                                                     government infrastructure package

10   Fletcher Building Half Year Results Presentation | © February 2020
                                                                          Source: Statistics NZ, Infometrics
Building Products
Results overview
Dec 2018 Dec 2018 Dec 2019
6 months 6 months 6 months
NZ$m reported pro forma1
Gross Revenue 672 672 645 • Strong volumes and operating performance
EBITDA 96 114 92
in plasterboard, insulation and laminates
EBIT 87 91 66 • Pipes volumes and performance impacted
by lower subdivision and civil work plus wet
Trading Cash Flow 36 36 54
first quarter
ROFE2 % 23% 25% 18%
• Steel a disappointment with trading
Capex 18 18 17
conditions remaining challenging through
Cash Conversion 3 21% 20% 56% the first half, materially impacting volumes
and margins
Building Products (ex Steel) EBIT 66 69 65 • Half on half profit reduction mainly due to
Steel EBIT 21 22 1
Steel performance
• Operating margins higher in Building
Domestic board volumes (m2 ) +4%
Product businesses (ex Steel) on price gains
and operating leverage
Domestic laminate sales (m2 ) +3%
• Divisional cash flow higher on improved
Pipe volumes (t) -17%
working capital management
Steel volumes (t) -16%
Divisional Exposure Resi, 45% Com, 26% Infra, 29%
11
1 Dec 2018 6 months pro forma is Dec 2018 6 months reported adjusted for IFRS 16
Fletcher Building Half Year Results Presentation | © February 2020 2 EBIT/Closing Funds
3 Cash conversion = FCF/EBITBuilding Products
Performance focus
Operating Margin ex Steel (EBITDA %) Key Focus Areas
21.3% 21.8% • Tasman Insulation building wraps
• GIB Weatherline and Barrierline
• Iplex mobile extrusion, PVC-O plant investments
• Winstone Wallboards MyGIB® app
• Laminex decor and ecommerce launch
• c$400m Winstone Wallboards plant in Tauranga,
50% land and buildings, 50% equipment
HY19 1 HY20 • Humes fix / focus ongoing
Steel EBIT ($m) Steel Volumes (t) Steel Outlook
22 117,835 t
• Intervention, business reset complete
99,096 t • Solid recent project wins
• Expectation for better market volumes, margins
improving into 2H20
1
1
HY19 HY20 HY19 HY20
12
1 HY19 is Dec 2018 6 months reported adjusted for IFRS 16 to allow like-for-like comparison
Fletcher Building Half Year Results Presentation | © February 2020Distribution
Results overview
Dec 2018 Dec 2018 Dec 2019
6 months 6 months 6 months
NZ$m reported pro forma1
Gross Revenue 809 809 824 • Revenue increase in line with market activity
EBITDA 55 79 73 • Conditions in key Auckland market highly
EBIT 50 55 50 competitive
Trading Cash Flow 49 49 64 • Earnings lower due to: Auckland environment,
higher wage, property and freight costs, and
ROFE2 % 35% 47% 41%
investments in digital capability
Capex 11 11 12
• Continue to drive branch and showroom
Cash Conversion 3 76% 69% 104% upgrade programme and increase network
density with new branch openings
PlaceMakers revenue +2%
• Cash flow higher on improved inventory
management
Mico revenue -1%
Divisional Exposure Resi, 79% Com, 21%
13
1 Dec 2018 6 months pro forma is Dec 2018 6 months reported adjusted for IFRS 16
Fletcher Building Half Year Results Presentation | © February 2020 2 EBIT/Closing Funds
3 Cash conversion = FCF/EBITDistribution
To date focused on branch service digitisation and transport
Seamless Service Through Digitisation Transforming Transport Capability
(m) Transactions # (m) • Efficiency improved through own vehicle
4 delivery:
̶ Delivery per load increased
3 2H ̶ Load time reduced
̶ More accurate and consistent
2 charging
1 1H
• Service levels enhanced through Uber-style
“track your truck”
0
FY17 FY18 FY19 FY20
70% of branch transactions now digitised
• c4m transactions digitally per annum:
̶ paper eliminated
̶ accuracy of receipting and picking
improved
̶ staff resourcing better matched
14 Fletcher Building Half Year Results Presentation | © February 2020Distribution
Our focus is now firmly on our digital transformation
Digital Transformation from physical analogue to 24x7 omnichannel experience
Data
Seamless
Our promise: Service
infrastructure
and analytics
“Unmatched digital Our digital
experience - best service every ambition
day, on every transaction”
Digital Smart job
supply manage-
chain ment
FY20 FY21 FY22
• Trade app and Initial portal • Trade portal (full rollout) • Portal expanded to full consumer
focus
• Shop.PlaceMakers launched • Shop.Placemakers expanded to full
ecommerce offering • Endless Aisle
• Analytics, artificial intelligence, • Supply chain automation and
machine learning Estimation transformation
15 Fletcher Building Half Year Results Presentation | © February 2020Concrete
Results overview
Dec 2018 Dec 2018 Dec 2019
6 months 6 months 6 months
NZ$m reported pro forma1
Gross Revenue 404 404 403 • Volumes down slightly on softening civil /
EBITDA 67 82 87 infrastructure activity in the half
EBIT 42 44 49 • Price gains in aggregates and ready-mix, slight
compression in cement price
Trading Cash Flow 49 49 49
• Margins higher on price gains and supply
ROFE2 % 13% 14% 16%
chain efficiencies, partially offset by energy
Capex 17 17 33 costs
Cash Conversion 3 76% 73% 33% • Trading cash flow steady
• Capex higher on timing of capacity
Aggregates sales volumes -5% investments in mobile equipment, ready-mix
plants, and aggregate processing
Domestic cement volumes 0%
Ready-mix volumes -3%
Divisional Exposure Resi, 44% Com, 29% Infra, 27%
16
1 Dec 2018 6 months pro forma is Dec 2018 6 months reported adjusted for IFRS 16
Fletcher Building Half Year Results Presentation | © February 2020 2 EBIT/Closing Funds
3 Cash conversion = FCF/EBITConcrete
Performance focus
Operating Margin (EBITDA %) Operating Efficiency and Pricing
21.6% • New barge capacity between Portland and
20.2%
Auckland
• Mobile plant replacement in ready-mix
and aggregates
• Improved manufacturing performance in
new masonry facility
HY19 1 HY20 • Pricing focus
Product Innovation and Sustainability
• GBC cement currently 20% lower carbon
• Tyre Derived Fuel initiative go-live end
2020, diverting up to 50% of NZ waste tyres
from landfill
• Pozzolans product testing underway
Construction at Portland for the feed • Masonry: new honing plant and paving size
supply portion of the TDF process
Pile of chipped tyres range
17
1 HY19 is Dec 2018 6 months reported adjusted for IFRS 16 to allow like-for-like comparison
Fletcher Building Half Year Results Presentation | © February 2020Residential and Development
Results overview
Dec 2018 Dec 2018 Dec 2019
6 months 6 months 6 months
NZ$m reported pro forma1
Gross Revenue 251 251 224 • Market demand strong and prices supportive,
EBITDA 43 44 36
especially in key $600k-$900k pricing category
• Margins tracking above plan
EBIT 43 43 35
• 1H20 Residential EBIT lower due to timing of
Trading Cash Flow (7) (7) 35
settlements (weighted to 2H20)
ROFE2 % 13% 13% 11%
• Cash flow supported by receipts from FY19
Capex 2 2 2 Land Development transaction
Cash Conversion 3 (21)% (21)% 94% • c5 years’ supply of lots under control, of which
75% are on balance sheet
• FY20 Residential earnings expected to grow
Residential EBIT 37 37 27
year on year
Land Development EBIT 6 6 11
• FY20 Land Development profits likely to be
Clever Core EBIT - - (3) $35m+ (higher than $25m p.a. run-rate)
18
1 Dec 2018 6 months pro forma is Dec 2018 6 months reported adjusted for IFRS 16
Fletcher Building Half Year Results Presentation | © February 2020 2 EBIT/Closing Funds
3 Cash conversion = FCF/EBITResidential and Development
Performance focus
Weekly House Sales Panelisation
# Unconditional Agreements
23
15
10 11
Q1 Q2
HY19 HY20
• Strong sales since mid-October
• Continued momentum into Q3
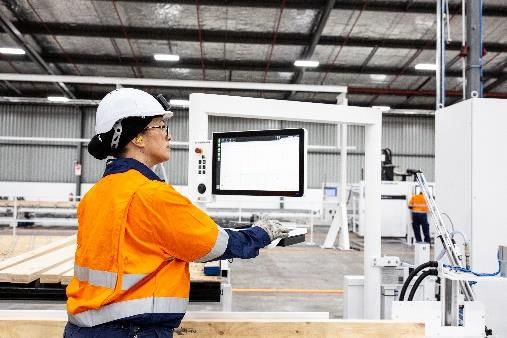
• Firm pricing • Clever Core manufacturing site officially
• Targeting 800-900 unit sales for FY20 (vs 755 opened in October, first houses completed in
in FY19) the half
19 Fletcher Building Half Year Results Presentation | © February 2020Construction
Results overview
Dec 2018 Dec 2018 Dec 2019
6 months 6 months 6 months
NZ$m reported pro forma1
Gross Revenue 866 866 774 • Revenue ex-legacy projects up 3% year on year
EBITDA 25 35 33
as new work starts to flow through
• EBIT weighted to 2H20 due to wet first quarter
EBIT 15 17 14
impacting bitumen and asphalt volumes in
Trading Cash Flow (97) (97) (152) Higgins
ROFE2 % (ex legacy) 10% 12% 8% • Cash flow driven by legacy projects outflow of
$142m as key projects near completion
Capex 15 15 19
• Profile of work shifting to more balanced
Cash Conversion 3 NM NM NM
portfolio with only $92m legacy revenue
backlog remaining (excl. NZICC)
Revenue backlog (ex legacy) 1,122 1,122 1,438 • No change to legacy provisions
Revenue backlog legacy 473 473 92
20
1 Dec 2018 6 months pro forma is Dec 2018 6 months reported adjusted for IFRS 16
Fletcher Building Half Year Results Presentation | © February 2020 2 EBIT/Closing Funds
3 Cash conversion = FCF/EBITConstruction
Performance focus
Talent and skills now broadly reset Winning the right work with the right customers
Work in hand ($m)
• Strong operational leadership team
in place 92
473 256
• Driving consistent project
management and governance
1,438
1,122 1,189
HY19 FY19 HY20
Lega cy Other Cons truction
Complete legacy projects within provisions
• All legacy projects (ex NZICC) will be • New work win rates improving with a strong
complete by June 2020 1H20 performance
• NZICC – Contract Works and Third Party • Securing new work in line with targeted
Liability insurances will respond to loss balanced portfolio and better risk profile
and damage
21 Fletcher Building Half Year Results Presentation | © February 2020FOC US Agenda 1. Results Overview Ross Taylor 2. New Zealand Operations Ross Taylor 3. Australia Operations Ross Taylor 4. Financial Results Bevan McKenzie 5. Outlook Ross Taylor Fletcher Building Half Year Results Presentation 2020
Australia sharp decline in residential sector but looks to be
turning; expect improvements in all sectors from FY21

            FBU Australia Revenue by Market                                                        Residential
                                                                                                   • Material contraction in line with expectations
                             AU Infrastructure
                                                                                                   • Expect c150-160k approvals in FY20, down 20%
                 AU Commercial
                                                                                                     year on year
                                                  6%
                                         9%                                                        • Signs of market stabilising, recovery from FY21
           AU
           Residential

                                18%                                                                Commercial
                                                                                                   • Steady activity levels. Approvals looking positive

                                                                                                   Infrastructure
                                                                                                   • Activity remains weak in key sectors, especially
                                                                                                     water and roading
                                                                                                   • Government commitment of $100b spend over
                                                                                                     next 10 years

23   Fletcher Building Half Year Results Presentation | © February 2020
                                                                          Source: BIS Oxford Economics (financial years)
Australia
Results overview
Dec 2018 Dec 2018
6 months 6 months Dec 2019
NZ$m reported pro forma1 6 months
Gross Revenue 1,557 1,557 1,453 • Revenue held well relative to market decline
EBITDA2 65 110 103 • Cost-out programme mostly complete,
EBIT2 33 43 35
benefits are second half weighted
• Strong momentum in Laminex and Insulation
Trading Cash Flow2 (71) (71) (44)
• EBIT impacted by lower volumes and margin
ROFE3 % 4% 5% 4%
pressure in pipes, steel and distribution
Capex 33 33 32 • Cash flow higher on improved inventory
Cash Conversion 4 NM NM NM management but were impacted by
restructuring costs
• FY20 earnings weighted to second half as we
Building Products Aus. EBIT2 24 29 27
get full run rate benefits from cost out work
Distribution Aus. EBIT2 2 5 4
Steel Aus. EBIT2 8 10 5
Divisional costs (1) (1) (1)
Divisional Exposure Resi, 54% Com, 28% Infra, 18%
24
1 Dec 2018 6 months pro forma is Dec 2018 6 months reported adjusted for IFRS 16. pro forma $43m under IFRS 16
Fletcher Building Half Year Results Presentation | © February 2020 2 Beforesignificant items
3 EBIT/Closing Funds
4
Cash conversion = FCF/EBITAustralia
Seeing improvement from well-advanced cost out programme
Operational Excellence Strategy and Portfolio
• Performance focus, reset well advanced •• Clever
With the
Corereset well advanced,
manufacturing we have
site officially
• Costs mostly out - $100m gross annual cost- assessed
opened in our portfolio
October, first houses completed
out benefit by FY21 • inDecision
the halfmade to divest Rocla
• Right-sized network with store and branch • Expect this to be completed through
closures complete; first wave of branch co- calendar 2020
locations complete
• Insulation consolidated into one site
• DCs consolidation complete
• Freight suppliers consolidated
Product and Service Innovation
• Ranges expanded in Laminex, Stramit
(Taurean garage doors), Fletcher Insulation
and Oliveri bathroom products
• Compact decorative surface trials
underway
• Laminex digital delivering
• Fletcher Insulation packaging refreshed,
La mi nex Gold Coast Labrador (shop i n shop) service install offering expanded
25 Fletcher Building Half Year Results Presentation | © February 2020FOC US Agenda 1. Results Overview Ross Taylor 2. New Zealand Operations Ross Taylor 3. Australia Operations Ross Taylor 4. Financial Results Bevan McKenzie 5. Outlook Ross Taylor Fletcher Building Half Year Results Presentation 2020
Income statement
First half group profit in line with expectations

Reported results                                                          Dec 2018   Dec 2019   Change
NZ$m                                                                      6 months   6 months      $m
Revenue                                                                      4,185      3,961     (224)
EBITDA                                                                        335        402         67
EBIT before significant items from continuing operations                      248        219        (29)
Significant items                                                               0        (35)       (35)
EBIT from continuing operations                                               248        184        (64)
Lease interest expense                                                          0        (35)       (35)
Funding costs                                                                 (62)       (35)        27
Tax expense                                                                   (39)       (28)        11
Non-controlling interests                                                      (5)        (4)         1
Net earnings from discontinued operations net of tax                          (53)         0         53
Net earnings                                                                   89         82         (7)
Basic earnings per share (EPS – cents)                                        10.4        9.8   (0.6)cps
Dividends declared per share (EPS – cents)                                     8.0       11.0    3.0cps

27   Fletcher Building Half Year Results Presentation | © February 2020
IFRS 16 adopted in FY20
Background and impact

•    Effective for the Group for period commencing 1 July 2019

•    Total of c 5,000 operating leases now accounted for under IFRS 16

•    Balance Sheet impact: Recognises right-of-use asset of $1.5bn and lease liability of $1.8bn

•    Income Statement impact: Operating lease expense treated as depreciation and interest charges

                                                       pro forma           pro forma
     IFRS 16 impact                                         HY19                FY19
     NZ$m                                              6 months           12 months

     EBITDA                                                     117             234

     EBIT                                                        24              49

     Net earnings                                                (8)            (15)

•    Cash Flow Statement impact: No impact on underlying cash flows but new lease arrangement
     results in reclassification of certain cash flows; Operating cash flows increase by the principal
     payment amount with an offsetting outflow in financing cash flows

28   Fletcher Building Half Year Results Presentation | © February 2020
Tax and funding costs
Effective tax rate steady, funding costs materially lower
Effective Tax Rate 1 (%) Funding Costs ($m)
25.9% 25.3% 62
35
HY19 HY20 HY19 HY20
Tax Funding costs
• Effective tax rate (excl. B+I): • Average interest rate on debt is 5.0% based on
– expected to be c26% in FY20 period end borrowings
– expected to track back to 29% in FY21 • FY20 funding costs expected to be c$70-80m
• Cash tax paid:
– $1m in HY20
– expected to be c$10m in FY20
29
1 Before significant items
Fletcher Building Half Year Results Presentation | © February 2020Cash flow
$52m improvement in trading cash flows
Dec 2018 Dec 2019 Change
NZ$m 6 months 6 months $m
EBIT before significant items from continuing operations 248 219 (29)
Depreciation and amortisation 87 183 96
Lease principal payments and lease interest paid - (119) (119)
Provisions, significant items and other (50) (31) 19
Trading cash flow before working capital movements 285 252 (33)
Working capital movements (249) (164) 85
Trading cash flow from continuing operations excluding B+I 36 88 52
Discontinued operations 33 - (33)
B+I cash flow (105) (142) (37)
Trading cash flow (36) (54) (18)
Add: Lease principal payments - 84 84
Less: cash tax paid (17) (1) 16
Less: interest paid (61) (34) 27
Cash flows from operating activities (114) (5) 109
Free Cash Flow1 from continuing operations excluding B+I (73) (32) 41
• No change to B+I provisions or total expected cash outflows. Phasing of remaining cash outflows to be confirmed based on
revised NZICC programme
30
1 Free Cash Flow = Trading cash flow less capex less cash tax, excluding M+A activities
Fletcher Building Half Year Results Presentation | © February 2020Working capital
Continued improvement in working capital management
Cash flow working capital movements continuing operations Dec 2018 Dec 2019 Change
NZ$m 6 months 6 months $m
Residential and Development (29) - 29
Construction excluding B+I (19) (33) (14)
Debtors 76 92 16
Inventories (90) (34) 56
Creditors (187) (189) (2)
Cash flow working capital movements (249) (164) 85
As at As at Change
Key working capital metrics (days) Dec 2018 Dec 2019 (days)
Debtor Days 43.3 44.0 0.7
Inventory Days 79.4 75.5 (3.9)
Payables Days 40.6 41.6 1.0
Materials and Distribution Total Cycle 82.1 77.9 (4.2)
• Working capital cycle improved by 4.2 days = $72.5m cash release
31 Fletcher Building Half Year Results Presentation | © February 2020Capex and depreciation
Focused investment in core business
Capex by Markets (NZ$m)
• FY20 capex expected to be in the range $275-$325m,
4 including land for new WWB plant
• Capex programme focused on enabling investments
for strategy, especially:
32
– Digital
– Manufacturing efficiency and operating capacity
$119m 62
– Product & service innovation
– Sustainability
19
• WWB plant update:
2
– Land secured in Tauranga
– Technology and construction contracts will be
NZ Core Residential and Construction finalised in 2H20
Development
– c$400m (50% land & buildings, 50% equipment)
Australia Corporate mainly in FY21 and FY22
• FY20 depreciation & amortisation is expected to be
$180m-$190m (prior to impact of IFRS 16)
32 Fletcher Building Half Year Results Presentation | © February 2020Net debt
Net debt higher as expected
Net Debt (NZ$m)
141 9
119
34
142
44 128 766
88
325
Opening Net Reclassification Trading cash FY19 final Legacy projects Funding costs Capex Repurchase of Other 1 Closing net
Debt - FY20 to lease from dividend shares debt
liabilities continuing payment
operations
33
1 Other is comprised of Minority distribution of $6m and Hedging/FX on debt of $2m and income tax paid of $1m
Fletcher Building Half Year Results Presentation | © February 2020Leverage
Leverage position remains strong
Leverage (Net Debt / EBITDA)
• IFRS 16 impact on EBITDA c$240m
• Target leverage range adjusted from 1.5x-2.5x to
1.0x-2.0x to reflect this impact
2.0x
• Target range is unchanged on an underlying basis
Target • Leverage ratio tracking to lower bound of target
range range by end of FY20 as anticipated
1.0x
0.8x
0.3x
HY19 1 HY20
34
1 HY19 is adjusted for IFRS16
Fletcher Building Half Year Results Presentation | © February 2020Funding
Strong maturity profile and liquidity
Debt Maturity Profile at Dec-19 (NZ$m) Facilities Drawings
NZ$m 31 Dec 19 31 Dec 19
Syndicate 925 -
14
USPP 878 878
Capital Notes 435 435
400
Other 23 23
525 Total 2,261 1,336
460
5
162
• Undrawn credit lines of $925m and cash of $570m
147
as at 31 December 2019
150
100 100
69
• All sensible debt reduction opportunities being
16 undertaken: $321m1 repaid in 1H20, total of
FY20 FY21 FY22 FY23 FY24-25 FY26+ $736m since Jul-18
2
Capital Notes USPP Bank Syndicate Other
• Syndicated banking facility renegotiated in 1H20,
establishing new 3 and 5-year tenor
35
1 Includes CCIRS component and excludes fair value hedge component
Fletcher Building Half Year Results Presentation | © February 2020 2 USPP NZ$8m, bank loans NZ$260m, purchase of institutional capital notes NZ$50m, NZ$3m otherDividend and share buyback
Interim dividend of 11cps, buyback tracking to plan
Dividend Share Buyback
• Interim dividend of 11.0 cents per share • On-market share buyback programme of up to
NZ$300m
• Payment date of 9 April 2020
• This form of shareholder distribution takes into
• Interim dividend unimputed for NZ taxation account tax effectiveness for all shareholders and
purposes and unfranked for Australian taxation earnings per share accretion
purposes
• Commenced on 9 September 2019
• Dividend Reinvestment Plan will not be operative
for this dividend • 27.9m shares purchased on NZX and ASX
exchanges to date for NZ$141m (3.3% issued
• Return to normal split between interim and final capital)
dividend
36
1 Available cash flow = Free cash flow less cash interest
Fletcher Building Half Year Results Presentation | © February 2020FOC US Agenda 1. Results Overview Ross Taylor 2. New Zealand Operations Ross Taylor 3. Australia Operations Ross Taylor 4. Financial Results Bevan McKenzie 5. Outlook Ross Taylor Fletcher Building Half Year Results Presentation 2020
FY20 focus on driving consistent performance

                                             FY2020                                  FY2021–23
                                          PERFORMANCE                                 GROWTH

     1. Strengthen
     and grow the                       Performance focus                          Performance and growth
     NZ core

     2. Profitable
     growth in                      Continue strong performance          Growth across low and medium density housing
     Residential and
     Development

                                     Business fix complete
     3. Stabilise                                                            Predictable performance and growth
     Construction                  Legacy projects complete

     4. Turnaround                        Reset complete
     and grow                                                                        Performance and growth
     Australia                        Portfolio rationalised

     5. Lift
     performance                   Major investment in safety and
                                                                           Good focus and cadence across all enablers
     across all key                         innovation
     enablers

38    Fletcher Building Full Year Results Presentation | © August 2019
FY20 market outlook
Expect market activity in H2 to be broadly in line with H1
New Zealand Market FY20 Outlook Australia Market FY20 Outlook
• NZ residential expected to be similar • AU residential approvals stabilising
to first half. With ongoing trends to and returning to growth in FY21
smaller and attached dwelling units • Non-residential broadly flat
• Civil expected to trend slightly lower • Infrastructure project activity to
• Infrastructure slightly softer until the remain lumpy
renewed infrastructure activity comes
onstream from FY21 and beyond
Market outlook assumes no material economic impact due to coronavirus
39 Fletcher Building Half Year Results Presentation | © February 2020Second half outlook FY20 EBIT guidance of $515m - $565m reconfirmed Earnings weighted to second half, but more marked than usual owing to: • Improved performance from Steel • Stronger pipeline of Residential house sales due for settlement • Construction pavement season weighted to 2H20, benefiting Higgins • Benefits of AU cost-out programme nearing full run-rate 40 Fletcher Building Half Year Results Presentation | © February 2020
FOC US

Appendix

Fletcher Building
Half Year Results Presentation 2020
Industry context New Zealand and Australia

                                 NZ Historical                                                                                                     AU Historical
                           Residential Consents (#)                                                                                         Residential Approvals (#)
                                                                               37k                                         239k
                                                            35k                                                                                             232k
                                           33k                                                                                              222k
        29k              30k
                                                                                                                                                                        188k
                                                                                                                                                                                      173k

        FY16             FY17             FY18              FY19               HY20
                                                                                                                           FY16             FY17            FY18        FY19          HY20
                                                       Reti rement
 Key:         Hous es           Apa rtments                                  Townhouses                             Key:          Hous es              Apa rtments               Townhouses
                                                       Uni ts

 Value of Commercial and Infrastructure work put in place                                                                  Value of Commercial and Infrastructure work done
                      (Nominal $m)                                                                                                              (A$b)

                                                           8,403              8,688
                                          8,342
        6,022           6,200                                                                                               95                              110          92           95
                                                                                                                                             88

                        7,318             7,636            8,687              9,118
        6,627                                                                                                               38              38              44           46           48

        FY16             FY17          FY18                FY19               FY20F                                        FY16             FY17            FY18        FY19          FY20F
                 Key:      Commerci al                 Infrastructure                                                              Key:       Commerci al            Infrastructure

42      Fletcher Building Half Year Results Presentation | © February 2020
                                                                               Source: Statistics NZ, Infometrics
You can also read