Lenzing Investor Presentation - Results 01-06/2021 August 4, 2021
←
→
Page content transcription
If your browser does not render page correctly, please read the page content below
Lenzing
                  Investor Presentation
                  Results 01-06/2021
                  August 4, 2021

www.lenzing.com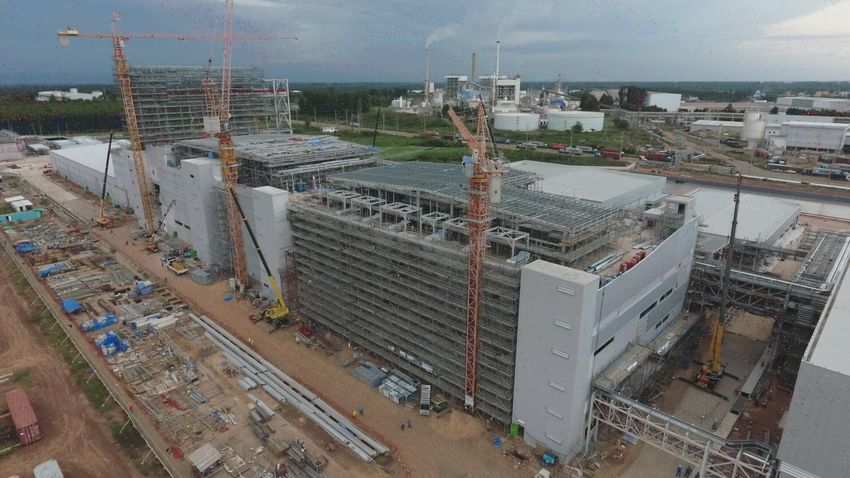
Disclaimer

          ● The information contained in this document has not been independently verified and no representation or warranty
            expressed or implied is made as to, and no reliance should be placed on, the fairness, accuracy, completeness or
            correctness of this information or opinions contained herein.

          ● Certain statements contained in this document may be statements of future expectations and other forward looking
            statements that are based on management‘s current view and assumptions and involve known and unknown risks
            and uncertainties that could cause actual results, performance or events to differ materially from those expressed
            or implied in such statements.
          ● None of Lenzing AG or any of its affiliates, advisors or representatives shall have any liability whatsoever (for
            negligence or otherwise) for any loss howsoever arising from any use of this document or its content or otherwise
            arising in connection with this document.

          ● Certain figures in this presentation have been rounded in accordance with commercial principles and practice.
            Such figures that have been rounded in various tables may not necessarily add up to the exact total given in the
            respective table.

          ● Definition and further details on the calculation of financial key indicators can be derived from the Half-Year Report
            and the Annual Report. These reports are also available online on the website of the Lenzing Group
            www.lenzing.com in the section “Investors”.

www.lenzing.com                                                    03/08/21 - 2
At a glance

           H1-2021 financial results                                                      Outlook and guidance 2021

           ● Revenue of EUR 1,033 mn (EUR 810 mn in H1-2020)                              ● Positive environment still characterized by high level
                                                                                            of uncertainty regarding COVID-19 pandemic
              ● Specialty share1 reached 73 % (72 % in H1-2020)
                                                                                          ● Taking into account the above factors and due to the
           ● EBITDA of EUR 218 mn (EUR 96 mn in H1-2020)                                    very positive development of the first half of the year,
              ● EBITDA more than doubled due to positive price                              the Lenzing Group expects the EBITDA in 2021 to
                development as well as cost-efficiency measures                             reach at least a level of EUR 360 mn
           ● Net result after minorities of EUR 81.2 mn (EUR 1.5 mn in
             H1-2020)
              ● EPS of EUR 3.06 (EUR 0.06 in H1-2020)                                     2024 targets confirmed
                                                                                          ● EBITDA of EUR 800 mn
           Key developments & strategic highlights
                                                                                          ● ROCE2> 10 %
           ● Largest expansion program in corporate history fully on track
             despite challenging COVID-19 situation                                       ● Financial leverage < 2.5x
                  ● 100 kt lyocell plant in Thailand to start in Q4-2021                  ● Specialty share > 75 % of fiber revenue
                  ● 500 kt DWP3 plant in Brazil on schedule to start in H1-2022           ● Backward integration > 75 % in DWP3
           ● Lenzing further progressed in its sustainability commitments                 ● CO2 emission reduction4 > 40 %

                    1) In % of fiber revenue
                    2) Adjusted for plants under construction
                    3) DWP = Dissolving wood pulp
www.lenzing.com     4) Per sold ton of DWP and fiber
                                                                           03/08/21 - 3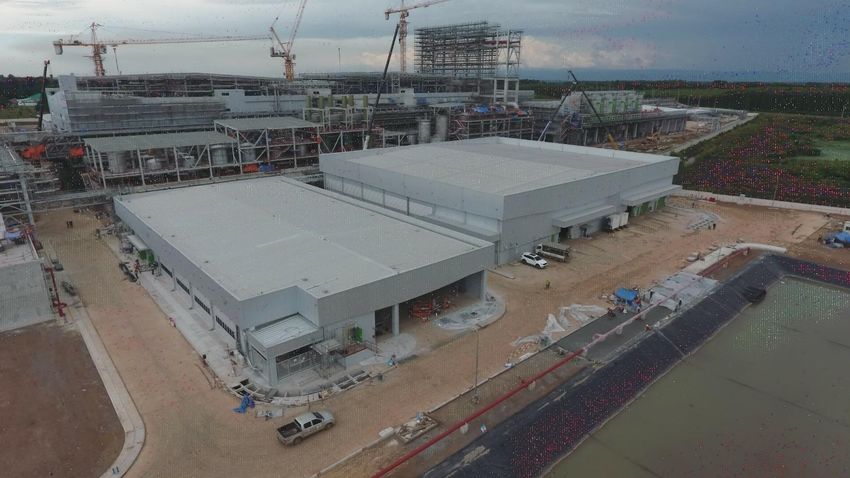
Highlights

www.lenzing.com
New organizational structure to further increase efficiency and
          transparency

                                                        Division Fiber                    Division Pulp
      CEO            CFO           Board Member Fibers          Board Member Fibers      Board Member Pulp
      Stefan         Thomas        Robert                       Stephan                  Christian
      Doboczky       Obendrauf     van de Kerkhof               Sielaff                  Skilich

                                   New organizational structure – divisions „Fiber“ and „Pulp“

                                   ● Support goals of sCore TEN strategy focusing on profitable, organic
                                     specialty fiber growth

                                   ● Strengthening of bottom line responsibilities

www.lenzing.com                          03/08/21 - 5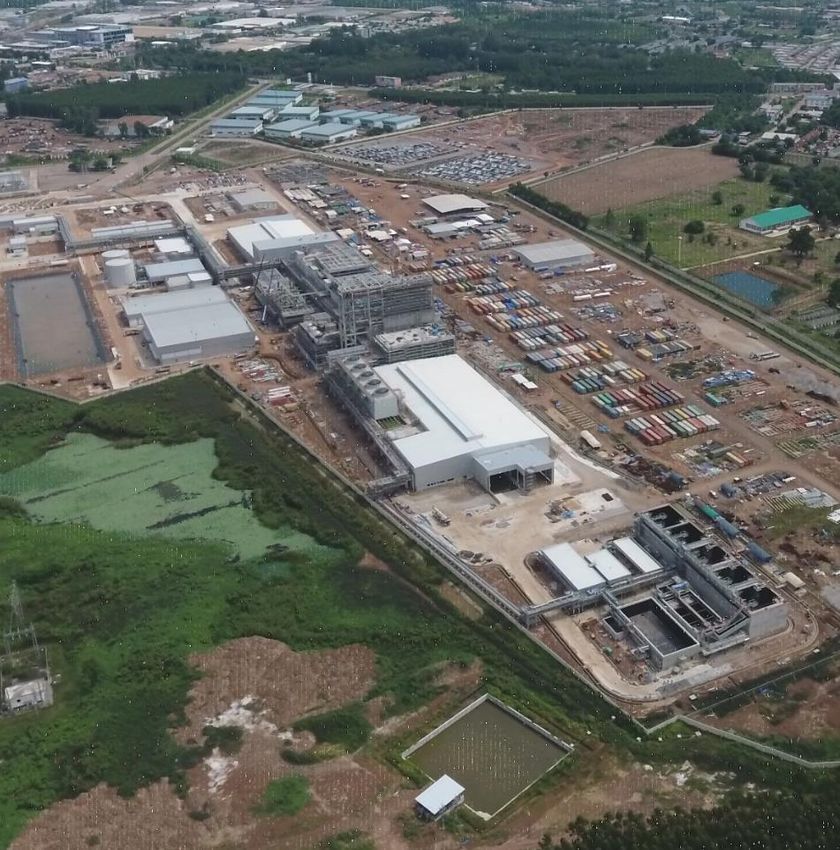
Sustainability pressure on synthetic fibers further increasing

                                                February 2021                                                    June 2021
           Fossil Fashion: hidden reliance of fast fashion                  Synthetics Anonymous: fashion brands’ addiction to
           on fossil fuels                                                  fossil fuels

           ● Fashion industry relies                                        ● Investigation of behaviour
             heavily on use of cheap                                          of fashion brands and
             synthetic fibers                                                 retailers
           ● Turning PET bottles into                                       ● Majority of brands dragging
             recycled polyester fiber                                         feet on reducing reliance on
             not sustainable or                                               fossil-fuel based fibers
             circular solution                                              ● Well-known brands landing
           ● Call for prompt and                                              in red-zone for heavy use
             radical legislative action                                       of synthetics

www.lenzing.com                                              03/08/21 - 6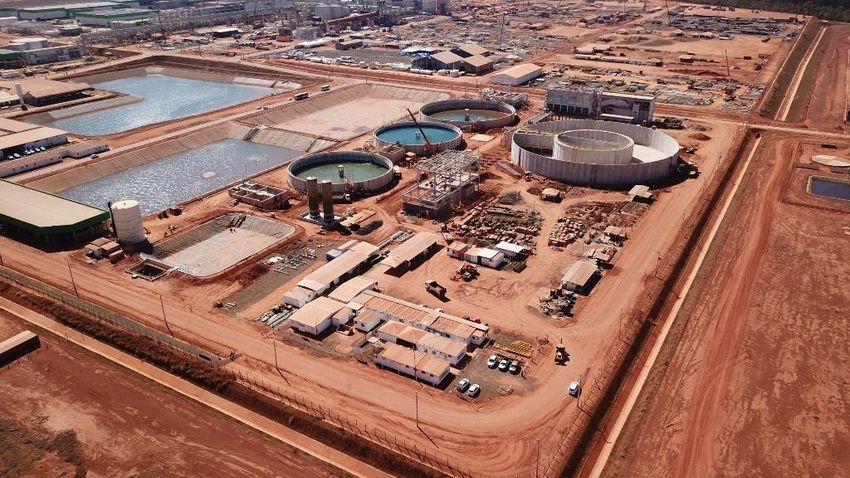
Lenzing continues to invest globally in its sustainability agenda

                                                                                       Grimsby (UK)
           Purwakarta (Indonesia) and Nanjing (China)
                                                                                       ● Building state-of-the-art wastewater treatment plant
           ● Improvements of emissions to air and water and increase
             use of biogenic fuels in Purwakarta by end of 2022                        ● Investment of GBP 20 mn
           ● Natural gas based cogeneration and conversion of                          ● Big step towards reducing the Group’s wastewater
             standard viscose line to 35,000 tons TENCEL™ branded                        emissions 20 percent by 2022
             modal fibers line in Nanjing by end of 2022

           ● Total investment of EUR >200 mn

           ● First wood-based fiber complex in China independent                       Lenzing (A)
             from coal as an energy source
                                                                                       ● New air purification and sulfur recovery plant running
           ● Reduction of sulphur emissions by > 50% and CO2 by
             > 320,000 tons per year
                                                                                       ● Investment of EUR 40 mn
           ● Full compliance of all viscose and modal production with
             EU Ecolabel standard                                                      ● Further enhancement of self-sufficiency in raw materials

www.lenzing.com                                                         03/08/21 - 7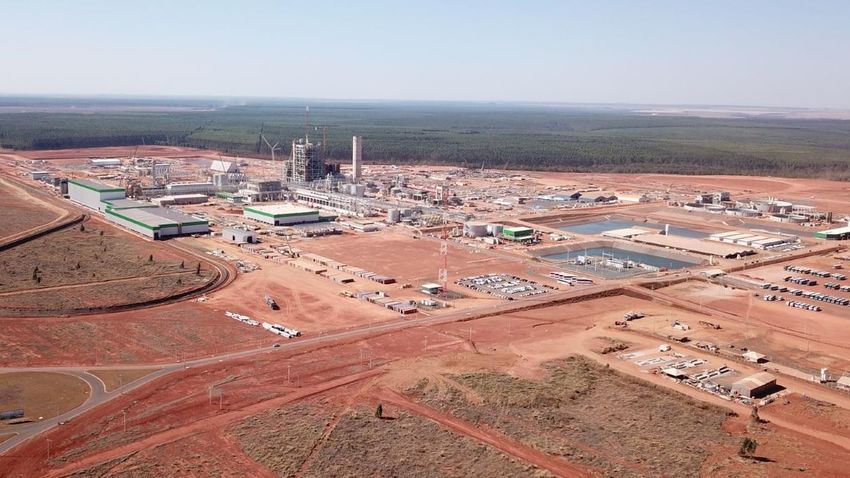
Lenzing raises bar for sustainability in textile and
          nonwovens industries by building long-term partnerships

            TENCEL™ Limited Edition initiative     Lenzing and Södra are joining          Blockchain-enabled traceability
                                                   forces in textile recycling            platform powered by
            ● Collaboration with Orange Fiber as                                          TextileGenesis™
              part of new TENCEL™ Limited          ● Cooperation to address the
              Edition initiative                     enormous textile waste               ● Blockchain project with
                                                     challenges of the industry and the     TextileGenesis™
            ● First ever TENCEL™ branded             society
              lyocell fiber made of orange and                                            ● Tracing fibers from origin to final
              wood pulp                            ● Transfer of knowhow between the        garment sold at fashion brand
                                                     two companies
            ● Shared vision to enhance                                                    ● Currently roll out across all regions
              sustainability in the textile and    ● Joint process development              (1,000+ value chain partners)
              fashion industry                       followed by a capacity expansion
                                                     for pulp from post-consumer          ● Scaling programs with renowned
                                                     waste                                  fashion companies such as H&M
                                                                                            and Bestseller ongoing
                                                   ● Goal to recycle ~25,000 tons of
                                                     textile waste per year by 2025

www.lenzing.com                                              03/08/21 - 8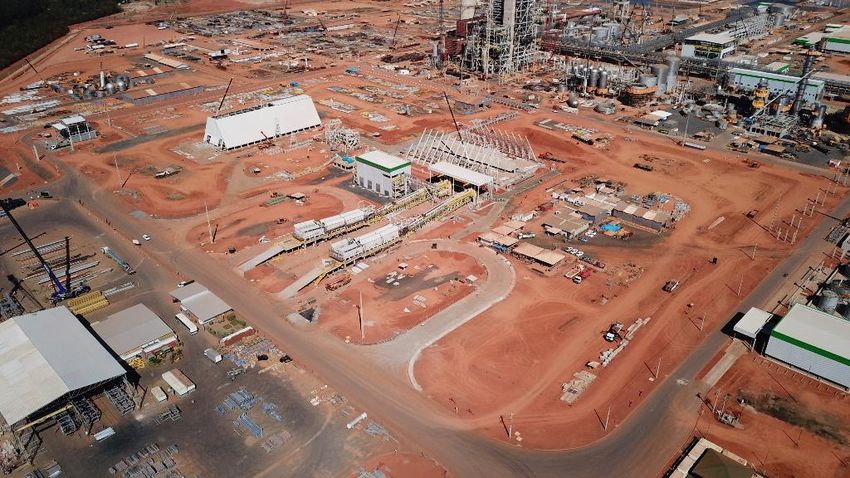
Lenzing further drives sustainability awareness in textiles and
          TENCEL™ preference with key brand initiatives

             TENCEL™ at the Oscars   Earth Month campaign     TENCEL™ E-shop
             ● 341mn reach           ● 28mn reach             ● 20mn PR reach

                                     ● 60 co-brand partners   ● 8 brand partners incl. Levi’s,
                                                                H&M, Esprit, West Elm

www.lenzing.com                                03/08/21 - 9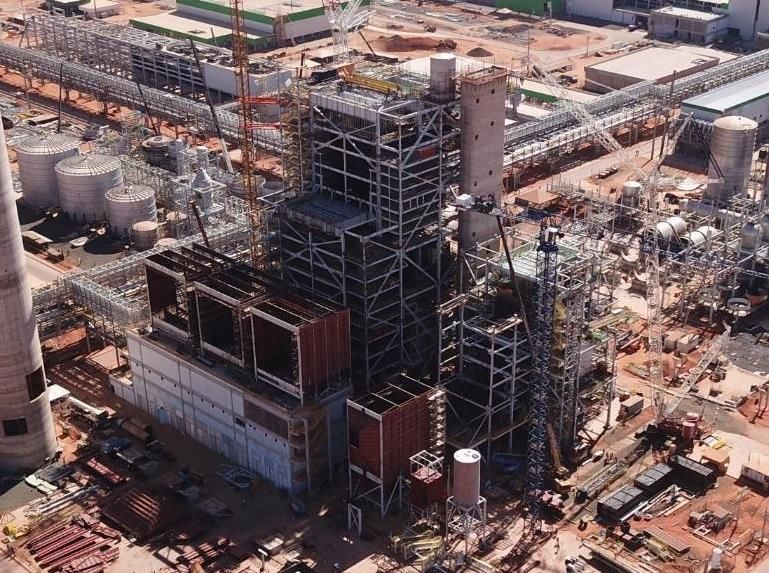
Lenzing welcomes EU in fighting against plastic waste by positioning
          VEOCEL™ as sustainable alternative and label of trust

           Single-Use Plastics Directive                                             Lenzing‘s VEOCEL™ fibers as sustainable alternative

           ● Guidelines of the EU Commission to implement the Single-                ● Lenzing’s wood-based, biodegradable VEOCEL™ branded
             Use Plastics Directive have been published                                fibers as a sustainable alternative to plastic

           ● Uniform labelling obligation for wipes and feminine hygiene
             products containing plastics as of July 03, 2021

www.lenzing.com                                                      03/08/21 - 10
Lenzing with attractive alternative to fossil-based materials in
personal hygiene and raising attention to biodegradability
VEOCEL™ Dry technology Collaboration with One Tree Planted VEOCEL™ biodegradability &
● Eco-responsible alternative to fossil- Science@Home
● 1.3+MM impressions
based materials in personal hygiene ● incl. German ZDF TV
products broadcasting with 1.4MM views
● Providing hydrophobic characteristics
whilst being biodegradable and
compostable
● Soft to touch and provide a dry feeling
in personal care products
www.lenzing.com 03/08/21 - 11Leading sustainability position reflected by Platinum status
with EcoVadis – reserved for the world’s top 1% companies
• World’s largest and most trusted provider of corporate sustainability ratings
• Global network of more than 75,000 rated companies in 160 countries worldwide
• Lenzing awarded platinum status for sustainability by EcoVadis and ranks among the world’s top one percent of the companies
evaluated
• Assessment covers: environment, fair working conditions and human rights, as well as ethics and sustainable procurement
• Highlighted essential criteria for Lenzing’s rating:
• Scientific validation of climate targets (Science Based Targets Initiative)
• The responsible procurement of raw materials as a core element in the company’s sustainability strategy
• Support for external environmental initiatives and initiatives on labour and human rights issues (Sustainable Apparel
Coalition, Fashion Industry Charter for Climate Action)
www.lenzing.com 03/08/21 - 12Market update www.lenzing.com
Global apparel retail sales at 2019 levels and at least partly
                 decoupled from rising Covid-19 cases
                 Monthly global apparel retail sales1
                 Percent of 2019
                  10
                                                                                                                                                                         Further development dependent on
                    0                                                                                                                                                    many variables and uncertainty
                                                                                                                                                                         remains high
                 -10                                                                                                                                                     ● Development of Covid-19 cases,
                                                                                                                                                                           new virus variants, and vaccine
                 -20                                                                                                                                                       rollout – surveys show vaccinated
                                                                                                                                                                           consumers spend more!
                 -30
                                                                                                                                                                         ● Unemployment and stimulus
                                                                                                                                                                           packages dampen or boost
                 -40                                                                                                                                                       consumer appetite to shop

                 -50                                                                                            FY 2020: -19 %                                           ● Pent-up demand once pandemic is
                                                                                                                                                                           "over"
                 -60                                                                                        2021 YTD May: -8 %

                 -70
                   Jan-20           Mar-20          May-20            Jul-20            Sep-20         Nov-20           Jan-21          Mar-21          May-21

   1 Estimated based on 42 countries accounting for 84 % of global 2019 apparel retail sales. For some countries (e.g., US, EU) excluding online retail sales. Number for May is a first estimate
     based on 27 countries accounting for 73 % of global sales
   www.lenzing.com                                                                                             03/08/21 - 14
SOURCE: Lenzing estimates based on national statistical offices (as of July 15, 2021)
Fiber prices reflect influences of seasonality and the
ongoing pandemic on important markets
Fiber prices in China Viscose Polyester Cotton
USD/kg, excl. VAT
Cotton FE Dissolving hardwood pulp
• Good demand – especially for imported cotton in China, and expectation of
2.25 further procurement by China Cotton Reserve – and lower production than
in previous seasons provided strong support for cotton prices; Usc/lbs 96.7
(USD/kg 2.13) at half-year end (Cotton A Index)
2.00 Viscose
• VSF prices partially lost first quarter's gains due to seasonal effects and the
1.75 textile market still suffering from the pandemic; RMB/ton 12,710 (USD/kg
1.74) at half-year end
• Operating rates in the Chinese VSF industry down to ~69% (5y avg. 81%)
1.50
• Inventory levels at the end of the period under review with 25 days clearly
above long-term average (5y avg. 18 days)
1.25
Dissolving hardwood pulp
• Dissolving wood pulp prices peaked remained at solid levels ended at
1.00 USD/ton 1,055
Polyester
0.75 • After the peak at the end of March, prices reduced significantly before
oscillating in the range of RMB/ton 6,600 to 7,000 (USD/kg 0.91-0.97)
0.50
Jan-19 Jul-19 Jan-20 Jul-20 Jan-21 Jul-21
www.lenzing.com 03/08/21 - 15
SOURCE: CCFG; Cotlook; CCFEI; ICACNumerous Chinese VSF plants make losses again
RMB/ton RMB/ton USD/ton
(incl. VAT) VSF1 price trend and theoretical profit / loss in China (excl. VAT) VSF2 conversion margin
16,000 3,500 1,400
15,000
2,500 1,200
14,000
1,500
13,000 1,000
12,000 500
800
11,000
-500
10,000
600
-1,500
9,000
8,000 -2,500 400
Jan-19 Jun-19 Nov-19 Apr-20 Sep-20 Feb-21 Jul-21 Jan-19 Apr-19 Jul-19 Oct-19 Jan-20 Apr-20 Jul-20 Oct-20 Jan-21 Apr-21 Jul-21
Profit (RHS) VSF (TX) CCFG medium
1 Standard viscose staple fibers, price development until July 21th, 2021
2 Conversion margin = VSF – imported hardwood dissolving pulp (DWP). DWP is key input material; 1 ton of fiber (VSF, modal, lyocell) requires ~1 ton of DWP
www.lenzing.com 03/08/21 - 16
SOURCE: CCFGCellulosic fiber prices are recovering from trough in 2020
Cellulosic fiber prices in China1
6-months average, percent from 1/17, converted at constant FX rates
120
110
CC Index
100 Lenzing specialties1
90
VSF (TX) CCF high
80
70
60
Jan-17 Jul-17 Jan-18 Jul-18 Jan-19 Jul-19 Jan-20 Jul-20 Jan-21 Jul-21
1 Lenzing‘s specialties: LENZING™ Lyocell, LENZING™ Modal, LENZING™ Specialty Viscose
www.lenzing.com 03/08/21 - 17
SOURCE: CCFG; CCA; LenzingExpansion projects www.lenzing.com
DWP mill in Brazil remains on time and in budget
          ● JV LD Celulose (LDC): Lenzing holds 51%, Duratex 49%            JV fully consolidated by Lenzing

            Key facts:
            ● 500 kt single line DWP mill
                Largest of its kind
            ● USD 1.38 bn industrial capex
              (USD 704 mn Lenzing’s economic share)
            ● Cash costs of ~USD 300 per mt
               Absolute cost leader
            ● Long-term average DWP price: ~USD 900/mt
            ● Expected ramp-up in H1/2022
                Almost full run rate expected end of 2022

www.lenzing.com                                             03/08/21 - 19
Overview www.lenzing.com 03/08/21 - 20
Recovery and Biomass boilers

                               Recovery Boiler

                                                          Biomass Boiler

                  Power Room

www.lenzing.com                                  03/08/21 - 21
Effluent Treatment www.lenzing.com 03/08/21 - 22
Wood handling
Biomass silo
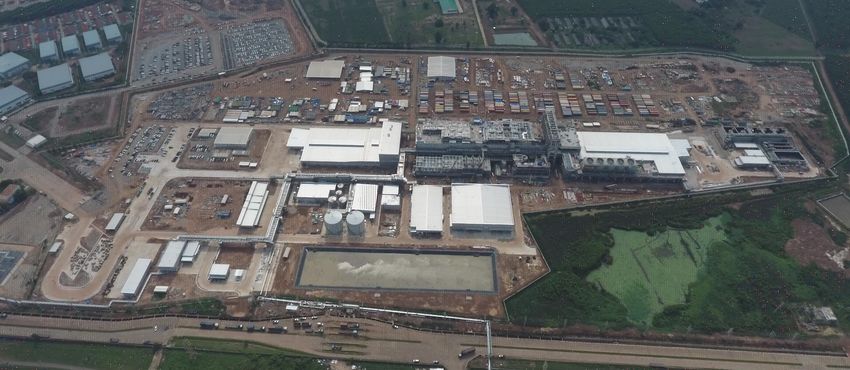
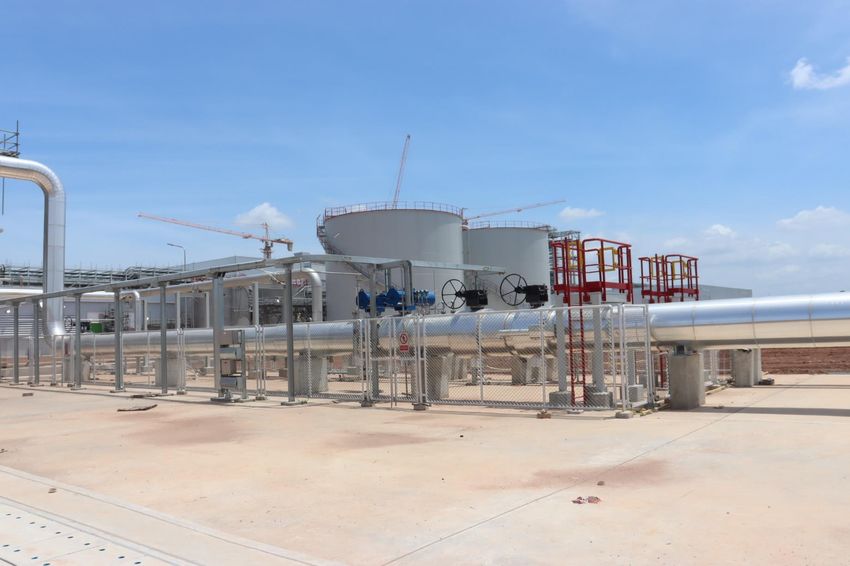
www.lenzing.com 03/08/21 - 23Lyocell expansion project in Thailand (T3) fully on track
Key facts:
● 100 kt lyocell fiber plant
Largest of its kind
Strong boost to specialty exposure
● ~EUR 400 mn industrial capex
Project fully on track – incl. recruiting
and onboarding
● Ramp-up expected end of 2021
● Fully ramped by H2-2022
● Bioenergy secured, carbon-neutral site
● Attractive tax incentive scheme
www.lenzing.com 03/08/21 - 24Overview
Fiber warehouse Production building DWP warehouse Waste water treatment
Utilities plant Techn. warehouse / laboratory / workshop
www.lenzing.com 03/08/21 - 25Production building www.lenzing.com 03/08/21 - 26
Technical warehouse / laboratory / workshop

www.lenzing.com                     03/08/21 - 27
Utilities plant

www.lenzing.com             03/08/21 - 28
Q2-2021 Financials

www.lenzing.com
P&L – Revenue

        Group revenue (EUR mn)                                 Fiber revenue by application                  Specialties share of fiber sales

                                                    +28%

                                                       1,033                                                               27%              27%
                                                                                      33%   32%        31%
                                                                           39%
                                                                53%
                                              810

                  +58%

                                  544                                                                                      73%              73%
                          489                                                         67%   68%        69%
                  438                                                      61%
  344      385
                                                                47%

                                                                                                                         Q1/2021           Q2/2021
Q2/2020 Q3/2020 Q4/2020 Q1/2021 Q2/2021      H1/2020 H1/2021   Q2/2020 Q3/2020 Q4/2020 Q1/2021 Q2/2021
                                                                                                                            Specialties1    Standard
                             Group revenue                              Nonwoven fibers     Textile fibers      1) LENZING™ Lyocell, LENZING™ Modal,
                                                                                                                   LENZING™ Specialty Viscose

www.lenzing.com                                                       03/08/21 - 30
P&L - EBITDA
EBITDA margin EBITDA margin
7.7 % 11.1 % 12.3 % 19.3 % 22.7 % 11.8% 21.1%
EUR mn EUR mn
+366% +128%
123.2 217.8
94.5
53.9 95.6
42.9
26.5
Q2/2020 Q3/2020 Q4/2020 Q1/2021 Q2/2021 H1/2020 H1/2021
EBITDA EBITDA
www.lenzing.com 03/08/21 - 31P&L - EBIT
EBIT margin EBIT margin
2.0% 13.4%
(3.9) % 1.0 % 3.1 % 11.3 % 15.4 %
EUR mn EUR mn
+745%
83.5 138.9
55.4
13.7
3.7
16.4
(13.4) H1/2020 H1/2021
Q2/2020 Q3/2020 Q4/2020 Q1/2021 Q2/2021
EBIT EBIT
www.lenzing.com 03/08/21 - 32P&L - Divisions
EBITDA per Division H1 2021
18.8 % 23.5 % 21.1 %
EUR mn
-32 218
79
171
Fiber Pulp Other1 Group
● Management and control of Lenzing’s activities has been updated and
organized into new divisions: Pulp, Fiber, and Other
www.lenzing.com 03/08/21 - 33
1) Incl. consolidationP&L – Net profit and earnings per share
EPS1 (EUR) EPS1 (EUR)
(0.78) (0.16) 0.34 1.06 2.00 0.06 3.06
EUR mn EUR mn
53.1 81.2
28.1
9.0
(4.3)
1.5
(20.7) H1/2020 H1/2021
Q2/2020 Q3/2020 Q4/2020 Q1/2021 Q2/2021
Group net profit after minorities and hybrid bond
Group net profit after minorities and hybrid bond
www.lenzing.com 03/08/21 - 34
1) Attributable to Lenzing AG shareholdersCash flow and trading working capital development
EUR mn 111.5 115.1 EUR mn
84.3 88.3
62.9
43.5 +9%
25.1 19.5 435.6 438.7
413.2
3.7 383.8 380.5
31.7
28.5
(49.6)
21.9
19.4 19.0
(99.0)
(125.3)
(153.9)
Q2/2020 Q3/2020 Q4/2020 Q1/2021 Q2/2021
(179.0) (175.1)
Q2/2020 Q3/2020 Q4/2020 Q1/2021 Q2/2021
Trading working capital
Gross cash flow Operating cash flow Free cash flow adj. Trading working capital in % of annualized Group revenue
Capex 130 181 219 211 215
www.lenzing.com 03/08/21 - 35Balance sheet metrics
Change
EUR mn According to IFRS (EUR mn) 30 Jun 20215 31 Dec 20205 in %
Total assets 4,700.8 4,163.0 12.9
823
787 Liquid assets3 1,076.2 1,081.1 (0.5)
701 701 706 Total liabilities 2,641.9 2,281.6 15.8
thereof financial liabilities 1,782.0 1,552.5 14.8
572
Adjusted equity4 2,083.7 1,907.0 9.3
471 482
Adjusted equity ratio (%) 44.3 45.8
411
380 Net gearing (%) 33.9 24.7
Net financial debt 705.8 471.4 49.7
Q2/2020 Q3/2020 Q4/2020 Q1/2021 Q2/2021
Change
According to IFRS (EUR mn) 30 Jun 2021 31 Dec 2020 in %
Reported net financial debt 1
Total liquidity cushion 1,813.8 2,112.5 (14.1)
Economic net financial debt 2
thereof liquid assets3 1,076.2 1,081.1 (0.5)
thereof unused credit facilities 737.5 1,031.4 (28.5)
1) Fully consolidated Brazil JV debt included
2) Reflects 51% economic share of Brazil JV debt
3) Including cash and cash equivalents, liquid securities and liquid bills of exchange
4) Including government grants less proportional share of deferred taxes on government grants
5) Including hybrid capital
www.lenzing.com 03/08/21 - 36Outlook www.lenzing.com
Outlook

          2021 guidance: Lenzing Group expects the EBITDA in 2021 to reach at least a level of EUR 360 mn
          ● Currently positive market environment still characterized by high level of uncertainty regarding the
            COVID-19 pandemic
          ● Commodity fiber pricing peaked mid March, stable after phase of decline
          ● DWP prices remain on very high levels
          ● Lenzing expects a continued increase in demand for sustainably produced fibers for the textile and
            apparel industry as well as for the hygiene and medical industry
          ● Strong focus on expansion projects in Thailand and Brazil
          ● Ongoing focal points: continuous improvement and operational excellence

www.lenzing.com                                          03/08/21 - 38
2021 strategic milestones
Major decisions to be taken Project Finalization
Further steps to
Conversion of VSF decarbonize portfolio Start-up of lyocell
Modal expansion commodity into ● Lenzing fiber plant in
ECOVERO™
● Nanjing Thailand (T3)
expansion
● Prachinburi
www.lenzing.com 03/08/21 - 39sCore TEN targets 2024
sCore TEN value drivers 2024 targets
Financial targets
EBITDA (EUR mn) 800
Specialization ROCE1 > 10 %
Leverage < 2.5x
Vertical integration
Strategic targets
Specialty share2 > 75 %
Sustainability DWP integration > 75 %
CO2 emission reduction3 > 40 %
1) Adjusted for plants under construction
2) In % of fiber revenue
3) Per sold ton of DWP and fiber
www.lenzing.com 03/08/21 - 40for your
attention!
www.lenzing.comAppendix
H1-2021 detailed financials
www.lenzing.comH1-2021: Quarterly P&L development1
Change Change Change
(EUR mn) Q2/2021 Q1/2021 Q2/Q1 (%) Q2/2020 Q2/Q2 (%) H1/2021 H1/2020 H1/H1 (%)
Revenue 544.0 489.3 11.2 343.9 58.2 1,033.3 810.2 27.5
Cost of sales (389.7) (368.8) 5.7 (309.6) 25.9 (758.5) (685.1) 10.7
Gross profit 154.3 120.6 28.0 34.3 349.4 274.8 125.1 119.8
Other operating income 24.5 15.5 57.7 15.3 60.3 40.0 31.2 28.2
Selling expenses (55.2) (49.0) 12.7 (37.1) 48.9 (104.1) (78.3) 33.0
Administrative expenses (34.1) (26.3) 29.8 (21.9) 55.4 (60.4) (49.5) 21.9
Research and development expenses (5.9) (5.4) 8.8 (3.9) 50.1 (11.3) (8.8) 28.6
Other operating expenses 0.0 0.0 (88.3) (0.1) (92.3) 0.0 (3.2) (98.7)
EBIT/Margin 83.5/15.4% 55.4/11.3% 50.8 (13.4)/(3.9%) - 138.9/13.4% 16.4/2.0% 744.6
Financial result (4.8) (10.3) (53.2) (5.7) (14.8) (15.2) (6.9) 119.8
EBT/Margin 78.7/14.5% 45.1/9.2% 74.7 (19.1)/(5.6%) - 123.8/12.0% 9.5/1.2% 1,196.4
Income tax expense (12.4) (15.2) (18.1) (13.0) (4.6) (27.6) (24.0) 15.3
Tax rate (%) 15.8 33.7 - 22.3 -
Net profit/loss/Margin 66.3/12.2% 29.9/6.1% 121.9 (32.1)/(9.3%) - 96.1/9.3% (14.4)/(1.8%) -
Net profit/loss attributable to shareholders of Lenzing
AG/Margin 53.1/9.8% 28.1/5.7% 89.2 (20.7)/(6.0%) - 81.2/7.9% 1.5/0.2% 5,209.9
Net profit/loss attributable to non-controlling interests 5.9 (5.4) - (11.5) - 0.5 (15.9) -
Net profit/loss attributable to hybrid owners 7.2 7.2 0.0 0.0 - 14.4 0.0 -
EPS (in EUR) 2.00 1.06 89.2 (0.78) - 3.06 0.06 5,209.9
1) Reclassification of capitalized borrowing costs, net interest from defined benefit plans and commitment fees from EBIT/EBITDA to the financial result
(see footnote 1 of the consolidated income statement of the Group Interim Report H1/2021).
www.lenzing.com 03/08/21 - 43H1-2021: Quarterly topline breakdown
(EUR mn) H1/2021
Wood-based cellulosic fibers 880.8
Co-products of fiber production 25.1
Mechanical and plant engineering, engineering services and others 5.6
Division Fiber 911.5
Pulp 65.8
Biorefinery-products and energy 36.3
Wood and other 17.1
Division Pulp 119.2
Others 2.6
Total Group revenue 1,033.3
www.lenzing.com 03/08/21 - 44H1-2021: Quarterly cash flow development
Change
Change Q2/Q2 Change
(EUR mn) Q2/2021 Q1/2021 Q2/Q1 (%) Q2/2020 (%) H1/2021 H1/2020 H1/H1 (%)
Gross cash flow (before taxes and interest) 139.9 95.0 47.2 29.8 370.0 234.9 82.3 185.3
Taxes and interest (24.7) (10.7) 131.7 (4.7) 431.0 (35.4) (18.5) 91.8
Gross cash flow (after taxes and
interest) 115.1 84.3 36.5 25.1 358.6 199.5 63.9 212.3
Change in total working capital1 (26.8) 27.1 - (74.7) (64.1) 0.3 (81.6) -
Operating cash flow 88.3 111.5 (20.7) (49.6) - 199.8 (17.7) -
Investment cash flow2 (220.0) (205.5) 7.0 (130.0) 69.2 (425.5) (267.9) 58.8
Free cash flow unadj. (131.6) (94.1) 39.9 (179.6) (26.7) (225.7) (285.6) (21.0)
Net inflow from sale of subsidiary 0.0 0.0 - 0.0 - 0.0 0.0 -
Acquisition of other financial assets 6.5 0.0 - 0.9 596.2 6.6 1.1 478.8
Proceeds/repayments of other financial
assets (0.2) (5.0) (96.4) (0.3) (38.8) (5.1) (1.2) 322.7
Free cash flow adj. (125.3) (99.0) 26.5 (179.0) (30.0) (224.3) (285.7) (21.5)
1) Including trade and other working capital
2) Including investment in and proceeds from disposal of financial assets
www.lenzing.com 03/08/21 - 45Q2-2021: Net debt bridge
Net Cash Net
Financial Capex2 Change Financial
Debt Q1 Net (incl. Fin. in Trading Change in Currency IFRS 16 Capital Debt Q2
2021 Tax Interest Gross CF1 Ass.) WC other WC Dividend Translation Leasing Increase Others 2021
Change in total
working capital
EUR (25.1) mn3
572.4 17.8 6.9 139.9
221.1
33.1 8.0 0.0 3.1 9.6 2.8 1.4 705.8
1) Gross cash flow before taxes and interest
2) Including CAPEX of EUR (214.5) mn and financial assets of EUR (6.5) mn
3) Change in total working capital EUR (26.8) mn (according to cash flow statement)
Adjustment change in liquid bills of exchange EUR 1.7 mn
Change in total working capital adj. EUR (25.1) mn (according to net debt)
www.lenzing.com 03/08/21 - 46H1-2021: Net debt bridge
Net Cash Net
Financial Capex2 Change Financial
Debt FY Net (incl. Fin. in Trading Change in Currency IFRS 16 Capital Debt Q2
2020 Tax Interest Gross CF1 Ass.) WC other WC Dividend Translation Leasing Increase Others 2021
Change in total
working capital
EUR 1.3 mn3
471.4
26.4 9.0 234.9
432.6 0.2 8.4 4.1 2.8 7.4 705.8
37.5 38.8
1) Gross cash flow before taxes and interest
2) Including CAPEX of EUR (426.0) mn and financial assets of EUR (6.6) mn
3) Change in total working capital EUR 0.3 mn (according to cash flow statement)
Adjustment change in liquid bills of exchange EUR 0.9 mn
Change in total working capital adj. EUR 1.3 mn (according to net debt)
www.lenzing.com 03/08/21 - 47Contact and financial calendar
Investor contact Financial calendar
Sébastien Knus Annual results 2020 March 11, 2021
VP Capital Markets a.i. 77th Annual General Meeting April 14, 2021
Results 01-03/2021 May 5, 2021
Phone: +43 7672 701 3599
E-mail: s.knus@lenzing.com Half-year results 2021 August 4, 2021
Results 01-09/2021 November 3, 2021
Visit our IR website
https://www.lenzing.com/investors/
Connect with us
Visit our SRI sites https://www.facebook.com/LenzingGroup
https://www.lenzing.com/en/sustainability https://at.linkedin.com/company/lenzing-ag
https://www.lenzing.com/en/sustainability-reports https://twitter.com/LenzingAG
www.lenzing.com 03/08/21 - 48You can also read