Brookfield Asset Management - INVESTOR DAY SEPTEMBER 17
←
→
Page content transcription
If your browser does not render page correctly, please read the page content below

Brookfield Asset Management

I N V E S T O R D AY
SEPTEMBER 27, 2017
Agenda

                                        Page
Strategic Review                           3
Bruce Flatt, Chief Executive Officer

Financial Review                          54
Brian Lawson, Chief Financial Officer

Q&A                                       90

                                               2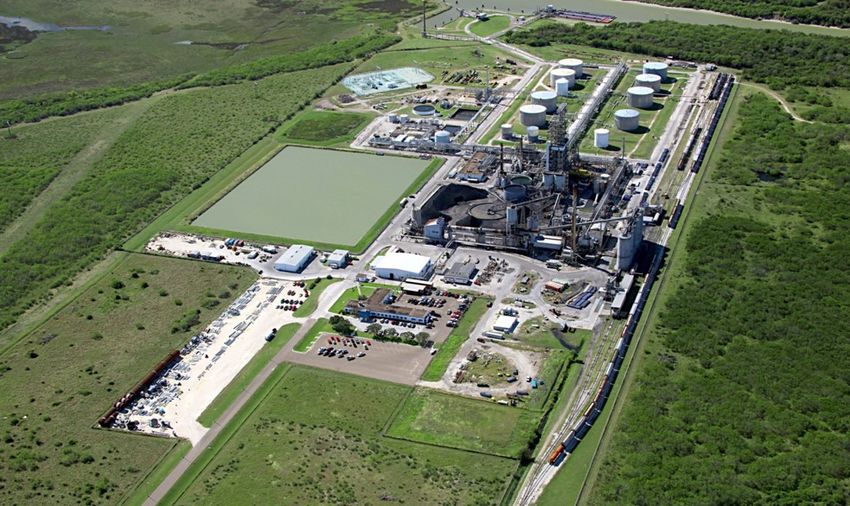
We want to leave you with four important points

                           1
         Real asset allocations are increasing

                           2
                 How we invest is key

                           3
         Our operations focus differentiates us

                           4
          Our people and culture are critical

                                                  3
We are a
leading global manager
     of real assets

                         4
Our business continues to grow

        $250B+ 30                      70,000+            465                 ~$120B
        ASSETS UNDER                                      INSTITUTIONAL       FEE BEARING
        MANAGEMENT         COUNTRIES   EMPLOYEES          CLIENTS             CAPITAL

                                                                                          $258B

                                                                     10%1
                                                                     CAGR

                                                   $158B

                                                   2012      2013   2014    2015   2016     2017

                                                          Assets Under Management (AUM)

1)   As at June 30, 2017

                                                                                                   5
We have delivered strong returns to our clients –
                     and therefore, over the past five years ...

                                                   BAM’s stock has appreciated
                                                    at a 15% compound rate

                                              Received over $5 billion of distributions
                                                     from our listed issuers1

                                         Private funds have achieved targets and more,
                                             enabling us to grow client relationships

1) Distributions from BIP, BPY, BEP and BBU

                                                                                          6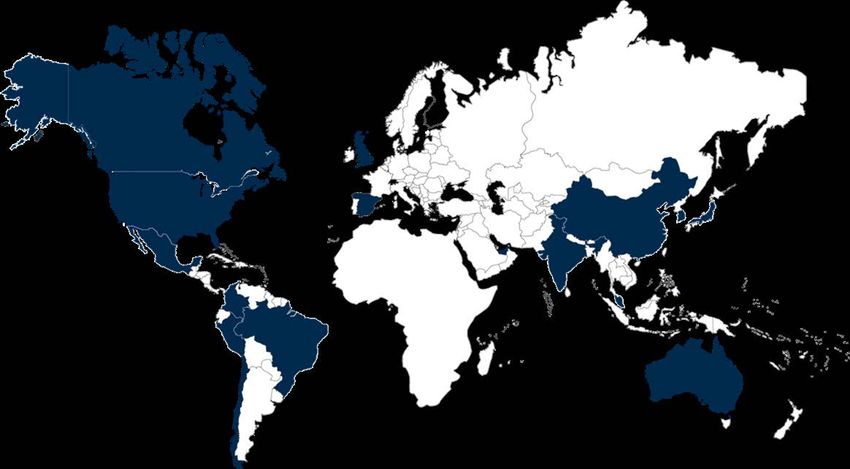
Last Year’s Polling Question

Last year we asked if you expect the
       S&P500 to be higher
      at our next investor day

                                       7
… and you responded

a) Higher by a lot – 12%

b) Higher by a little – 42%

c) Unchanged – 8%

d) Lower by a little – 38%

                              8
Actual result:

+15%

                 9
Polling Question #1

Q: Do you expect the S&P500 to be higher
        at our next investor day?

         a) Higher by a lot

         b) Higher by a little

         c) Unchanged

         d) Lower by a little

         e) Lower by a lot

                                           10
There are three keys to our growth
1 2 3
Investors continue to Competitive Our people
increase allocations advantages as an and culture
to real assets investor and
operator
11Real Asset Allocations Are Increasing
1 12The amount of capital controlled by
institutional investors continues to grow…
($trillions)
$50
$40
$43
$30
$20
$23
$10
$0
2008 2016
1) Source: Willis Towers Watson Global Pension Assets Study, 2008-2016
2) Source: Prequin Sovereign Wealth Fund reports
13…but their funded status has declined
($trillions)
$5 110%
100%
$4 90%
80%
70%
$3
60%
50%
$2
40%
30%
$1 20%
10%
$0 0%
2001 2002 2003 2004 2005 2006 2007 2008 2009 2010 2011 2012 2013 2014 2015 2016
Assets Liabilities Funded Ratio
Source: Brookfield Research. Public Plans Data, refers to 170 different state and local public plans in the U.S.
14Real assets and alternatives provide an attractive solution
Diversification from traditional investments
which have higher valuations
Values maintain themselves through
cycles with less volatility
Cash yielding investments provide cash flow
15The result is a continued
shift in pension fund allocations to alternatives
U.S. Pension Assets Allocated to Alternatives
($trillions)
$10
$8
$9
$6
$4 3x
$2 $3
$-
2008 2016
Source: Willis Towers Watson Global Pension Assets Study, 2008-2016
16These allocation trends should continue…
Interest rates should Real assets
slowly move up retain their value across cycles
Real assets
Equities are at highs
provide diversification
17…resulting in higher flows to real assets in the future
2030
2017
2000
5%
25% 40%+ 60%
75%
95%
Real Assets / Equity /
Alternatives Fixed Income
1) Source: Willis Towers Watson Global Pension Assets Study, 2008-2016
18Polling Question #2
Q: What % of institutional investors
are invested in two or more alternative asset classes?
a) Less than 30%
b) 30%
c) 40%
d) 50%
e) Greater than 50%
19A: According to a recent survey of over 540 global
institutional investors…
62%
of institutional investors are invested in two or more
alternative asset classes
Source: Preqin Investor Outlook: Alternative Assets, H2 2017
20We are responding
to this investor demand…
21In three key ways
1 2 3
Expanding our Launching new Expanding into
flagship funds strategies new distribution
channels
22Last year we highlighted major
fundraising initiatives
BSREP II BIF III BCP IV
$9B $14B $4B
INFRASTRUCTURE &
REAL ESTATE RENEWABLE POWER PRIVATE EQUITY
23We eat our own cooking
Fund Investment
BSREP II 26%
BIF III 29%
BCP IV 26%
24Over the past year we have made
excellent progress deploying this capital
BSREP II BIF III BCP IV
>80% >45% >60%
INVESTED1 INVESTED1 INVESTED1
1) Invested or committed
25….bringing us closer to
fundraising the next series
of flagship funds
26In addition, investors are seeking
new products and strategies within areas of our expertise
1 2
Perpetual Core Funds Credit Funds
Allows investors to Provides investors with
match long-duration reasonable cash yields
liabilities or provide
long-duration returns
271) We launched our first private perpetual core fund in 2016
Core Real Estate
Leveraging existing operating expertise
Existing Operating Platform Recurring, Stable Cash Flow
Opportunity for Expansion Growth Potential
282) We are expanding our credit platform
Leveraging our investment platforms and
existing lending expertise
Part of the Lending and Assets we
A focus on Investment
capital operating understand
quality prudence
solution expertise as owners
29We are also growing our private wealth investor base
Increasing interest among private wealth investors and
their advisers for private alternatives
Access to new distribution channels
Diversifying our funding sources
Dedicated team of fundraising professionals
30How We Invest is Key
2 31Over the past 12 months
we invested or committed $17 billion globally
Private Equity 14% Renewable Power
19%
21%
Real Estate 46% Infrastructure
Notes/Assumptions:
1) LTM as at June 30, 2017
32We are able to deploy
large amounts of capital quickly
without compromising our return thresholds
33…because we operate
large funds with broad mandates,
enabling us to allocate capital to the
best opportunities globally
34The asset classes in which we invest are extremely large –
each are $50 to $100 trillion businesses
35Our global presence differentiates us
30 700
COUNTRIES INVESTMENT PROFESSIONALS
36We are able to access multiple sources of capital
for transactions
Co-investors
Listed Joint
Partnerships Venture
Partners
Private Transactions BAM
Funds
37We are investors in some developing countries…
but take a measured approach
1 2 3
Patience Rule of Law Respect for Capital
38We have incrementally built
strong businesses in India over the last decade
2009 – 2013
Seed and Development
2013 – 2016
Growth and Establishment
2013 – 2016
Expansion
39Today, we are managing over $3.5 billion in India
Real Estate Infrastructure Renewable Power Private Equity
• $2.4 billion AUM • $1.1 billion AUM • 302 MW power assets • $1 billion JV with State
Bank of India
• 4 cities • 723 km operational • 200 MW solar (distressed deals)
roads
• 20 buildings • 102 MW wind • Residential financing
platform
• 20 million sq. ft.
40Our Operations Focus Differentiates Us
3 41Investing in Real Assets requires hard work
We have more than 115 years of operating experience
42We have increased the size of our team
2017
70,000
2008 Operating
Employees
17,000
Operating
Employees
43Our operating expertise is a
key differentiator for us
1 2 3
Leverage expertise Enhance returns Place senior
when underwriting through operating personnel from BAM
investments improvements, fixing into operating
balance sheet and/or companies
capex projects
44Colombia –
long-term power contract will add significant value
Calderas, Colombia Sogamoso Hydro, Colombia
45GrafTech –
cost cutting led to profits irrespective of price increases
Seadrift Needle Coke Plant, Texas
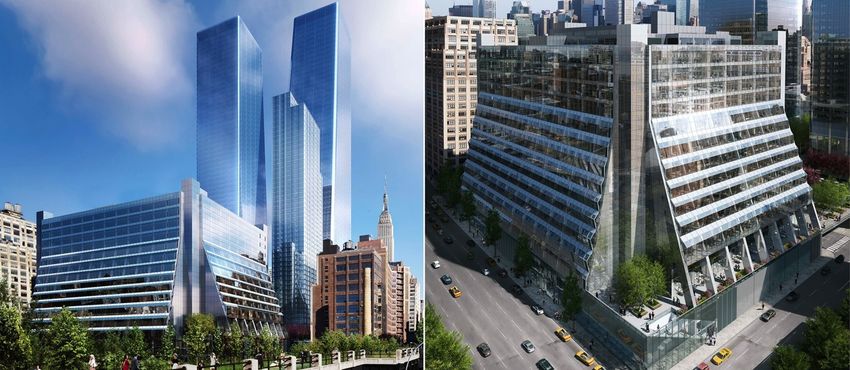
465 Manhattan West –
the renovation turned the worst building in Manhattan
into one of the city’s premier addresses
47Our People and Culture Are Critical
4 48Our people are a key driver of our success
and creating value
Corporate Offices
Regional Offices
49We foster a culture that enables
people to perform to their highest potential
Operating Philosophy Individual Excellence
Long-term Entrepreneurial
focus
Decentralized Brookfield Strong team
decision
making
Culture dynamics
Foster growth Disciplined
within ethic
50Passive investing has provided decent returns
over the past 20 years…
500%
450%
400%
350%
7%
300% Total
Return1
250%
200%
150%
100%
50%
0%
1997 1999 2001 2003 2005 2007 2009 2011 2013 2015 2017
S&P 500 returns
1) Compound, dividends reinvested
51…but our people have made the difference
2,500%
17%
Total
2,000% Return1
1,500%
1,000%
500% 7%
Total
Return1
0%
1997 1999 2001 2003 2005 2007 2009 2011 2013 2015 2017
S&P 500 returns BAM (NYSE) returns
1) Compound, dividends reinvested
52We want to leave you with four important points
1
Real asset allocations are increasing
2
How we invest is key
3
Our operations focus differentiates us
4
Our people and culture are critical
53Financial Review
54Agenda
1
Scorecard
2
Focus: Carried Interest
3
Financial Profile
55Our business is…
Straightforward Transparent Resilient Growing
56Value creation at Brookfield
Asset Invested
Manager Capital
Franchise
57Listed issuer performance
drives cash distributions and unit appreciation
Asset Invested
Drivers Manager Capital
FFO growth
Increase distributions IDRs Free cash flow
Unit price appreciates Base fees Investment value
58Private funds performance
drives base fees and carried interests
Asset Invested
Drivers Manager Capital
Raise capital / Base Deploy
Invest capital fees capital
Ongoing
Create value
distributions
Monetize Carried Investment
and distribute interests gains / proceeds
59Resiliency
Reliable fees Strong liquidity
• Over 85% of revenues are long term • $7 billion of core liquidity and
or perpetual $18 billion of dry powder
• Access to multiple sources of capital
Strong cash flow generation Investment grade ratings
• $1.2 billion free cash flow, net of • Investment-grade model across
common dividends most of our businesses
• Strong reliable growth profile
Notes/Assumptions:
1) As at and for the LTM ended June 30, 2017
60Polling Question #3
Q: Which reporting metric is, or would be,
helpful for you to analyze BAM?
WORD
CLOUD
61Scorecard
1 62We achieved solid growth in our
key earnings streams…
($millions) 2017 2016
Fee related earnings $ 732 $ 639
Distributions received2 1,385 1,251
Realized carried interest 152 15
19%
$ 2,269 $ 1,905
Notes/Assumptions:
1) For the LTM ended June 30
2) Annualized distributed cash flow from investments based on current distribution policies
63…which led to a 29% increase in free cash flow
($millions) 2017 2016
Fee related earnings $ 732 $ 639
Distributions received2 1,385 1,251
Realized carried interest 152 15
2,269 1,905
Outflows (445) (489)
Free cash flow $ 1,824 $ 1,416 29%
Notes/Assumptions:
1) For the LTM ended June 30
2) Annualized distributed cash flow from investments based on current distribution policies
64…and we increased our annualized earnings profile by 20%
($millions) 2017 20161
Base management fees
Listed partnerships $ 515 $ 412
Private funds 455 445
Public securities 80 80
IDRs 149 106
Performance, transaction & other fees 91 29
Annualized fee revenues $ 1,290 $ 1,072
Estimated fee related earnings2 $ 774 $ 643 20%
Notes/Assumptions:
1) 2016 annualized fees adjusted to exclude fees earned on BPY managed capital for comparative purposes
2) As at June 30; assumes 60% margin on fee related earnings
65In addition, we achieved an 18% total return
on our invested capital
Distributions Received
2017 2016
$1,385M $1,251M 11%
Total Return
Capital Distribution Total
Appreciation Yield Return
13% 5% 18%
66Focus: Carried Interest
2 67We expect to generate
substantial carried interest going forward
68How we measure carried interest…
1 2 3
Target Unrealized Realized
Carried Interest Carried Interest Carried Interest
The carried interest Carried interest generated Carried Interest earned,
we expect to earn on and based on fund excluding amounts subject
third-party capital, assuming performance to date, to clawback; basis for
the fund achieves the target assuming funds are financial statement and
return, annualized on a liquidated at current values FFO recognition
straight-line basis
69Carried interest profile for a typical fund
Year 1 Year 2 Year 3 Year 4 Year 5 Year 6 Year 7 Year 8 Year 9 Year 10
Target carry Realized carry Generated carry
70Our current carried interest profile
($billions) Existing Funds Only
10
8
6
4
2
0
2017 2018 2019 2020 2021 2022 2023 2024 2025 2026 2027
Realized carry Generated carry
71Our annual carried interest generated on existing
funds is expected to grow….
($billions)
2.5 Existing Funds Only
2.0
1.5
1.0
0.5
0.0
2017 2018 2019 2020 2021 2022 2023 2024 2025 2026 2027
Realized - Current Generated - Current
72… and will be supplemented by carry on future funds
($billions)
2.5
2.0
1.5
1.0
0.5
0.0
2017 2018 2019 2020 2021 2022 2023 2024 2025 2026 2027
Realized - Current Realized - Future Generated - Current Generated - Future
73Real asset strategies are well suited
to reliable carried interests
Cash yield
Lower volatility
Multiple exit strategies
– not overly dependent on IPO market
74Financial Profile
3 75Looking forward, we see
continued growth….
76As a result of growth in our business
we have updated certain assumptions
Larger flagship funds, pushed out timing slightly
2016 2017
2017/2019: $20B 2018/2020: $26B
2020/2021: $20B 2020/2022: $26B
Increased margin on carried interest as funds get larger
2016 2017
65% 70%
77…and we have updated our five-year financial model
$1,700 $1,689
Fee Related Earnings 18% CAGR
($millions)
$1,553
2016 Investor Day 2017 Investor Day 16% CAGR
$1,450
$1,200
$950
$700
2017 2018 2019 2020 2021 2022
Notes/Assumptions:
1) 2017 values interpolated from 2016 Investor Day financial plan projections – adjusted for reclassification of BPY managed capital to be on a comparable
basis with 2017 Investor Day financial plan
78We will continue to increase private fund capital
as we raise successor funds and launch new products
Private Funds – Fee Bearing Capital
($billions)
Credit, Core
& Other Outflows
Flagship Funds
$110B
2020 - 2022
Flagship Funds
2018 - 2020
$50B
80%
17%
CAGR
Our private capital is long term in nature; 80% of current
capital extends beyond 2022 79We expect our listed partnerships’ capitalization
to increase significantly over the next five years
Issuances $94B
Market
valuation
Distribution
growth
$55B
11%
CAGR
Notes/Assumptions:
1) As at June 30
2) Eliminate the market price to IFRS discount for BPY; listed partnership dividend growth at mid-point of target distribution growth rates; market appreciation – 10% growth for BBU
and the addition of TerraForm Power
3) Issuances; increase in units outstanding for 2017 equity issuances of BIP, BEP and BBU that occurred after June 30. Future issuances assumed to be all preferred units or debt
(no impact on units outstanding)
80…the increase in FBC should generate strong
growth in fee related earnings
($millions) 2017 2022
Base fees $ 1,016 $ 2,228
IDR’s 129 428
Other fees 55 159
Fee revenues 1,200 2,815
Direct costs (468) (1,126)
+18%
Fee related earnings $ 732 $ 1,689 CAGR
Notes/Assumptions:
1) For the LTM ended June 30
2) 2022 hypothetical fee revenue; fee related earnings assumes 60% margin
81And increase our potential to earn carried interest
Carry Eligible Capital
2017 2022
$40B $100B
Target Carry Generated Carry, Generated Carry,
Total Net
2017 2022 2022
$860M $1,505M $1,054M
Notes/Assumptions:
1) As at June 30
82We will also continue to
compound value on our balance sheet
83Our invested capital is transparent
and generates substantial cash flows
IFRS Base Case
($millions) Values1 Values2 Distributions3
Listed partnerships (BPY, BEP, BIP, BBU) $ 22,593 $ 27,956 $ 1,140
Other listed 3,465 4,249 245
Total listed 26,058 32,205 1,385
Unlisted 4,997 6,272 –
Total invested capital $ 31,055 $ 38,477 $ 1,385
Notes/Assumptions:
1) As at June 30, 2017
2) Listed investments at June 30, 2017 at quoted market prices other than BPY which is at IFRS value. Unlisted investments at IFRS values other than BPRI which is based
on privatization price
3) Annualized distributed cash flow is based on current distribution policies
84Growing distributions and eliminating value discounts
significantly increases our invested capital
Invested Capital
($billions)
Growth
2017 $ 38 Assumption
Capital appreciation
Distribution increase (BPY, BIP, BEP) 11 7%
Value appreciation (BBU & other) 6 10%
17
Retained free cash flow
Invested capital 9
Fee related earnings 7
Capitalization and dividends (6)
10 13%
Total
2022 $ 65 Return
Notes/Assumptions:
1) As at June 30. Projected 2022 results
2) Retained free cash flow includes fee related earnings, invested capital cash flow and dispositions of directly held assets. Assumes mid-point distribution growth for BPY, BIP and
BEP and a 7% increase per annum in BAM’s common dividend. Capitalization and dividends includes common share distributions. Accumulated balances are reinvested at 8%
85Pulling these together
86… and our base case leads to a
$104 per share intrinsic value over the next five years
2022
2022 Multiple Base Value
($millions) ($billions, except
per share amounts)
Asset Manager
Fee related earnings $ 1,689 20x $ 34
Generated carried interest, net 1,054 10x 10
Accumulated carried interest, net 5
49
Asset Owner
Invested capital 65
Leverage (10)
55
22%
Total $ 104 Total
Per Share $ 104 Return
Notes/Assumptions:
1) Values are for illustrative purposes and based on various factors that may or may not materialize, including past performance metrics that may not be indicative of future performance
2) Estimated total return includes dividends; total return calculated as compared to public pricing ($40 per share)
3) Projected annualized target carried interest, net assumes gross margin of 70%
87Plus…we have multiple opportunities
to create additional value
Regional funds
(e.g. Asia)
Expand product offerings and capabilities
through M&A (e.g. credit business)
Strategic relationships with clients
88Keys to financial success
1 2 3
Raise capital & Achieve target Expand fund
deploy wisely returns strategies
89Q&A
90Important Cautionary Notes
All amounts are in U.S. dollars unless otherwise known and unknown risks, uncertainties and other factors, We caution that the foregoing list of important factors that
specified. Unless otherwise indicated, the statistical and many of which are beyond our control, which may cause may affect future results is not exhaustive. When relying
financial data in this presentation is presented as of our and our subsidiaries’ actual results, performance or on our forward-looking statements, investors and others
June 30, 2017. achievements to differ materially from anticipated future should carefully consider the foregoing factors and other
results, performance or achievements expressed or uncertainties and potential events. Except as required by
implied by such forward-looking statements and law, we undertake no obligation to publicly update or
CAUTIONARY STATEMENT REGARDING FORWARD-
information. revise any forward-looking statements or information in
LOOKING STATEMENTS AND INFORMATION
this presentation, whether as a result of new information,
This presentation contains “forward-looking information” future events or otherwise.
within the meaning of Canadian provincial securities laws Factors that could cause actual results to differ materially
and “forward-looking statements” within the meaning of from those contemplated or implied by forward-looking
Section 27A of the U.S. Securities Act of 1933, as statements include, but are not limited to: the impact or CAUTIONARY STATEMENT REGARDING USE OF
amended, Section 21E of the U.S. Securities Exchange unanticipated impact of general economic, political and NON-IFRS MEASURES
Act of 1934, as amended, “safe harbor” provisions of the market factors in the countries in which we do business; This presentation contains references to financial metrics
United States Private Securities Litigation Reform Act of the fact that our success depends on market demand for that are not calculated in accordance with, and do not
1995 and in any applicable Canadian securities our products; the behavior of financial markets, including have any standardized meaning prescribed by,
regulations. Forward-looking statements include fluctuations in interest rates and foreign exchanges rates; International Financial Reporting Standards (“IFRS”). We
statements that are predictive in nature, depend upon or changes in inflation rates in North America and believe such non-IFRS measures including, but not
refer to future events or conditions, and include international markets; the performance of global equity limited to, funds from operations (“”FFO”) and invested
statements regarding our and our subsidiaries’ and capital markets and the availability of equity and debt capital, are useful supplemental measures that may assist
operations, business, financial condition, expected financing and refinancing within these markets; strategic investors and others in assessing our financial
financial results, performance, prospects, opportunities, actions including dispositions; the competitive market for performance and the financial performance of our
priorities, targets, goals, ongoing objectives, strategies acquisitions and other growth opportunities; our ability to subsidiaries. As these non-IFRS measures are not
and outlook, as well as the outlook for North American satisfy conditions precedent required to complete such generally accepted accounting measures under IFRS,
and international economies for the current fiscal year acquisitions; our ability to effectively integrate acquisitions references to FFO and invested capital, as examples,
and subsequent periods, and include, but are not limited into existing operations and attain expected benefits; the are therefore unlikely to be comparable to similar
to, statements regarding our asset management. In outcome and timing of various regulatory, legal and measures presented by other issuers and entities. These
some cases, forward-looking statements can be identified contractual issues; changes in accounting policies and non-IFRS measures have limitations as analytical tools.
by terms such as “expects,” “anticipates,” “plans,” methods used to report financial condition (including They should not be considered as the sole measure of
“believes,” “estimates,” “seeks,” “intends,” “targets,” uncertainties associated with critical accounting our performance and should not be considered in isolation
“projects,” “forecasts” or negative versions thereof and assumptions and estimates); the effect of applying future from, or as a substitute for, analysis of our financial
other similar expressions, or future or conditional verbs accounting changes; business competition; operational statements prepared in accordance with IFRS. For a more
such as “may,” “will,” “should,” “would” and “could.” and reputational risks; technological change; changes in fulsome discussion regarding our use of non-IFRS
government regulation and legislation within the countries measures and their reconciliation to the most directly
in which we operate; changes in tax laws; catastrophic comparable IFRS measures refer to our documents filed
Although we believe that our anticipated future results, events, such as earthquakes and hurricanes; the possible with the securities regulators in Canada and the United
performance or achievements expressed or implied by the impact of international conflicts and other developments States.
forward-looking statements and information are based including terrorist acts and cyberterrorism; and other risks
upon reasonable assumptions and expectations, the and factors detailed from time to time in our documents
reader should not place undue reliance on forward- filed with the securities regulators in Canada and the
looking statements and information because they involve United States.
91You can also read