Investor Presentation H1 2020 - Henner Rinsche (CEO/CFO) Marco Keul (Vice President Finance) - Leifheit AG
←
→
Page content transcription
If your browser does not render page correctly, please read the page content below
Investor Presentation H1 2020
Henner Rinsche (CEO/CFO)
Marco Keul (Vice President Finance)
13 August 2020
Disclaimer

This presentation contains forward looking statements which are based on the management’s current
estimates with regard to future developments. Such statements are subject to risks and uncertainties
which are beyond Leifheit’s ability to control or estimate precisely, such as statements on the future
market environment and economic conditions, the behavior of other market participants and government
measures.

If one of these uncertain or unforeseeable factors occurs or the assumptions on which these statements
are based prove inaccurate, actual results could differ materially from the results cited explicitly or
contained implicitly in these statements. Leifheit neither intends to, nor does it accept any specific
obligation to update forward-looking statements to reflect events or developments after the date of this
presentation.

Leifheit AG shall not assume any warranty for the information provided in this presentation being up-to-
date, accurate, complete or of good quality or for the suitability of the information for specific purposes.

Any liability of Leifheit AG for loss caused by the use or non-use of the information provided or by wrong
or incomplete information is excluded.

Investor Presentation H1 2020                                                                   August 2020    2
Welcome to the conference call

                                Agenda
                                • Executive Summary
                                • Introduction to Leifheit
                                • Key Strategic Initiatives
                                • Financial Figures 6M 2020
Henner Rinsche
CEO + CFO                       • Forecast Financial Year 2020
                                • Annex

Marco Keul
Vice President Finance

Investor Presentation H1 2020                                    August 2020   3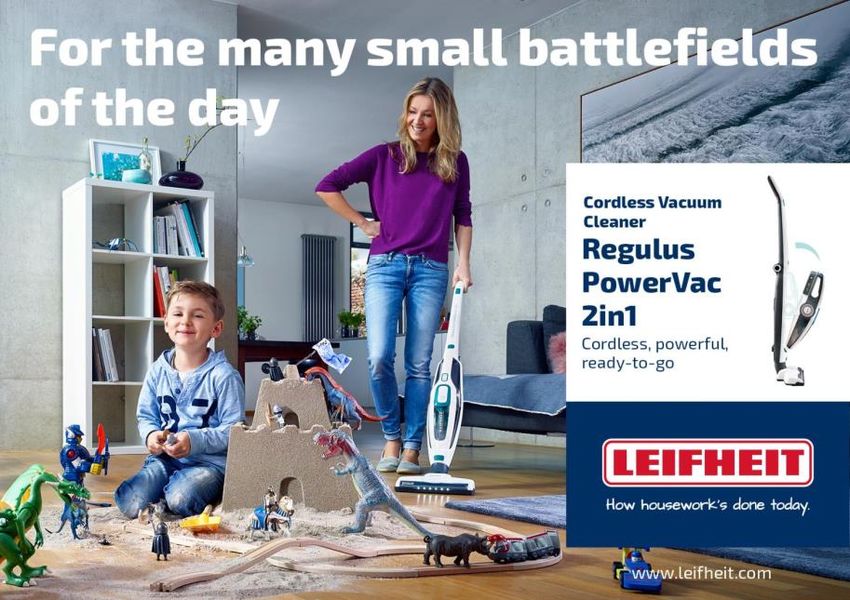
Management Summary

Strong Group turnover and earnings growth
in first half of 2020 despite COVID-19 pandemic
•     Very positive business development in the first half-year confirms new scaling-up success
      strategy

•     Leifheit Group well positioned in times of COVID-19 pandemic
         -     Rising sales in May and June across all channels after shutdown in March and April
         -     High quality products help consumers keep their homes hygienically clean and
               remain in high demand by consumers
         -     Measures taken to ensure stability in supply chain and to secure production
               and logistics processes pay off, especially for e-commerce

•     Advertising campaigns to continue in H2 2020
         -     Further TV campaigns for top Leifheit products in cleaning and laundry care
         -     Soehnle print campaign starts in September

•     Significant turnover and earnings growth expected for the financial year 2020:
      growth of Group turnover between 7% and 9% and Group EBIT of between
      EUR 12 million and EUR 15 million

Investor Presentation H1 2020                                                                 August 2020   4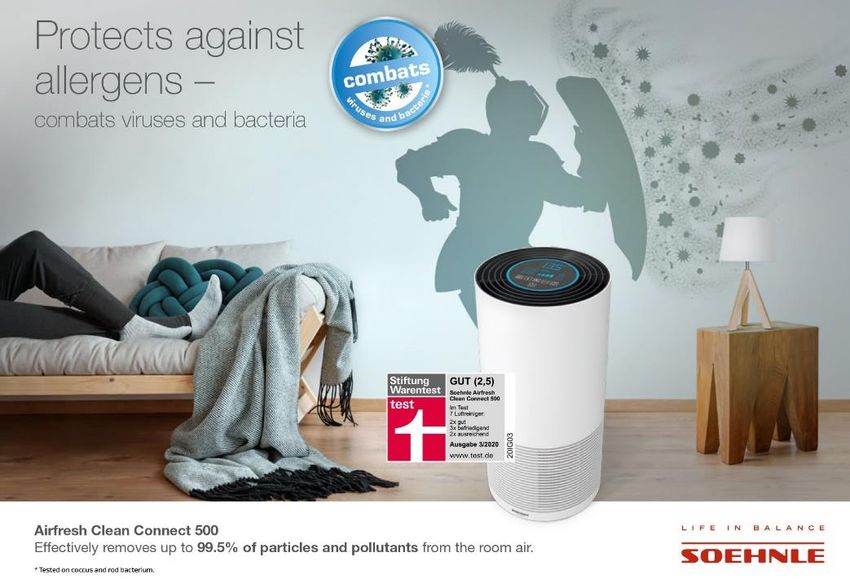
Management Summary

      COVID-19 pandemic strongly affected
      turnover development in March and April
      Group turnover development by months
      in %
                                                                       •   TV advertising led to
                                                                           a good start the first
                                                                           two months of 2020
40                                                              +33%   •   COVID-19 pandemic
                                                                           resulted in retail
30
                                                                           shutdowns in March
                                  +18%                                     and April
20
                                                         +13%          •   Rising turnover in
10             +6%                                                         May and June across
                                            -5%   -17%                     all channels after end
 0                                                                         of shutdown

-10

-20
                Jan                   Feb   Mar   Apr    May     Jun

      Investor Presentation H1 2020                                                August 2020   5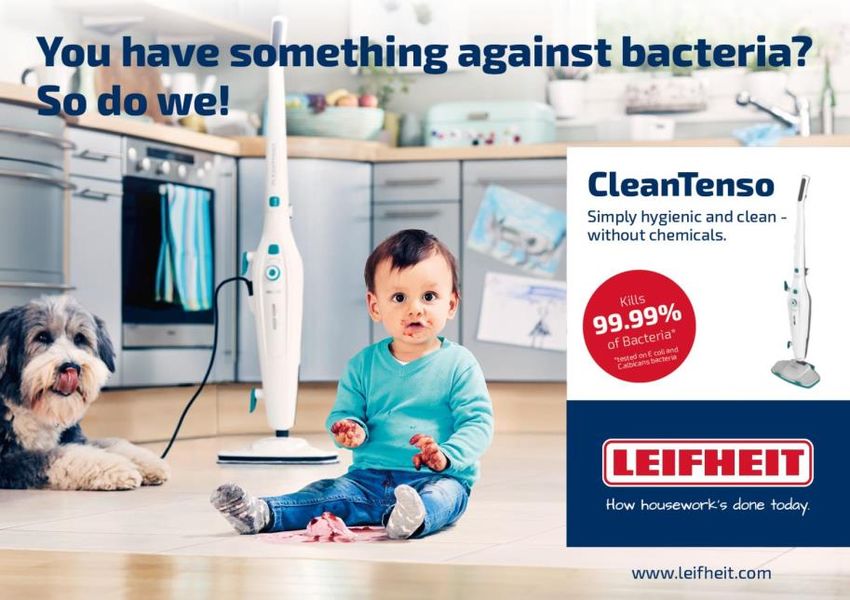
Management Summary

Key financial highlights: increased
turnover and EBIT despite COVID-19

                          1                        2                              3

               Turnover               Successful TV-campaigns                    EPS
   in the first half of 2020 up by   and consumers’ increased               almost doubled
      7.3% despite COVID-19          need for hygiene and home         from 0.32 € in 6M 2019
                 crisis               comfort sped up growth in          to 0.63 € in 6M 2020
                                     both Household (7.9%) and
                                         Wellbeing (21.7%)

                         4                        5                               6

                 EBIT                Gross margin improved as a       Negative cash flow mainly
     growth of 75.7% reflecting      result of positive product and   due to significant increase
     increased gross profit and        customer mix effects and            of working capital
       strict cost management         various efficiency measures     (increased turnover driving
                                                                         up trade receivables)

Investor Presentation H1 2020                                                         August 2020   6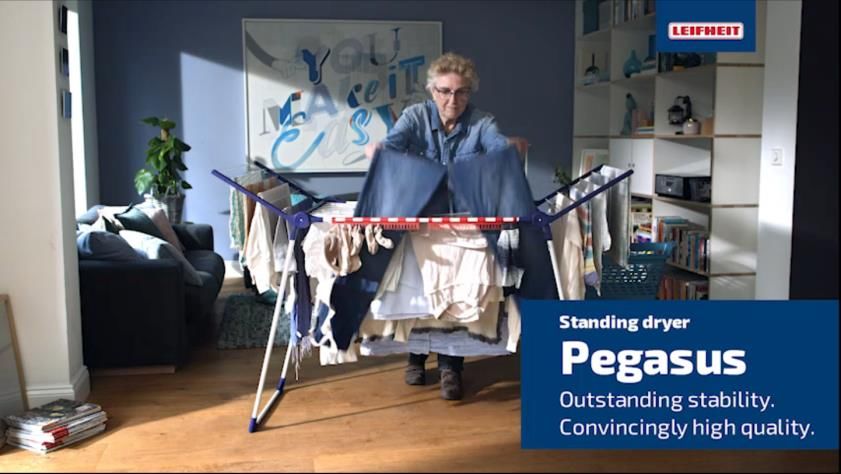
Introduction
to Leifheit
Introduction to Leifheit

Solid base to build on

Commitment to shareholders                                                                Strong products and brands
in €
1.50
1,50

       Dividend payments 1984 - 2019
1,00
1.00

0,50
0.50

0,00
0.00

                       Bonus/special dividend         Dividend

Strong financial structure                                                                Strong long-term stock performance
in € m                                                                                    in %
         Assets                                        Liabilities                        600
250    215    226        Cash and financial     250      215     226                      500
                         assets
200    50      47                               200              59                       400
                                                         52            Other provisions
                         Inventories                                   and liabilities
150    46      54                               150                                       300
                                                         67      65
                                                                       Pension reserves
100    52      61        Receivables and
                                                100                                       200
                         other current assets
50     10      9                                 50              102
                                                         96            Equity             100
       57      55
                         Other non-current
  0                      assets                  0                                          0
                                                                                             2010   2011   2012     2013          2015   2016     2017    2018    2020
                         Non-current assets
                                                                                                                      indexed
                                                                                                             Leifheit indiziert               indexed
                                                                                                                                         SDAX indiziert

Investor Presentation H1 2020                                                                                                                       August 2020      8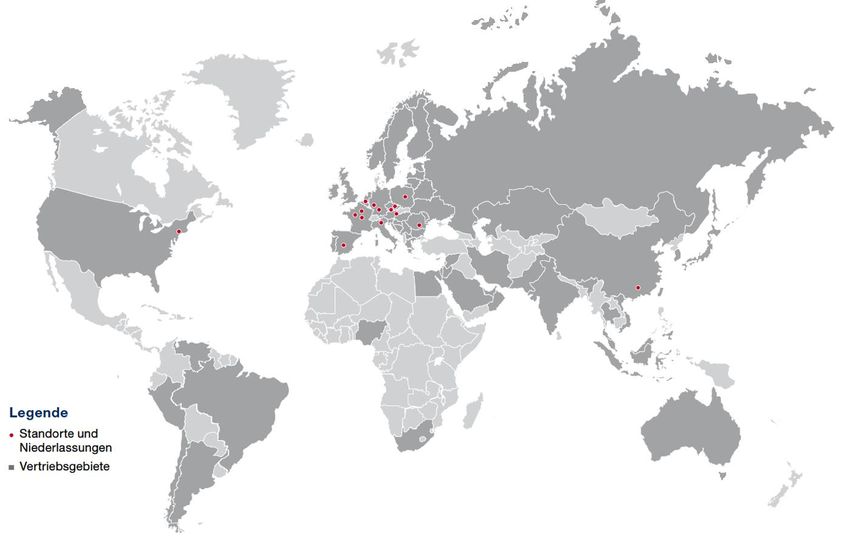
Introduction to Leifheit

Leifheit Group

                                Household                                        Wellbeing                        Private Label

                                                                                                               Kitchen        Standing
    Laundry Care                   Cleaning           Kitchen goods   Personal scales       Kitchen scales
                                                                                                               goods           Dryers

                                    Wellbeing
                                      9%                                                Rest of
                                                                                        World
                       Kitchen                                                           4%                   Germany
                       Goods                                Laundry
                                                             Care                                              41%
                        15%                                                   Eastern
                                        Turnover by          41%                                  Turnover
                                                                              Europe
                                          product                                                 by region
                                                                               13%
                                         category
                                                                                                  6M 2020
                                           6M 2020

                                                                                   Central
                                Cleaning
                                                                                   Europe
                                  35%
                                                                                    43%

Investor Presentation H1 2020                                                                                        August 2020     9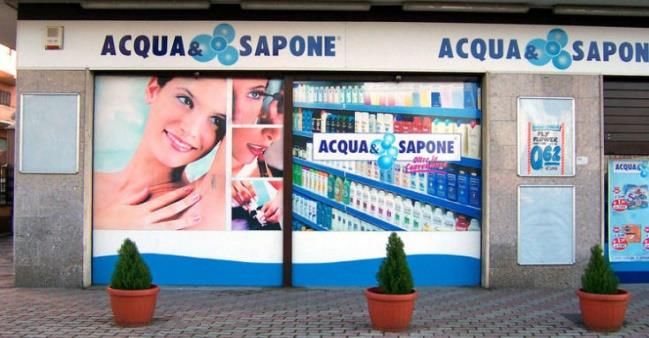
Introduction to Leifheit

Investor Presentation H1 2020   August 2020   10
Introduction to Leifheit

Fortunately hypers & discounters stayed open
during Covid-19 retail shut-downs
Blue Chip client base                         Distribution channels
                                              Turnover in % (previous year’s figures)

                                                                    Electro Others
                                                                     3 (3)   5 (5)
                                                    Cash & Carry
                                                       3 (3)
                                                                                            Hypermarkets
                                                  Discounter                                   29 (30)
                                                     8 (8)
                                 Top 10
                              Customers
                                                                        Turnover 2019:
                            account for 50%       Importers/
                                                                          € 234.0 m
                              of Leifheit’s       Exporters
                                turnover            8 (8)

                                              Retail-/Whole sale,
                                              Department stores
                                                    11 (12)                                  DIY
                                                                                            17 (16)
                                                                    E-Commerce
                                                                       16 (15)

Investor Presentation H1 2020                                                            August 2020   11
Introduction to Leifheit
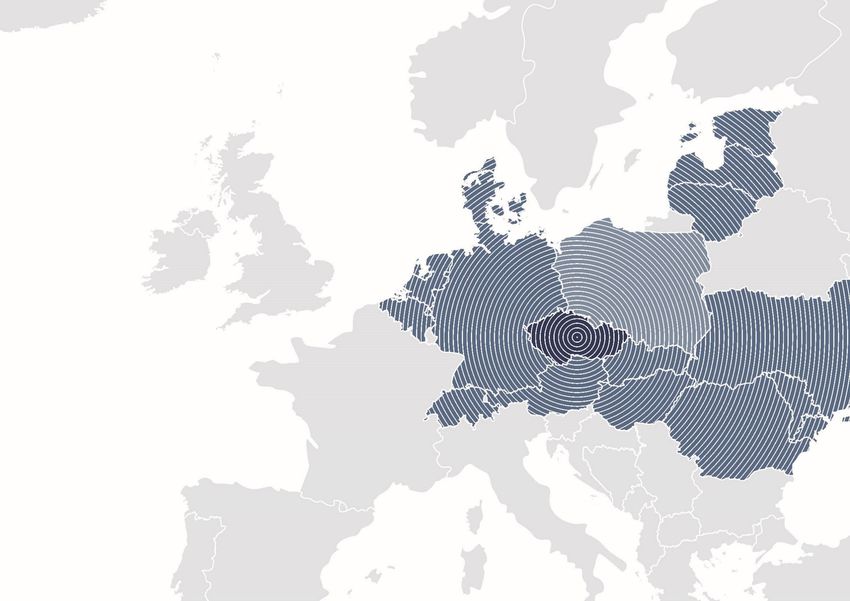
Operating in more than 80 countries
with 15 own branches
Paris/F (Leifheit/Birambeau) Nassau/D (Leifheit/Soehnle)
• About 80 employees • About 320 employees
• Marketing, sales • Marketing, sales, development, quality
and administration assurance, central administration
• Manufacturing of rotary dryers, vacuum jugs,
roll holders and floor wipers
Blatná/CZ (Leifheit)
• About 450 employees
• Manufacturing of tower dryers,
wall dryers and floor wipers
• Logistic center
Eastern Europe
Zuzenhausen/D (Leifheit)
• About 110 employees
• Logistics center
Head office and
branches La Loupe/F (Herby)
• About 80 employees
Sales region
• Manufacturing of wall and tower dryers
Investor Presentation H1 2020 August 2020 12Key Strategic Initiatives
Key Strategic
Initiatives
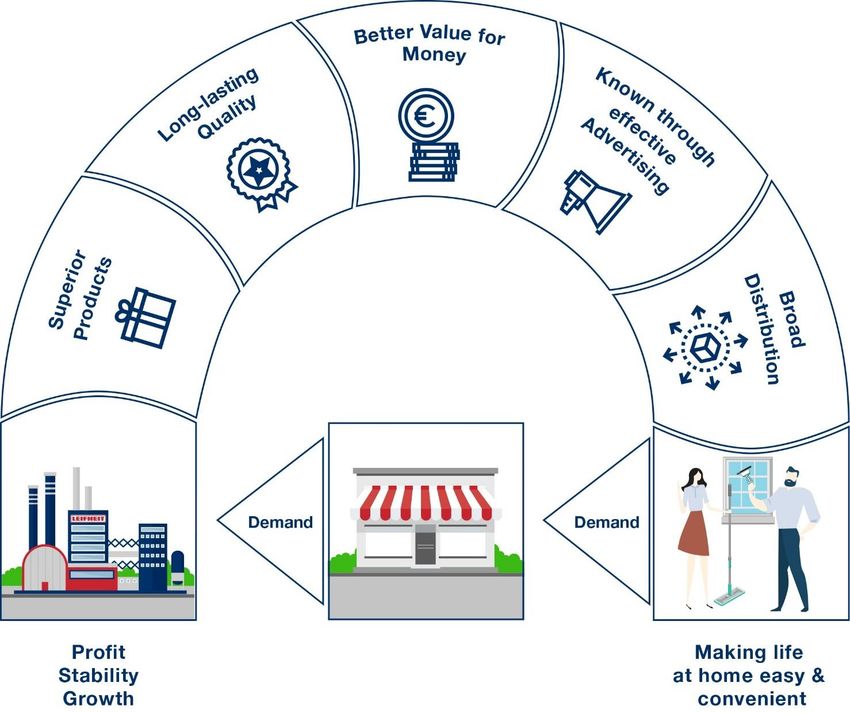
Our purpose? Happy consumers!
Better Value for
Money
Investor Presentation H1 2020 August 2020 14Key Strategic Initiatives
Urgent need for change
Gross profit EBIT
in € m in € m
109.9 102.1 101.0 18.8 13.1 9.9
-2% -7% -1% 20 -15% -31% -24% 12,00%
120 46.4% 18
43.6%
43.1% 45,0% 10,00%
16
100 8.0%
40,0% 14
8,00%
80 35,0% 12
30,0%
10 5.6% 6,00%
60
8 4.2%
25,0%
4,00%
40 6
20,0%
4
20 2,00%
15,0% 2
0 10,0% 0 0,00%
2017 2018 2019 2017 2018 2019
Gross profit Gross margin EBIT EBIT margin
Investor Presentation H1 2020 August 2020 15Key Strategic Initiatives
Can we change it? Yes we can!
Gross profit EBIT
in € m in € m
109.9 102.1 101.0 52.0 57.5 18.8 13.1 9.9 5.0 8.8
-2% -7% -1% -3% +11% -15% -31% -24% -25.9% +75.7%
20 12,00%
46.4%
43.6% 43.1% 44.1% 18
120 42.8% 45,0%
10,00%
16
100 40,0% 8.0%
14
8,00%
35,0% 12 6.8%
80 5.6%
30,0% 10 6,00%
60
8
25,0%
4.2% 4,00%
40 6 4.1%
20,0%
4
20 2,00%
15,0%
2
0 10,0% 0 0,00%
2017 2018 2019 6M 6M 2017 2018 2019 6M 6M
2019 2020 2019 2020
Gross profit Gross margin EBIT EBIT margin
Investor Presentation H1 2020 August 2020 16Key Strategic Initiatives
Scaling up success strategy
Focus
KPIs
Growth Profitability Level of Completion
1 • Invest in pre-tested and scalable
high ROI consumer advertising 2019 2020 2020+
Create consumer on profitable best sellers
demand • Launch new products only if margin Concept Realisation Impact
Revenue
> average and if supported by pre- growth
tested advertising
2
• Leverage stronger brand to attract 2019 2020 2020+
Increase national additional retailers and e-tailers
and international • Ensure good sell-out in new retail Concept Realisation Impact
distribution partners with co-advertising
Gross
margin
3 • Focus on own “made in Europe”
profitable products 2019 2020 2020+
Improve gross • Negotiate win-win with retailers, Concept Realisation Impact
margins growing their total but not their
% profit. Take pricing and charge
for logistics complexities
• Reduce SKUs dramatically EBIT
4
• Strict R&D discipline margin
2019 2020 2020+
Reduce all cost • Create fun, friendly, fast
except consumer & fearless culture Concept Realisation Impact
advertising • Growing revenues leverages
current structure
Investor Presentation H1 2020 August 2020 17Key Strategic Initiatives
1 Create consumer demand and make
brand stronger
Marketing spend
2019 in % of turnover
EBIT margin
25
20
Unilever1
15
Beiersdorf1
Adidas1
10
P&G1
5
Leifheit
0 Marketing spend
0 5 10 15 20 25 30 35
1 Source: Annual reports 2019
Investor Presentation H1 2020 August 2020 18Key Strategic Initiatives
1 Successful TV campaigns boost turnover
growth in the relevant markets in H1 2020
Turnover development selected TV markets
Group turnover 6M 2020 in € m
+49% +29% +46% +32% +48%
Netherlands Belgium Switzerland Poland Romania
Investor Presentation H1 2020 August 2020 19Key Strategic Initiatives
1 Creating and pre-testing effective ads
• Further TV campaigns in Germany and
selected European markets in H2.
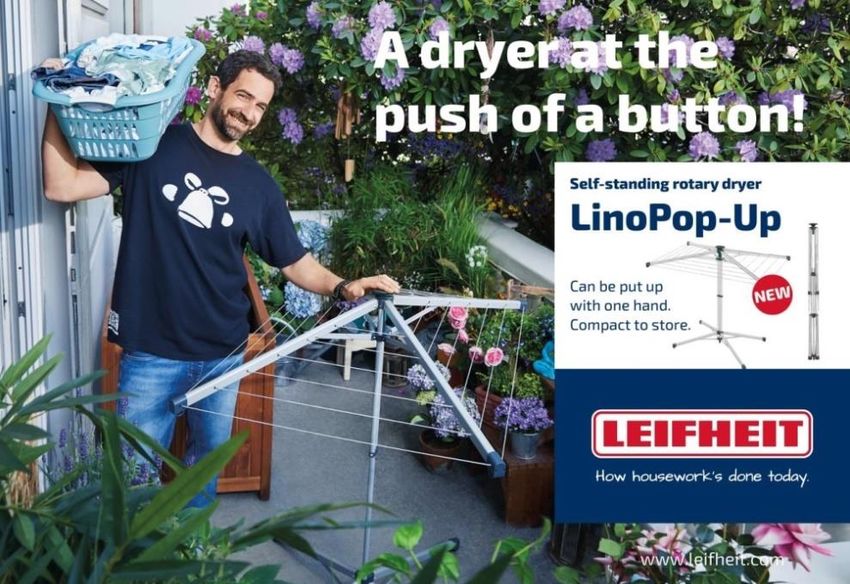
• Draw consumer attention to top products
such as the CLEAN TWIST set or the
Pegasus drying rack, which were tested
and awarded a “very good” grade.
• Major part of marketing investments are
incurred in the third quarter.
Investor Presentation H1 2020 August 2020 20Key Strategic Initiatives
1 Creating and pre-testing effective ads
Large-scale Soehnle print campaign
• Campaign focuses on Soehnle Page Profi 300 digital kitchen
scales, recently awarded a “very good” test result.
• Soehnle Page Profi is the most-popular range of kitchen
scales in Germany.
• Target group-relevant and high-reach top print titles
from September to December 2020:
8 million copies, 2.74 million target group contacts.
Investor Presentation H1 2020 August 2020 21Key Strategic Initiatives
2 Increase distribution
Turnover development Italy
Household and Wellbeing in € m
7 -14% -5% +40%
6
5
4
3
2
1
0
2017 2018 2019
Investor Presentation H1 2020 August 2020 22Key Strategic Initiatives
3 Improve gross margin
Focus on profitable products
Make in Europe Buy in Asia
Average contribution margin1 ~42% ~34%
Win-win retail negos
23.8 24.6
22.0 23.2
21.8 21.6
20.1
2015 2016 2017 2018 2019 6M 2019 6M 2020
1
Sales deductions + promotional allowances in % of sales
1 Household and Wellbeing segments
Investor Presentation H1 2020 August 2020 23Key Strategic Initiatives
3 Boost profitability rockets
Product A Product B Product C Product D…
medium medium medium
Contribution margin …
medium medium medium
Level of distribution …
Quality and
…
consumer satisfaction
Boost
consumer
marketing
Investor Presentation H1 2020 August 2020 24Key Strategic Initiatives
3 High consumer satisfaction with
Leifheit top products
Profi Floor Wiper Clean Twist Pegasus 150 Linomatic 500 Deluxe
4.7 stars 4.6 stars 4.6 stars 4.5 stars
Investor Presentation H1 2020 August 2020 25Key Strategic Initiatives
4 Reduce all cost except consumer
advertising
% of Group FY 2018 FY 2019 H1 2019 H1 2020 Change
turnover
✓
Consumer
0.7% 1.7% 1.3% 3.8% +2.5pp
marketing
Other marketing 5.4% 4.6% 4.7% 3,5% -1.2pp
✓
R&D 2.3% 2.4% 2.4% 2.0% -0.4pp
✓
Logistics 1 11.0% 11.5% 11.1% 10.0% -1.1pp
✓
Administration 6.1% 6.4% 6.7% 6.5% -0.2pp
✓
Cost of turnover 56.4% 56.8% 57.2% 55.9% -1.4pp
✓
OPEX 2 adj. by
Consumer marketing
94.2% 94.7% 94.9% 89.9% -5.0pp
✓
OPEX 2 94.9% 96.4% 96.3% 93.7% -2.6pp
✓
1 not including inbound cost 2 without other operating income/expenses
Investor Presentation H1 2020 August 2020 26Key Strategic Initiatives
4 Reduce all cost except consumer
advertising
Continuously working on an Excellence Programme
to reduce complexity and costs:
• Operational excellence
- Projects to reduce Logistic costs
- Streamlining portfolio and substantial SKU reduction
- Lean manufacturing initiatives and ratio projects to improve
efficiency of our production sites
- Savings from purchasing of raw materials
- Cost savings by digitalisation, meeting efficiency, travel expenses etc.
• Structural excellence
- Board of Management reduced from 3 to 2
- Sales structure in Germany has been streamlined
- New innovation strategy has led to headcount reduction in R&D
- Leaving employees will usually not be replaced
Investor Presentation H1 2020 August 2020 27Financial Figures 6M 2020
Financial Figures
6M 2020
Strong growth in Household and
Wellbeing segments
Group turnover by segment Group turnover by segment
6M 2019 vs 6M 2020 in € m 6M 2020
10.1%
130.4 81.1% Household
140 Private Label 8.8%
121.5 Wellbeing
13.2
120 Wellbeing Private Label
14.1 11.4
100 9.4
Household
80
• Turnover in Household segment up by 7.9%,
strong growth in product categories Cleaning and
60 Laundry Care due to successful TV campaigns
105.8
98.0 and consumers’ increased need for hygiene.
40
• Wellbeing segment increased by 21.7%,
mostly due to growth of Soehnle Medical
20
and Airfresh ranges.
0 • Private Label decreased by 6.6% compared
6M 2019 6M 2020 to the first half of 2019 due to strict COVID-19
restrictions in France.
Investor Presentation H1 2020 August 2020 29Financial Figures 6M 2020
Successful TV-advertising campaigns
result in increased demand
Group turnover by region Group turnover by region
6M 2019 vs 6M 2020 in € m 6M 2020
60 3.9%
54.3 53.6 55.3 12.6%
41.1% Germany
6M 2019
50 47.6
6M 2020 Central Europe
Eastern Europe
40
Rest of the world
42.4%
30
• Slight decrease by 1.3% in Germany due to
temporary closures of important distribution
20 16.5 channels as a result of COVID-19 restrictions.
15.3
• Central Europe with significant growth of 16.0%.
10 Especially in the Netherlands and Switzerland
4.3 5.0 Leifheit was able to further widen its distribution
network.
0
• Eastern Europe with turnover increase of 7.5%
Germany Central Eastern Rest of the
Europe Europe World due to increased consumer marketing
investments. Particularly strong growth in
Romania and Poland.
Investor Presentation H1 2020 August 2020 30Financial figures 6M 2020
Increased turnover and EBIT
despite COVID-19
6M 2019 6M 2020 ∆
Group turnover €m 121.5 130.4 7.3 %
Gross margin % 42.8 44.1 1.3 pps
EBIT adjusted for foreign currency result €m 4.8 8.9 85.6 %
Foreign currency result €m 0.2 -0.1 >- 100 %
EBIT €m 5.0 8.8 75.7 %
EBIT margin % 4.1 6.8 2.7 pps
Earnings before taxes (EBT) €m 4.3 8.3 91.8 %
Net result for the period €m 3.0 6.0 > 100 %
EPS € 0.32 0.63 96.9 %
Investor Presentation H1 2020 August 2020 31Financial figures 6M 2020
Negative cash flow mainly due to turnover-
related increase in receivables
in € m 6M 2019 6M 2020 ∆
Cash flow from operating activities 6.0 -0.2 -6.2
Cash flow from investment activities -2.7 -2.4 0.3
Cash flow from financing activities -10.3 -0.4 9.9
Change in cash and cash equivalents -7.1 -2.9 4.2
Cash and cash equivalents at the end of reporting period 43.9 47.4 3.5
Free cash flow1 3.3 -2.5 -5.8
in € m 31/12/2019 30/06/2020 ∆
Cash and cash equivalents at the end of reporting period 50.3 47.4 -2.9
Group liquidity 50.3 47.4 -2.9
Financial liabilities - - -
• Decrease in Group liquidity mainly results from the strong rise in working capital; short-term trade
receivables up by € 13.2 m to € 57.6 m and inventories increased by € 7.8 m to € 53.6 m on the
reporting date
• At € 2.4 m investments under previous year (€ 2.8 m)
1 Cash flow from operating activities and from investment activities, adjusted for incoming and outgoing payments in financial assets
and, if existing, from the divestiture of business divisions.
Investor Presentation H1 2020 August 2020 32Financial figures 6M 2020
Group liquidity affected by growth-related
increase in receivables and inventories
Group liquidity
31.12.2019 vs 30.06.2020 in € m • Increase in trade
receivables as a result
of turnover growth
(H1 2019: decrease
3.8 € 0.7 m)
6.0
50,3
47.4 • No noteworthy effects
5.1
6.0 from aging of
-2.4 -0.4 receivables in
-13,2 connection with
-7,8 COVID-19
56,3 • Increase in inventories,
50,3 46,9 47,8 due to consumer
45,1
Free 39,1
Cashflow39,1 advertising planned
€ -2.5 m
for the third quarter
and to the stocking-up
of raw materials
Cash and Net result Depreciation Trade Inventories Liabilities 1
Others Investments Lease Cash and
cash for the and receivables liabilities cash
equivalents period amortization equivalents
31.12.2019 30.06.2020
1 Others contains sales and income taxes in the amount of € 4.3 m
Investor Presentation H1 2020 August 2020 33Forecast Financial Year 2020
Forecast
Financial Year 2020
Economic recovery after shutdown:
optimistic outlook for the remainder of 2020
Economic • IMF: Global economy faces worst economic downturn since
environment 1930s depression with more gradual recovery than previously anticipated.
2020 • European commission: EU economy will experience a deep and
uneven recession with expected recovery in 2021.
• Economic barometer of the German Institute for Economic Research
(DIW) recovered significantly in July and went from the historic low of
2 points in June to a solid 90 points.
• GFK: Steady recovery of consumer climate in Germany after lifting
COVID-19 lockdown.
Forecast Group • Expected Group turnover growth of between 7% and 9%
development • Expected turnover growth by segment: Household 8.5% to 10.5%,
2020 Wellbeing 11% to 13%, Private Label slight decrease
• Group EBIT of between € 12 m and € 15 m
• EPS of between approx. € 0.83 and € 1.05
• Free cash flow of approx. € 1 to € 3 m, ROCE between 9% to 12%
• Forecast based on assumption that there will be no further significant
restrictions due to COVID-19 pandemic in relevant markets and channels.
Investor Presentation H1 2020 August 2020 35YOUR QUESTIONS PLEASE. 13 August 2020
Annex
Annex

Long-term financial overview

                                                2015    2016    2017    2018              2019
 Group turnover                            €m   231.8   237.1   236.8   234.2             234.0
 Profitability
 ▪     Gross margin                        %     46.7    47.5    46.4    43.6              43.1
 ▪     Cash flow
       from operating activities           €m    20.8    21.8     7.2    10.2              15.9
 ▪     Free cash flow                      €m    14.1    14.3     1.5     3.7              10.1
 ▪     EBIT                                €m    21.7    22.1    18.8    13.1               9.9
 ▪     EBIT adjusted1                      €m    19.2    21.8    20.3    12.8               9.6

 ▪     EBIT margin                         %      9.3     9.3     8.0     5.6               4.2
 ▪     EBT                                 €m    20.2    20.6    17.7    11.9               8.5
 ▪     Net result for the period           €m    14.3    14.5    12.9     8.4               5.8
 ▪     ROCE                              -1 %    18.1    16.3    12.7     8.5               7.0

1 Adjusted by foreign currency results

Investor Presentation H1 2020                                               August 2020      38
Annex
Long-term financial overview
2015 2016 2017 2018 2019
Per share1
Net result for the period2 € 1.51 1.53 1.35 0.88 0.61
Free cash flow € 1.48 1.51 0.16 0.39 1.06
Dividend3 € 1.00 1.05 1.05 1.05 0.55
Special dividend € 0.38 0.40 -- -- --
Investments €m 7.1 7.8 7.8 6.6 6.0
Depreciation €m 5.8 6.2 6.4 6.9 8.2
31/12/15 31/12/16 31/12/17 31/12/18 31/12/19
Employees No. 1,074 1,093 1,137 1,119 1,106
Balance sheet total2 €m 237.9 239.4 224.9 221.8 214.6
Equity €m 106.7 104.6 98.5 101.8 96.2
Equity ratio % 44.9 43.7 43.8 45.9 44.8
Liquidity €m 68.2 69.5 57.2 50.9 50.3
1 Scrip issue in June 2017, 2013 – 2016 adjusted
2 Not including repurchased treasury shares
3 2019: Proposal to the Annual General Meeting
Investor Presentation H1 2020 August 2020 39Annex
Experienced Management
Henner Rinsche Igor Iraeta Munduate Marco Keul
CEO + CFO COO Vice President Finance
Previous experience Previous experience Previous experience
• President Europe at • Many years of experience • Responsible for Finance,
SodaStream as CTO at Igus GmbH and Controlling, IT/Business
• Various leading positions at Stoba Präzisionstechnik processes and internal Sales
Henkel, Danone, PepsiCo • Various technical services as of 01 April 2020
and Procter & Gamble management positions at • 2012 – 2020 Head of
Robert Bosch GmbH Controlling at Leifheit AG
Core competencies
• General management, Core competencies Core competencies
business development and • Digitalization, IoT, Industry • IT, Finance & Controlling
consumer goods marketing 4.0, implementation of lean
production systems, agile
“Scrum” methods
Investor Presentation H1 2020 August 2020 40Annex
Committed to shareholder returns
Long-term dividend development Dividend yield 1
Dividend per share / in € 2019: 2.3% 2015: 5.6%
2018: 5.9% 2014: 3.9%
2017: 3.8% 2013: 5.3%
2016: 5.1% 2012: 5.2%
1,50
Proposal to the Annual
General Meeting for 2019: 0.55 €
1,00
0,50
0,00
1984
1985
1986
1987
1988
1989
1990
1991
1992
1993
1994
1995
1996
1997
1998
1999
2000
2001
2002
2003
2004
2005
2006
2007
2008
2009
2010
2011
2012
2013
2014
2015
2016
2017
2018
2019
Bonus/special dividend Dividend
1 Based on the particular closing price at year-end, 2019: proposal to Annual General Meeting
Investor Presentation H1 2020 August 2020 41Annex Leifheit awards (selection) Rotary dryer Rotary dryers Laundry dryers LinoProtect 400 Linomatic Pegasus Floor wiper CLEAN TWIST Window vaccum Profi micro duo System cleaners Isolating jug Isolating mug Cordless vaccum Steam Mop Columbus Flip 600 ml Regulus Aqua PowerVac 2in1 CleanTenso Investor Presentation H1 2020 August 2020 42
Annex

Soehnle awards (selection)

Kitchen Scales                  Personal Scales                                 Luftbefeuchter
Page Profi + Page Profi 300     Style Sense Compact 300 + Safe 300              Airfresh Hygro 500

Body analysis scales                        Blood pressure monitors   Luftreiniger
Shape Sense Connect 100 + 200               Systo Monitor 200 + 300   AirFresh Clean 300
                                                                      and Clean Connect 500

Investor Presentation H1 2020                                                          August 2020   43
Annex
Leifheit – more than 60 years of passion
for housework 2010
1984 • Sale of the business unit
• IPO of Leifheit AG ‘bathroom’ including the
brands Spirella, Kleine
Wolke and Meusch
1988
2008
• License agreement for
• Takeover of 60% of
Dr Oetker Bakeware
Herby/F
• Acquisition of Spirella and
Kleine Wolke (bathroom 2006
furnishings and -accessories) • Takeover of the remaining
1959 2001 shares of Birambeau/F
• Foundation • Takeover of
Soehnle Group
1960 1970 1980 1990 2000 2010 0 2020
1972 1995 2010
• Takeover of Leifheit • Start of the new • Takeover of the remaining
by ITT (U.S.) production plant in shares of Herby/F
Blatná/CZ
2012
1970
• Termination of the
• Annual production of 1998 license agreement with
carpet sweepers • Takeover of Dr Oetker Bakeware
reaches 2 m units, 34.6% of the
Leifheit becomes shares of 2017
European market Birambeau/F
leader • Capital
increase from
company funds
2019
• New Strategy
“Scaling up Success”
Investor Presentation H1 2020 August 2020 44Annex
European competitors by category
Cleaning Laundry care
Spontex Brabantia
Vileda Artweger
Rival
Tonkita Swiffer Juwel
Wenko Gimi Stewi
Vileda Metaltex
Kärcher Rörets Blome
Kitchen goods Wellbeing
Tescoma WMF Laica
Gefu Bosch
Rösle Tanita
Zyliss
Lurch ADE Homedics
Oxo Fackelmann
Sanitas Beurer
Emsa
Brabantia Westmark Tefal Withings Terraillon
Investor Presentation H1 2020 August 2020 45Annex
Significant free float and
international investors
Shareholder structure
August 2020
• Joachim Loh, Haiger (GER),
10.31%
10.31%
• MKV Verwaltungs GmbH, Grünwald (GER),
10.03%
10.03%
• Leifheit AG Nassau (GER), treasury shares
43.37% Aktien, 4.91%
4.91%
• Alantra EQMC Asset Management, SGIIC,
SA, Madrid (ES), 10.44%
10.44% • Teslin Capital Management BV/Gerlin NV,
Maarsbergen (NL), 5.05%
5.05%
• MainFirst SICAV, Senningerberg (LUX),
50.70% 5.04% 5.04%
3.52% • Blackmoor Ownership Holdings Master
Limited, London (UK), 3.52%
Non free float shareholders1 25.25% • Voting rights under notification
3.03% threshold 50.70%
Free float1,2 74.75%
1 Definition of German stock exchange for indices
2 Including shareholdings of the management board
Investor Presentation H1 2020 August 2020 46Annex
Financial calendar and contact
Dates 2020 Contact
30 Sep 2020 Corporate Communications / Investor Relations
Virtual Annual General Meeting in accordance
with the regulations of the C19 AuswBekG.
Phone: +49 2604 977-218
11 Nov 2020
Quarterly statement for the period Email: ir@leifheit.com
ending 30 September 2020
11 Nov 2020
www.leifheit-group.com
Investor and Analyst Conference Call
16 - 18 Nov 2020
Presentation at
German Equity Forum (online)
Investor Presentation H1 2020 August 2020 47Aktiengesellschaft Postfach 11 65 D-56377 Nassau
You can also read