FOURTH QUARTER FY'21 EARNINGS CONFERENCE CALL - DANIEL J. CROWLEY, CHAIRMAN, PRESIDENT AND CHIEF EXECUTIVE OFFICER JAMES F. MCCABE JR., SENIOR ...
←
→
Page content transcription
If your browser does not render page correctly, please read the page content below

Fourth Quarter FY’21 Earnings
                          Conference Call
 Daniel J. Crowley, Chairman, President and Chief Executive Officer
James F. McCabe Jr., Senior Vice President and Chief Financial Officer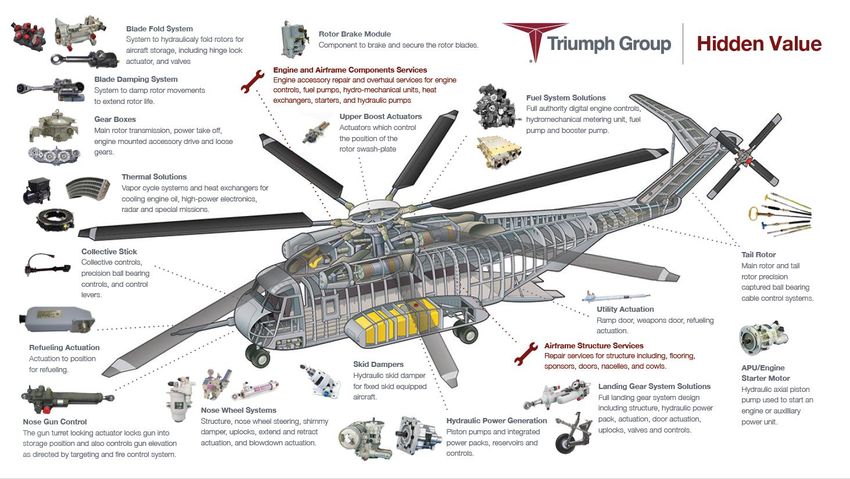
Forward Looking Statements
 This presentation contains forward-looking statements within the meaning of the Private Securities Litigation Reform Act of 1995. Forward-looking
 statements are often, but not always, identified by the use of words such as “anticipate”, “believe”, “expect”, “plan”, “intend”, “project”, “may”, “will”,
 “should”, “could”, or similar words suggesting future outcomes or outlooks. These forward-looking statements include, but are not limited to,
 statements of expectations of or assumptions about strategic actions, objectives, expectations, intentions, aerospace market conditions, aircraft
 production rates, financial and operational performance, revenue and earnings growth and profitability and earnings results. These statements are
 based on the current projections, expectations and beliefs of Triumph’s management. These forward looking statements involve known and unknown
 risks, uncertainties and other factors which could cause actual results to differ materially from any expected future results, performance or
 achievements, including, but not limited to, competitive and cyclical factors relating to the aerospace industry, dependence on some of Triumph’s
 business from key customers, requirements of capital, uncertainties relating to the integration of acquired businesses, general economic conditions
 affecting Triumph’s business segments, product liabilities in excess of insurance, technological developments, limited availability of raw materials or
 skilled personnel, changes in governmental regulation and oversight and international hostilities and terrorism. In addition to these factors,
 widespread health developments, including the recent global coronavirus (COVID-19) and the responses there to (such as voluntary and in some cases,
 mandatory quarantines, as well as shut downs and other restrictions on travel and commercial, social and other activities) could adversely and
 materially affect, among other things, the economic and financial markets and labor resources of the countries in which we operate, our
 manufacturing and supply chain operations, commercial operations and sales force, administrative personnel, third-party service providers, business
 partners and customers and the demand for our products, which could result in a material adverse effect on our business, financial conditions and
 results of operations. For a more detailed discussion of these and other factors affecting us, see the risk factors described in “Item 1A. Risk Factors.”
 Further information regarding the important factors that could cause actual results, performance or achievements to differ from those expressed in
 any forward looking statements can be found in Triumph’s reports filed with the SEC, including in the risk factors described in Triumph’s Annual Report
 on Form 10-K for the fiscal year ended March 31, 2020.

TRIUMPH GROUP / Q4 FY’21 / MAY 20, 2021                                                                                                                    2
VISION
            As One Team, we enable the safety and prosperity of the world.

                          MISSION
     We partner with our customers to triumph over their hardest aerospace, defense
             and industrial challenges to deliver value to our stakeholders.

                             VALUES
Integrity • Continuous Improvement • Teamwork • Innovation • Act with Velocity
Q4 FY’21 Takeaways

• Generating positive free cash flow for 2nd consecutive quarter
• Enhanced liquidity through “at the market” offering and debt retirement
• Core organic growth and improving adjusted margins throughout the year
• Strategic exits accelerating with recent divestitures and 747 closeout

                                Hidden Value of Our Core Business Showing Through
TRIUMPH GROUP / Q4 FY’21 / MAY 20, 2021                                             4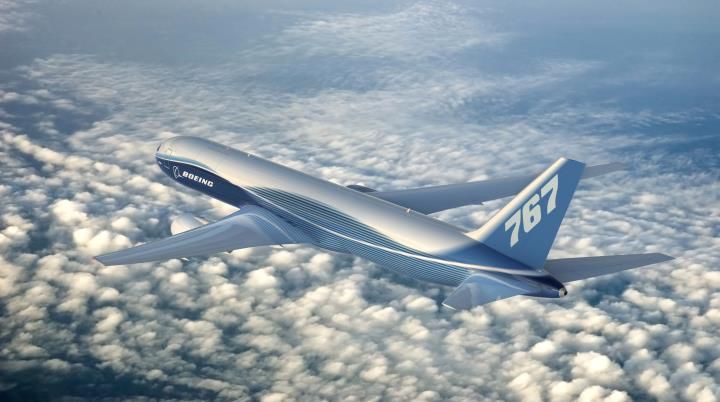
Q4 FY’21 Results Drivers

 ✓Systems & Support sales up 14% sequentially
 ✓Military sales up 25% YOY
 ✓Sequential improvement in Commercial results in both OEM and MRO
 ✓Gross margins improving YOY driven by quality of backlog and revenue
 ✓$145M net equity raise; $64M debt retirement
 ✓Completed sale of Composites & Military structures facilities

                               Strong FY 21 Finish; Strong Momentum Entering FY 22
TRIUMPH GROUP / Q4 FY’21 / MAY 20, 2021                                              5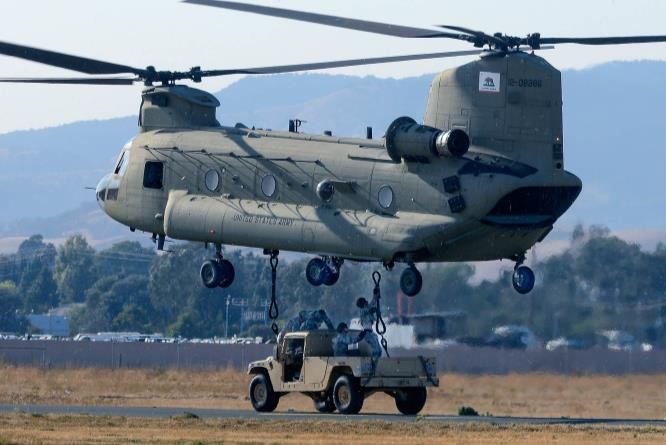
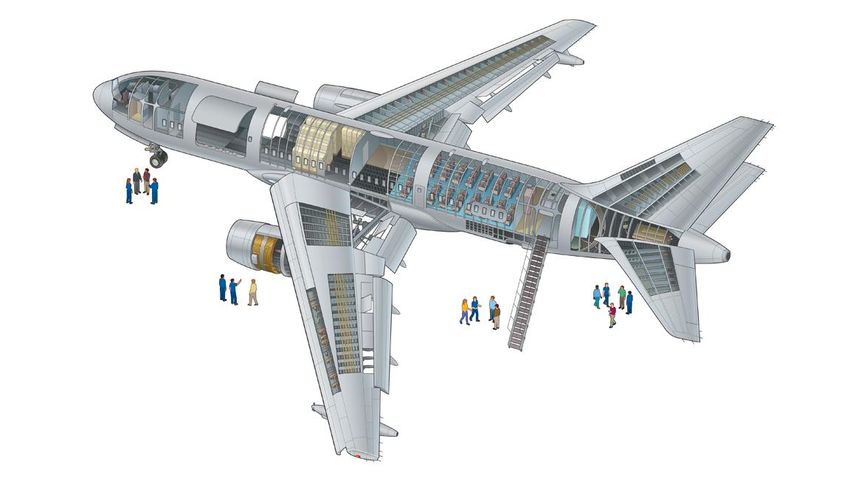
Hidden Value – Extensive Solutions
                                                        Broad Customer Base
  Comprehensive Products & Services

                                                                                      Fighters

                                                                                                 Global Market Presence
                                      Fixed Wing

                                                                         Rotorcraft
                                                   Extensive Platform Participation
TRIUMPH GROUP / Q4 FY’21 / MAY 20, 2021                                                                                   6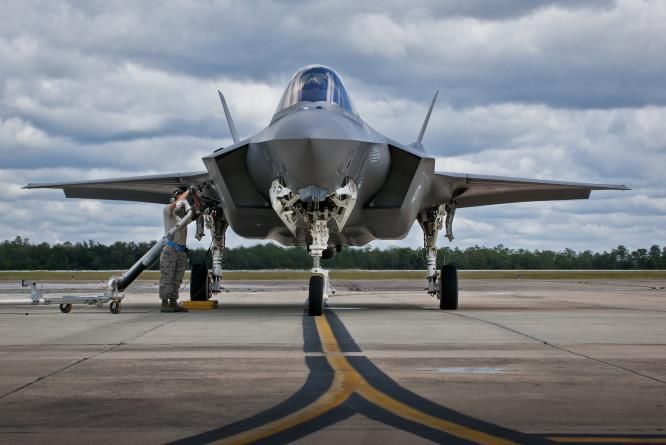
Q4 Focus: Extensive Suite Of Rotorcraft Solutions With IP content
TRIUMPH GROUP / Q4 FY’21 / MAY 20, 2021                                                    7
Aviation Industry Macro Trends Q4
                COVID Cases                                                   Bookings                            Load Factor                    TSA Throughput
                                 Spain                                YoY Drop in Bookings                                                                         2.3M
                                 USA                                                                     79%
                                                                                 Total Tickets
                                 Global
                                                                             Corporate Tickets
                                 UK                                                                                                 75%                            1.6M
                                 Italy
                                                                                                 - 46%
                                                                                                                                                            2019
                                                                                                                                                            2021
                                                                                                               2019
                                                                                                               2021
                                                                                                  -75%

           Stable (except India)                                          20% Improvement                  26% Improvement                      1.6M (new high)

                       Flights                                             Global Capacity                        Utilization                     Parked Fleets
                                                                                                               Utilization Hours
                                                Capacity Change to 2019
          # Commercial Flights 114k/day                                                                                                                       RJ
                                                                                                                       TA
                                                                                   Summer                                          10.3 hrs                   TA
                                                                                                                       SA
                                                                                   Improvements                                                               SA
                                    77k/day

                2020
                2021
                                                                                                                                   7.4 hrs.

          3% Improvement to 3Q                              May (-48%), June (-38%)                        SA Improvements                    New low during COVID
       Sources: Airlines for America, Cirium Ascend, Flight Radar 24

                                              Positive Trends Across Key Leading Indicators
TRIUMPH GROUP / Q4 FY’21 / MAY 20, 2021                                                                                                                                   8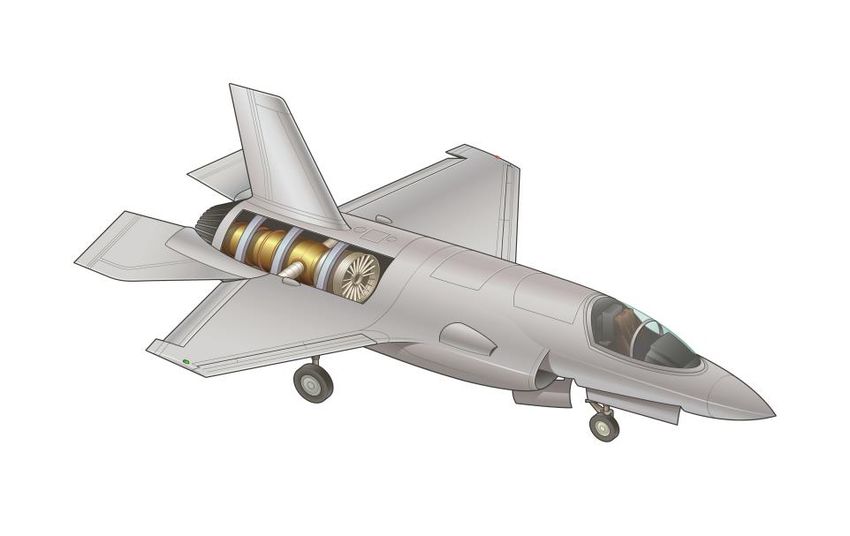
Systems & Support – Q4 Insights
• TSS sales declined 14% driven by the commercial end market
  mitigated by a 22% increase in Mil/Gov sales.

• 4th quarter TSS sales rose 14% sequentially driven by military and
  commercial end market improvements of 7% and 24% respectively.

• All Boeing Commercial Transport platform shipments rose in
  sequentially (Net +37%)

• TSS MRO performance is leading indicator of aviation recovery:

• 50% of TSS Q4 sales and 55% of BL from Mil/Gov end market

                                  Measurable Recovery in Q4. Military Backlog > 50%.
    TRIUMPH GROUP / Q4 FY’21 / MAY 20, 2021                                            9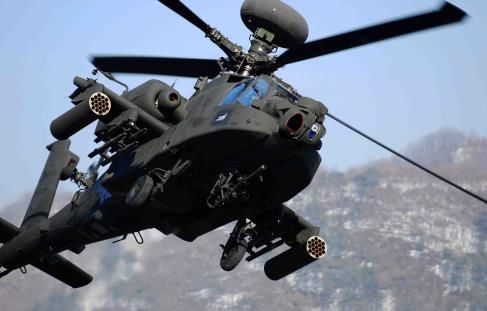
Organic Growth Offsetting COVID-19 Impact
Competitive Wins                            Customer            BU
T-7A Afterburner Fuel Pump                  GE                  TSS
                                                                      • In Q4, TSS had two of the highest month bookings for
CFM56 Engine MRO                            AAR                 TSS
                                                                        FY21
Falcon 6X Anti-Ice Valve Control            Dassault            TSS
FARA OEM Actuation System                   FARA OEM            TSS   • Q4 Wins > $350M
F-15EX Control Cables                       Boeing              TSS
F-18 Heat Exchanger                         US Navy             TSS

Follow-on Business                          Customer            BU
787 Landing Gear Systems                    Boeing              TSS
CH-53K Engine Accessory Gearbox             GE                  TSS
429 Main Transmission                       Bell                TSS
F-16 Reconnaissance System Cooling Pod      Collins Aerospace   TSS
AH-64 Engine Control Upgrade                US Army             TSS
Citation Jet Engine Heat Exchanger          Williams Int.       TSS

Partnerships                                Customer            BU
Finalized Joint Venture                     AirFrance KLM       TSS
Landing Gear Distribution Agreement         VSE                 TSS

               Platform Diversity Across Fixed Wing, Rotorcraft, Commercial, and Military
  TRIUMPH GROUP / Q4 FY’21 / MAY 20, 2021                                                                                      10
Significant Recent Awards
T-7A Engine Components Geared Solutions Renewals Diversified MRO Awards
West Hartford CH-53K Engine Acc. Gearbox Multiple Platforms and Customers
GE F404 Afterburner Fuel Pump • Signed multi-year agreement with GE to • AH-64 EMC-102 Upgrades
provide the T408 Accessory Gearbox for • US Army
• Recently signed 5-year agreement to
supply GE with the afterburner fuel the CH-53K. • F-18 ATFLIR Pod ECV MRO
pump for the F404 engine to be placed • Strengthens Triumph’s position on the • US Navy
on Boeing T-7A. King Stallion which contains shipset • B-1 HX Spares
content over $2M/vehicle. • US Air Force
• This initial contract expands upon
existing T-7A hydraulic and AMAD Bell 429 Main Rotor Gearbox • T129 HMA Spares
content (IP). • Foreign Military
• Recently completed a multi-year
• T-7A program projected to have the agreement to continue supplying Bell • AH-64 Eng. Driven Pump MRO
largest 5-year growth CAGR among fixed with the Main Rotor Gearbox for the 429 • Boeing Defense
wing military aircraft. rotorcraft. • CFM56 Repair RFP
• AAR
Extending Contracts and Expanding IP-based Solutions
TRIUMPH GROUP / Q4 FY’21 / MAY 20, 2021 11Systems & Support Expectations
Recent Near-Term Sales by End Market
Longer-Term View
Performance Expectations
$1.1B Sales – Production 0-3% higher
Production/MRO1 Recovery to FY20 levels Commercial Military Other
60%/40% MRO 15-20% higher
~15% EBITDAP Margin Improve margin % End Market EBITDAP consistent
Margin expansion to with Sales Profile
–Production/MRO2 through cost reductions,
prior targets of ~20%
30%/70% volume, mix and price
Stable Military End Market
Commercial End Market
Reinvestment in Improved Cash Improvements Slow, But Steady
Solid Cash Generation operations and R&D Conversion
Solid Results Sets Foundation For Post-COVID Performance
1 MRO is 60%/40% repair services to spare part sales
2 MRO margin is 35%/45% repair services to spare part sales
TRIUMPH GROUP / Q4 FY’21 / MAY 20, 2021 12Consolidated Quarterly Results
($ in millions) FY’21 Q4 FY’21 Q3 FY’20 Q4
Planned reductions from our portfolio
Net Sales $467 $423 $693 transformation and sunsetting programs along
with production rate reductions lead to the
Operating Loss (46) (35) (40)
decrease in sales.
Operating Margin (10%) (8%) (6%)
Adjusted Operating Income* $33 $38 $39
Excluding non-cash impairment, loss on sale &
Adjusted Operating Margin 7% 9% 6% restructuring margins are up year over year.
*See Appendix for Non-GAAP reconciliation
Sequential Organic Growth in Core Operations
TRIUMPH GROUP / Q4 FY’21 / MAY 20, 2021 13Consolidated Full Year Results
($ in millions) FY’21 FY’20
Planned reductions from our portfolio
Net Sales $1,870 $2,900 transformation and sunsetting programs along
with production rate reductions lead to the
Operating (Loss) Income (326) 58
decrease in sales.
Operating Margin (17%) 2%
Adjusted Operating Income* $108 $204
Adjusted Operating Margin 6% 7% Excluding non-cash impairment, loss on sale &
restructuring margins comparable year over
*See Appendix for Non-GAAP reconciliation year.
Comparable Margins Despite Pandemic Headwinds
TRIUMPH GROUP / Q4 FY’21 / MAY 20, 2021 14Systems & Support
$60 $39
$400 $302 $352 $40
$264 $19
$300 Operating $20
$200 Income $-
Revenue $100 (Loss) $(20)
$- $(40) ($22)
Q4 Q3 Q4 Q4 Q3 Q4
FY'21 FY'21 FY'20 FY'21 FY'21 FY'20
T-7A
Financial
Highlights
• Net sales increased 14% compared to Q3 on early commercial OEM recovery,
• T-7A Afterburner fuel pump win in Systems,
continued strength on military platforms such as E-2D and stronger aftermarket
Electronics & Controls
recovery
• Adjacent market captures in rail, nuclear and
• Down 14% to prior year on production and aftermarket changes due to COVID:
submarines
− Aftermarket down 5% to prior year; up 33% sequentially
• AS9100 & ISO 9001 recertification received in
− Commercial OEM down 32% to prior year; Military up 22% to prior year
Geared Solutions with improved results
• Integrated Drive Generator (IDG) test stand • Operating margin up to 116 bps Y-o-Y after adjusting for prior year impairment
installed in Product Support resulting in
doubled testing capacity − Operating expenses down 13% to prior year
Increased Revenues In Both Commercial OEM and MRO Markets Sequentially
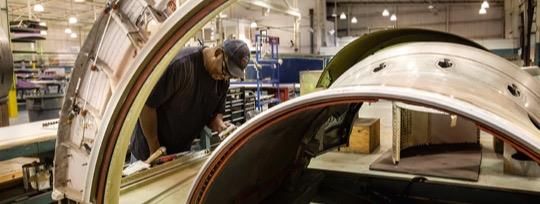
TRIUMPH GROUP / Q4 FY’21 / MAY 20, 2021 15Aerospace Structures
$10
$400 $345 $4
$5
$300 $0
$165 $162 Operating
$200 ($5) ($2)
Revenue $100
Income
($10)
$-
(Loss) ($15) ($14)
Q4 Q3 Q4 Q4 Q3 Q4
FY'21 FY'21 FY'20 FY'21 FY'21 FY'20
Boeing 767
Highlights Financial
• “Green” performance across all commercial • Revenue increased 2% sequentially on commercial programs combined with
and military programs sustaining military production and spares
• 747 Program wind-down on schedule • Continued operational execution (direct and indirect cost efficiencies) offset
• Signed agreement in February and closed by commercial volume and divestiture declines
divestiture of Red Oak and Milledgeville • Remaining programs and facility exits on track
operations to ACP on May 7th • Operating margin, adjusted for restructuring, slightly improved vs prior year
• Completed sale-leaseback of Spokane
building to facilitate pending closure
Stabilized Performance; Portfolio Actions On Track
TRIUMPH GROUP / Q4 FY’21 / MAY 20, 2021 16Free Cash Flow Walk
Consolidated ($ in millions) FY’21 Q4 FY’21 Full Year
Net loss $ (74) $ (451) Full Year FY’21 Cash Drivers
Non-cash items:
Depreciation & Amortization 21 93 • ($40M) of advance liquidation; ($10M) in Q4
Non-Cash Impairment (Intangibles & Rotables) - 276 • ($60M) funding on G280 & B747-8; ($10M) in Q4
• ($33M) in restructuring costs
Interest Expense & Other 39 171
Amortization of Acquired Contracts (4) (39) Expected FY’22 Cash Drivers
Pension Income (8) (38) • ($84M) of advance liquidation; ($21M) / Qtr
OPEB Income (4) (10) • ($60M) of funding on B747-8 exit; Mostly 1st half
Income Tax Expense 1 3 • ($30M) of customer settlements; Mostly Q1
Cash sources (uses):
Working Capital Change 92 (56)
Interest Payments (38) (117)
Capital Expenditures (6) (25)
OPEB Payments (1) (2)
Tax Payments, net (1) (2)
Free Cash flow/(Use) $ 17 $ (198) See Appendix for reconciliation of cash used in operations to free cash use
Improving Operations And Working Capital Driving Positive Cash Flow
TRIUMPH GROUP / Q4 FY’21 / MAY 20, 2021 17Net Debt & Liquidity
($ in millions) FY’21 Q4
Raised $145M net proceeds in ‘At The
Cash $ (590) Market’ equity offering
Retired ~$63M of notes due June 2022
8.875% 1st Lien Notes Due Aug 2024 700
Receivable Securitization Facility - Called remaining notes due June
Finance Leases 20 2022 in May
5.250% Senior Notes Due June 2022 236 ~ $113M repayment of 1st Lien Notes in
6.250% Senior Notes Due Sept 2024 525 May
7.750% Senior Notes Due Aug 2025 500
Cash and Availability ~ $624M
Net Debt $ 1,392
Strong Availability; De-leveraging Underway
TRIUMPH GROUP / Q4 FY’21 / MAY 20, 2021 18Concluding Remarks
• 2nd straight quarter of positive free cash flow
• Strong liquidity through financing actions
• Continued organic growth and improving adjusted margins
• Strategic exits accelerating with divestiture completion
Challenges Met. Positioned For Future.
TRIUMPH GROUP / Q4 FY’21 / MAY 20, 2021 19Appendix TRIUMPH GROUP / Q4 FY’21 / MAY 20, 2021 20
Top Programs in Backlog

       Systems & Support                     Aerospace Structures
       Airbus A320, A321                     Boeing 767, Tanker
       Boeing V-22                           Boeing 777
       Boeing AH-64                          Gulfstream G650
       Boeing 737                            Airbus A350
       Boeing 787                            Boeing 747
       Sikorsky UH60                         Boeing 787
       Boeing F/A-18                         Boeing 737
       Bell 429                              Airbus A330
       Boeing CH-47                          Gulfstream G280
       Northrop Grumman E-2D                 Embraer E2
       Represents 52% of                     Represents 94% of
       Systems & Support backlog of $1.18B   Aerospace Structures backlog of $0.69B

TRIUMPH GROUP / Q4 FY’21 / MAY 20, 2021                                               21
Restructuring by Business Unit
$ in Millions Q1 FY'21 Q2 FY'21 Q3 FY'21 Q4 FY'21 FY'21
Systems & Support $ 3 $ 3 $ 1 $ 2 $ 9
Aerospace Structures 7 11 3 16 37
Corporate 6 - - 2 8
Total TGI * $ 15 $ 14 $ 4 $ 20 $ 53
* difference due to rounding
TRIUMPH GROUP / Q4 FY’21 / MAY 20, 2021 22Supplemental Data
Pension/OPEB Analysis ($ in millions) FY’22 FY’21
Pension Expense (Income) ^ ≈ ($48) ≈ ($38)
OPEB Expense (Income) ^ ≈ ($9) ≈ ($10)
^ Excludes impact from one-time adjustments such as curtailments, settlements or special termination benefits.
Est. required contributions ($ in millions) Pension OPEB
Fiscal 2022 ≈ $2 ≈ $3
Fiscal 2023 ≈ $1 < $1
Fiscal 2024 ≈ $1 < $1
Fiscal 2025 ≈ $1 < $1
≈ $1
Fiscal 2026 < $1
TRIUMPH GROUP / Q4 FY’21 / MAY 20, 2021 23Non-GAAP Disclosure
Adjusted Operating Income is defined as GAAP Operating Income, less expenses/gains
associated with the Company's transformation, such as restructuring expenses, gains/losses on
divestitures, defined benefit plan gains/losses from curtailments, settlements, etc; impairments of
goodwill and other assets. Management believes that this is useful in evaluating operating
performance, but this measure should not be used in isolation. The following table reconciles our
Operating income to Adjusted Operating income as noted above.
Three Months Ended Year Ended
March 31, March 31,
2021 2020 2021 2020
Operating (loss) income - GAAP $ (46,212 ) $ (40,302 ) $ (326,151 ) $ 57,907
Adjustments:
Loss on sale of assets and businesses, net 58,682 1,726 104,702 56,916
Impairment of long-lived assets and goodwill — 66,121 252,382 66,121
Impairment of rotable inventory — — 23,689 —
Restructuring costs 20,477 11,850 53,224 25,340
Legal judgment gain, net of expenses — — — (9,257 )
Union incentives — — — 7,071
Adjusted operating income - non-GAAP $ 32,947 $ 39,395 $ 107,846 $ 204,098
TRIUMPH GROUP / Q4 FY’21 / MAY 20, 2021 24Non-GAAP Disclosure
FINANCIAL DATA (UNAUDITED)
TRIUMPH GROUP, INC. AND SUBSIDIARIES
(dollars in thousands)
Non-GAAP Financial Measure Disclosures (continued)
Cash provided by operations, is provided for consistency and comparability. We also use free cash flow as a key factor in
planning for and consideration of strategic acquisitions and the repayment of debt. This measure should not be considered in
isolation, as a measure of residual cash flow available for discretionary purposes, or as an alternative to operating results
presented in accordance with GAAP. The following table reconciles cash provided by operations to free cash flow.
Three Months Ended Fiscal Year Ended
March 31, March 31,
2021 2020 2021 2020
Cash provided by (used in) operating activities $ 22,752 $ 57,378 $ (173,119) $ 96,666
Less:
Capital expenditures (6,190 ) (12,584 ) (25,178 ) (39,834 )
Free cash flow (use) $ 16,562 $ 44,794 $ (198,297 ) $ 56,832
TRIUMPH GROUP / Q4 FY’21 / MAY 20, 2021 25You can also read