August 2019 Enercom Presentation - Cedric Burgher, Chief Financial Officer Occidental Petroleum Corporation - Oxy

Page created by Rose Fernandez
 
CONTINUE READING
August 2019 Enercom Presentation - Cedric Burgher, Chief Financial Officer Occidental Petroleum Corporation - Oxy
August 2019
Enercom Presentation
Cedric Burgher, Chief Financial Officer
Occidental Petroleum Corporation
August 2019 Enercom Presentation - Cedric Burgher, Chief Financial Officer Occidental Petroleum Corporation - Oxy
Cautionary Statements
Forward-Looking Statements
This presentation contains “forward-looking statements” within the meaning of the “safe harbor” provisions of the Private Securities Litigation Reform Act of 1995, including but not
limited to statements about Occidental Petroleum Corporation’s (“Occidental”) expectations, beliefs, plans or forecasts. Forward-looking statements involve estimates, expectations,
projections, goals, forecasts, assumptions, risks and uncertainties, many of which involve factors or circumstances that are beyond Occidental’s control. Actual results may differ from
anticipated results, sometimes materially, and reported or expected results should not be considered an indication of future performance. Factors that could cause actual results to
differ and that may affect Occidental’s results of operations and financial position appear in Part I, Item 1A “Risk Factors” of Occidental’s Annual Report on Form 10-K for the year
ended December 31, 2018, and in Occidental’s other filings with the U.S. Securities and Exchange Commission (“SEC”). Additional factors related to the completed transaction
between Occidental and Anadarko Petroleum Corporation (“Anadarko”) appear in the definitive proxy statement/prospectus that is a part of Occidental’s registration statement on
Form S-4, as amended (the “Registration Statement”), which was declared effective by the SEC on July 11, 2019, in connection with the completed transaction between Occidental
and Anadarko. Because the factors referred to above could cause actual results or outcomes to differ materially from those expressed or implied in any forward-looking statements,
you should not place undue reliance on any such forward-looking statements. Further, any forward-looking statement speaks only as of the date of this presentation and, unless legally
required, Occidental does not undertake any obligation to update any forward-looking statement, as a result of new information, future events or otherwise.

Use of non-GAAP Financial Information
This presentation includes non-GAAP financial measures. Where available, reconciliations to comparable GAAP financial measures can be found on Occidental's website at
www.oxy.com. Occidental is unable to provide a reconciliation of non-GAAP financial measures contained in this presentation that are presented on a forward-looking basis because
Occidental is unable, without unreasonable efforts, to estimate and quantify the most directly comparable GAAP components, largely because predicting future operating results is
subject to many factors outside of Occidental's control and not readily predictable and that are not part of Occidental's routine operating activities, including various domestic and
international economic, regulatory, political and legal factors.

Cautionary Note to U.S. Investors
The SEC permits oil and gas companies, in their filings with the SEC, to disclose only proved, probable and possible reserves. Any reserve estimates provided in this presentation that
are not specifically designated as being estimates of proved reserves may include "potential" reserves and/or other estimated reserves not necessarily calculated in accordance with,
or contemplated by, the SEC’s latest reserve reporting guidelines. U.S. investors are urged to consider closely the oil and gas disclosures in our 2018 Form 10-K and other reports and
filings with the SEC. Copies are available from the SEC and through our website, www.oxy.com.

                                                                                                                                                                                      2
August 2019 Enercom Presentation - Cedric Burgher, Chief Financial Officer Occidental Petroleum Corporation - Oxy
Positioned To Be The Innovative and
      Sustainable Energy Leader

 Technical Leader in Shale, CO2
  Enhanced Oil Recovery, and Low
  Carbon Business
 Low Cost Leader through Large Scale
  Portfolio of Complementary Assets
 Return of Capital Leader with World
  Class People, Assets, and Innovation

                                         3
August 2019 Enercom Presentation - Cedric Burgher, Chief Financial Officer Occidental Petroleum Corporation - Oxy
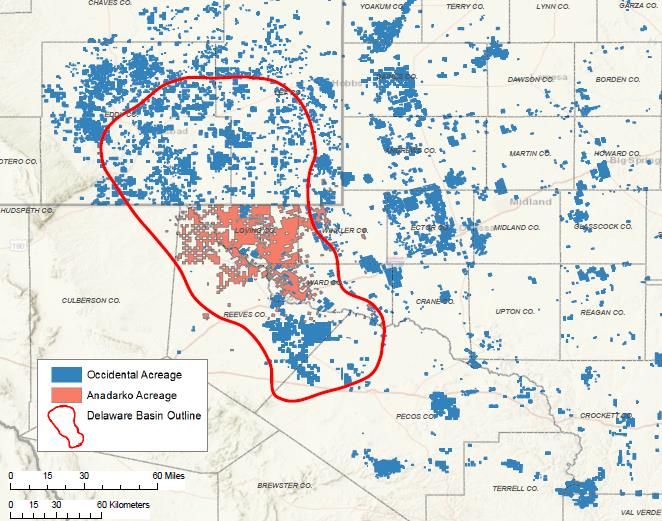
2018 Return On Capital and Return Of Capital
                           20%

                                                                                                            Returned $3.6 B to shareholders in 2018,
                                                                                                             including $1.3 B of share repurchases
                           15%
                                                                                        OXY                 Since 2002, returned $34 B of Total Capital
                                                                                                             through 1Q19
                                                                                                            Sector leading returns, achieved 14% ROCE
                           10%                                                                               and 27% CROCE in 20182
                ROCE (%)

                           5%

                           0%

                           -5%
                                 0%       2%             4%             6%              8%          10%       12%      14%     16%     18%
                                                                                        Total Yield1 (%)
  1Total Yield = (Dividend + Repurchase) / Market Capitalization on December 31, 2018
  2See  the reconciliation to comparable GAAP financial measures on our website.
  Note: Bubble Size represents Distribution = (Dividend + Repurchase) / OCF
                                                                                                                                                           4
  Note: Peers Include: APA, APC, CNQ, COP, CVX, EOG, HES, MRO, TOT, XOM
August 2019 Enercom Presentation - Cedric Burgher, Chief Financial Officer Occidental Petroleum Corporation - Oxy
Oxy Consistently Returns Capital to Shareholders
                                              Over $34 B of Total Capital Returned Since 2002
                                5,000                                                                                                                                                             $3.50
                                            Dividend Sustainable Long-term at $40 WTI
                                4,500
                                            Consecutive Dividend Growth Since 2002 - 11% CAGR1                                                                                                   $3.00
                                4,000
                                            Over 90% of Market Capitalization Returned to Shareholders
$ MM Returned to Shareholders

                                3,500                                                                                                                                                             $2.50
                                            Commitment to Strong Balance Sheet

                                                                                                                                                                                                          Dividends per Share
                                3,000       11% Annualized TSR YTD since 2002                                                                                                                    $2.00

                                2,500

                                                                                                                                                                                                  $1.50
                                2,000

                                1,500                                                                                                                                                             $1.00

                                1,000
                                                                                                                                                                                                  $0.50
                                 500

                                     -                                                                                                                                                            $0.00
                                            2002 2003 2004 2005 2006 2007 2008 2009 2010 2011 2012 2013 2014 2015 2016 2017 2018 2019E                                                        2

                                12002
                                                                                      Dividends $ MM                 Share Repurchases $ MM                     Dividends per Share $
                                       through 2019 annualized
                                2Assumes current shares outstanding as of 6/30/19 for 2H19
                                                                                                                                                                                                                                5
                                Note: 2013 dividend total adjusted to reflect that 1Q13 dividend was paid in 4Q12. 1H19 dividends per share reflects expected annual 2019 dividend payment.
August 2019 Enercom Presentation - Cedric Burgher, Chief Financial Officer Occidental Petroleum Corporation - Oxy
Timeline for APC Acquisition
                                                                                     APC Accepts CVX
  Initial Offer    Increased Offer to          Expressed           CVX Offer
                                                                                     $65/Share Offer
 $61.22/Share          $76/Share           Continued Interest,    $64/Share
                                                                                       Rejects Oxy
    All Stock          50% Cash             Rejected by APC       25% Cash
                                                                                     $76/Share Offer

  Sept 2017           Jan 2018                Dec 2018             Feb 2019           Apr 12, 2019

                     BRK $10 B;                                   Hedged 300
Oxy Public Offer                           $8.8 B Term Loans,    Mbopd of 2020        $13 B Bonds,
                     Africa MOU;
  $76/Share                                 Bridge Financing                         Bridge Financing
                    Offer Accepted                                Production;
  50% Cash                                      Reduced                               Fully Replaced
                   $76/Sh., 78% Cash                              Ecopetrol JV

 Apr 24, 2019         May 2019                Jun 2019             Jul 2019            Aug 6, 2019

                                        Acquisition Closed             Aug 8, 2019
                                                                                                        6
August 2019 Enercom Presentation - Cedric Burgher, Chief Financial Officer Occidental Petroleum Corporation - Oxy
Anadarko Acquisition – Sources of Financing

                                   Weighted Average Cash Yield Less than 5%
                                                   Cash Cost                                                 $B    Yield
                                              Term Loans1                                                 $8.8     3.0%
                                             Bonds Issued1                                                $13.0    3.1%
                                           Berkshire Preferred                                            $10.0    8.0%
                                            Total Cash Cost                                               $31.8    4.6%

                                         Other Consideration                                                 $B
                                            Oxy Equity2                                                    $7.4
                                       APC Debt (Assumed)3                                                $10.7
                                     WES Debt (Consolidated)3                                              $7.5
                                     Total Other Consideration                                            $25.6

                                         Total Consideration                                              $57.4

 1Term  loans and a portion of the bonds are floating rate notes which are expressed on a fixed equivalent basis
 2Includes new shares issued and warrants
 3As of 6/30/19 per APC 2Q 2019 10Q
                                                                                                                           7
August 2019 Enercom Presentation - Cedric Burgher, Chief Financial Officer Occidental Petroleum Corporation - Oxy
2020 Oil Hedges

                                          Three-Way Costless Collar                                                                              Objectives
                                                                                                                Hedging Program Reduces 2020 Breakeven to
                         $80                                                     Short Call
                                                                                  $74.09                         Low $40 WTI range
                         $75

                         $70
                                                                                                                Hedged 300 Mbod with Three-Way Costless
                         $65
                                             Short Put
                                               $45                Long Put                                       Collars
                                                                    $55
                                                                                                                Maintain Upside Exposure
Realized Price ($/bbl)

                         $60

                         $55

                         $50                                                                                                                        Details
                                                                                                               Summary July 2019 derivative instruments
                         $45                                                                                   2020 Settlement
                         $40                                                                                   Three-way collars (Oil MBBL/day)                            300
                                                                                                                       Average price per barrel (Brent oil pricing)
                         $35                                                                                                              Ceiling sold price (call)     $ 74.09
                                 Realized Brent + $10         Realized       Realized Brent       Realized                                Floor purchase price (put)    $ 55.00
                         $30                                    $55                               $74.09                                  Floor sold price (put)        $ 45.00
                         $25
                               $25          $35            $45        $55         $65         $74.09     $85   2021 Settlement
                                                             Brent ($/bbl)                                     Call options sold (Oil MBBL/day)                            300
                                                                                                                         Average price per barrel (Brent oil pricing)
                                                                                                                                            Ceiling sold price (call)   $ 74.09
                               Note: As of July 31, 2019                                                                                                                          8
August 2019 Enercom Presentation - Cedric Burgher, Chief Financial Officer Occidental Petroleum Corporation - Oxy
Amplifies and Strengthens Our
                Value Proposition
Expected Metrics for Combined Company
 2x FCF after dividend vs prior 2022 plan1
 2021 FCF yield of 12%2
 2x cash flow upside to oil price with breakeven
  at $40 WTI
 Expands cash margin ~10% by lowering cost3
 +10 B Boe of resource acquired at ~$2 per
  Boe4
  1$60 WTI/$65 Brent and $3 MID-MEH differential. 2022 prior plan represents stand-alone Oxy as presented in 4Q 2018
  earnings deck with capex of $5.2 B as compared to new combined company plan at $6.6 B.
  2FCF yield defined as Free Cash Flow / market capitalization. Market cap assumption based on current share price and

  expected shares outstanding after APC acquisition. FCF based on $60 WTI CFFO less $6.6 B capex and preferred dividends but
  before common dividend.
  3Based on lower combined operating costs and G&A post synergies.

  4Based on APC acquisition cost, value of WES and APC’s African assets, and APC’s total domestic resource
                                                                                                                               9
August 2019 Enercom Presentation - Cedric Burgher, Chief Financial Officer Occidental Petroleum Corporation - Oxy
Oxy’s Combined Integrated Portfolio
                              Oil & Gas                                               OxyChem                                                 Midstream
                                Focused in world class                                Leading manufacturer of                                  Integrated infrastructure and
                                basins with a history of                              basic chemicals and                                      marketing provides access to
                                maximizing recovery                                   significant cash generator                               global markets
                                                                                                                                                                      1.3 MMboed1
                                                                                                      Rockies                                                           Combined
  Permian Unconventional                                                                                                                                              Oxy Production
                                                                                                                                               22%
                                                                                         • Leading position in the DJ Basin
• 1.6 MM net acres including                                                                                                                      259
  premier Delaware Basin position                           Gulf of Mexico                  > 0.4 MM net acres including              31                                  Permian
                                                     • 10 Active operated platforms           vast minerals position                                          533         Rockies
• Strategic infrastructure and
  logistics hub in place                             • Significant free cash flow           > Largest producer in Colorado                      142                       Gulf of Mexico
                                                       generation                             with significant free cash flow                                             South America
• EOR advancements
                                                     • Sizeable inventory of remaining   • Emerging Powder River Basin                                          78%       Middle East
                                                                                                                                                        334
                                                       tie-back opportunities                                                                                             Domestic
                                                                                         • Largest producer in Uinta Basin
                                                                                                                                                                          International

                                                                                                                                                      Middle East
             Permian Conventional
                                                                      South America                                             • High return opportunities in Oman
        • 1.4 MM net acres
                                                             • Premium position in Colombia                                       > 6 MM gross acres
        • Significant scale, technical capability,
          and low-decline production                            > TECA steamflood development                                     > 17 identified horizons

        • CCUS potential for economic growth                    > Six new exploration blocks                                    • Developing ON-3 in U.A.E.
          and carbon reduction strategy                         > ~2 MM total gross acres                                         >        1.5 MM acres
                                                             • South American deepwater                                           >        Between Al Hosn and Oman developments
                                                               exploration opportunities                                        • Al Hosn and Dolphin provide steady cash flow with
           14Q18   Net MMboed excluding Africa
                                                                                                                                  low sustaining capex                                    10
Premier, Complementary Global Asset Portfolio

 #1 Producer in the Permian
                                    #4 Producer in Gulf of Mexico
                                    
 #1 in CO2 EOR Projects
                                    Leading Position in Colombia
                                    
 #1 Producer in the DJ Basin
                                    Top 3 Producer of PVC, Chlorine,
                                    
                                        and Caustic Soda
 #1 Producer in the Uinta Basin

                                     Leading International Midstream
                                    
 #1 Independent Producer
                                       Assets and MLP
    in Oman

                                                                         11
Significant Identified Synergies with Potential Upside
Expected Pre-Tax Annual Synergies and Capital Reduction ($ B)
                                                                                                                                $1.5                                      $3.5

                                                                                                                                                               Capital Synergies:
                                                                                                                                                                     $0.9 B
                                                                                       $0.9                                                                 Opex/G&A Synergies:
                                                                                                                                                                  $1.1 B
                                                      $0.6
                                                                                                                                                               Capital Reduction:
                                                                                                                                                                     $1.5 B
                 $0.5

     Permian Capital and Opex Savings        Procurement & Supply Chain    General Overhead & Infrastructure       Moderate Growth Capital Reduction   Synergies + Moderate Growth Capital Reduction

      Domestic Capital                                                    General Overhead &                     Combined Growth Capital                  Synergies + Combined
                                        Procurement & Supply Chain
     Operating Efficiency                                                     Corporate                                Reduction                         Growth Capital Reduction

Domestic Capital and Operating Efficiency                                                      General Overhead & Corporate
• Transition to full, efficient development mode                                               • Reduction in G&A and consolidation of corporate functions
• Over 10% anticipated improvement in Domestic drilling & completion costs                     • Single corporate governance & management team
• Estimate above does not include improved productivity through joint expertise                • Application of combined company best practices and experience to all business
Procurement & Supply Chain                                                                       units
• Integration and optimization of supply chain functions on a global platform                  Combined Capital Reduction
• Expected savings of 5% of combined annual capital and operating expenditures                 • $400 MM achieved through agreed sale of Africa assets

                 Oxy has identified $2 B / year of primary synergies plus $1.5 B / year of capital reduction

                                                                                                                                                                                                       12
Excess Cash Generation Above Breakeven

       $8                                                  2021 Excess Cash Generation After Dividend1                                                            Production
                                                                                                                                                                  Growth 5%
                                                                                                                                                                 Capex $6.6 B
       $6
                                                                                                                      Production
                                                                                                                      Growth 5%
  $B

       $4                                                                                                            Capex $6.6 B
                                                                          Production
                                                                          Growth 5%
       $2                                                                Capex $6.6 B
                            Flat Production
                             Capex $3.9 B
        $-
                                  $40                                         $50                                         $60                                         $70
                                                                                                      WTI

         Breakeven maintained at $40 WTI with $3.9 B sustaining capex
         Highly leveraged to oil price to generate significant excess cash
         At greater than $50 WTI, production growth of 5% and capex of $6.6 B will be maintained
         At less than $50 WTI, production and capex will be moderated to stay within cash flow

  1Expected free cash flow net of taxes and after dividend payment. Sustaining capex of $3.9 B includes synergy capture. Referring to footnote on Slide 22, free cash flow calculated as combined Oxy
  and APC (excluding cash flow generated by WES but including distributions) using cash flow sensitivity of $255 MM pre-tax (post-Africa sale) for every $1 change in the price of oil.
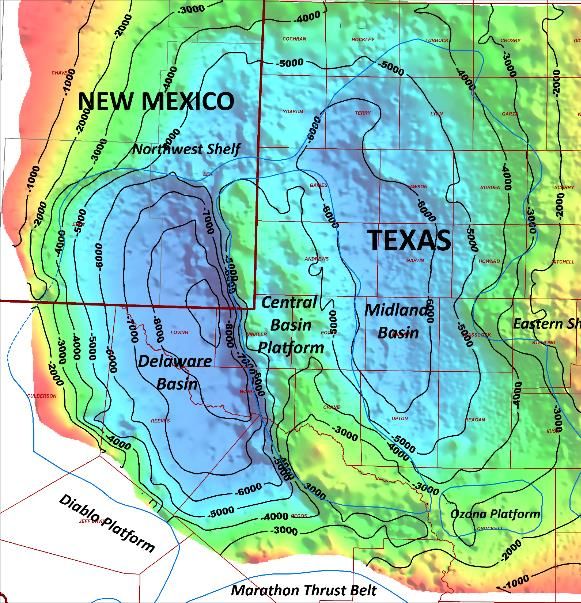
                                                                                                                                                                                                        13
Delaware Basin – Synergistic Assets

                                                                                                                   Oxy is competitively advantaged with experience in
  Oxy Aventine - Maintenance
       and Logistics Hub                                                                                           Delaware Basin geology and regional supply logistics
                                                                                                                   • Anadarko’s acreage is located in the middle of Oxy’s
                                                  Greater Sand Dunes                                                 core development areas and on trend with Delaware
                                                                                                                     Basin geology
                                                                                                                   • Anadarko’s acreage is well positioned to benefit from
                                                                                                                     Oxy’s Aventine logistics supply hub
Delaware
                                                                                                                   Oxy’s Delaware Basin Wells Outperform Competitors
 Basin
                                                                                                                   • Oxy has 26 of the top 100 wells in the Delaware Basin,
 Greater Barilla Draw                                                                                                based on 6 month cumulative oil production1
                                                                                                                   • Oxy has the highest average 6 month cumulative oil
                                                                                                                     production of all Delaware Basin operators1
                                                                                                                   • Oxy’s subsurface and operational experience together
                                                                                                                     with supply logistics will extend competitively
                                                                            Depth to Wolfcamp (tvdss) c.i. 1000’
                                                                                                                     advantaged results to the Anadarko acreage

     1Source:   IHS Enerdeq as of 7/11/2019, horizontals >500ft with 6 months oil production available since January 2018                                                    14
Leading Delaware Basin Operator

                               6 Month Cumulative Oil Top 100 2018 Wells1                                                                                                                                                           12 Month Cumulative Oil Top 100 2018 Wells2
Oxy’s subsurface expertise delivers Basin leading wells                                                                                                                                               Oxy has 20%+ of the best wells, while only drilling 7% of
                    for less cost:                                                                                                                                                                                 total Delaware Basin wells
   Competitors
   30          use 28% more proppant: >$500 M                                                                                                                                                                                       20
 # of Top 100 Wells in the Delaware Basin

                                                                                                                                                                                         # of Top 100 Wells in the Delaware Basin
                                            25
                                                                                                                                                                                                                                    15
                                            20

                                            15                                                                                                                                                                                      10

                                            10
                                                                                                                                                                                                                                    5
                                             5

                                             0                                                                                                                                                                                      0
                                                         Peer 1

                                                                  Peer 2

                                                                           Peer 3

                                                                                    Peer 4

                                                                                             Peer 5

                                                                                                            Peer 7

                                                                                                                     Peer 8

                                                                                                                              Peer 9
                                                                                                      APC
                                                   OXY

                                                                                                                                       Peer 10

                                                                                                                                                 Peer 11

                                                                                                                                                           Peer 12

                                                                                                                                                                     Peer 13

                                                                                                                                                                               Peer 14

                                                                                                                                                                                                                                         OXY
                                                                                                                                                                                                                                               Peer 1
                                                                                                                                                                                                                                                        Peer 2
                                                                                                                                                                                                                                                                 Peer 3
                                                                                                                                                                                                                                                                          Peer 4
                                                                                                                                                                                                                                                                                   Peer 5
                                                                                                                                                                                                                                                                                            Peer 6
                                                                                                                                                                                                                                                                                                     Peer 7
                                                                                                                                                                                                                                                                                                              Peer 8
                                                                                                                                                                                                                                                                                                                       Peer 9
                                                                                                                                                                                                                                                                                                                                Peer 10
                                                                                                                                                                                                                                                                                                                                          Peer 11
                                                                                                                                                                                                                                                                                                                                                    Peer 12
                                                                                                                                                                                                                                                                                                                                                              Peer 13
                                                                                                                                                                                                                                                                                                                                                                        Peer 14
                                                                                                                                                                                                                                                                                                                                                                                  Peer 15
                                                                                                                                                                                                                                                                                                                                                                                            Peer 16
                                                                                                                                                                                                                                                                                                                                                                                                      Peer 17
                                                                                                                                                                                                                                                                                                                                                                                                                Peer 18
                                                                                                                                                                                                                                                                                                                                                                                                                          Peer 19
                                                                                                                                                                                                                                                                                                                                                                                                                                    Peer 20
                                                                                                                                                                                                                                                                                                                                                                                                                                              Peer 21
                                            1Source:  IHS Enerdeq as of 7/11/2019, horizontals >500ft with 6 months oil production available since January 2018. Peers in Top 100 include: APC, COP, CXO, DVN, EOG, FANG, Mewbourne, MTDR, NBL, PDC,
                                            RDS, WPX, XEC, XOM
                                            2Source: IHS Enerdeq as of 7/11/2019, horizontals >500ft with 12 months oil production available since January 2018. Peers in Top 100 include: BP, BTA OIL, CPE, CRZO, CVX, CXO, DVN, EOG, FANG, Felix

                                            Energy, HK, JAG, Mewbourne, NBL, PDC, PE, RDS, ROSE, WPX, XEC, XOM
                                            Note: All of Oxy’s wells that made the top 100 wells for 6 months and also had at least 12 months of public data made the list of top wells in the 12 month chart.
                                                                                                                                                                                                                                                                                                                                                                                                                                                        15
Oxy’s Play Leading Delaware Basin Performance

                    Average 6 Month Cumulative Oil by Operator                                                                                                  •   Oxy’s Subsurface Knowledge, Data Analytics and
                  160
                                                                                                                                                                    Execution Drive Basin Leading Results
                  140
                                                                                                                                                                •   Top Delaware Basin Operator
                  120
                                                                                                                                                                     >   Highest 6 month cumulative oil production in the
                  100                                                                                                                                                    Delaware Basin
 Cumulative Mbo

                    80                                                                                                                                               >   Peers use 26% more proppant incurring
                    60                                                                                                                                                   incremental cost per well and increased
                                                                                                                                                                         parent/child risk
                    40

                    20
                                                                                                                                                                •   Performance Drives Value
                     0
                                                                                                                                                                     >   25% improvement to well productivity creates
                                                                                                                                      APC
                           OXY
                                 Peer 1
                                          Peer 2
                                                   Peer 3
                                                            Peer 4
                                                                     Peer 5
                                                                              Peer 6
                                                                                       Peer 7
                                                                                                Peer 8
                                                                                                         Peer 9
                                                                                                                  Peer 10
                                                                                                                            Peer 11

                                                                                                                                            Peer 13
                                                                                                                                                      Peer 14
                                                                                                                                                                         ~$2.4 MM NPV10 per well1
                                                                                                                                                                     >   Lower proppant loading results in >$500 M
                                                                                                                                                                         savings per well

                  Source: IHS Enerdeq as of 7/11/2019, horizontals >500ft with 6 months oil production available since January 2018.
                  1NPV calculations based on $55 WTI and $3.00 NYMEX, assumes 100% WI and 25% Royalty Burden, improvement calculated from average of peer data on chart.

                  Peers include: APC, COP, CXO, DVN, EOG, FANG, Mewbourne, MTDR, NBL, PDC, RDS, WPX, XEC, XOM.                                                                                                          16
Basin Leading
Improvement in                                                           Permian Resources Hz Unconventional Well Performance
Well Performance
                                                                      90 Day Cum Improvement                         180 Day Cum Improvement
• 4D Frac Modeling                                                 +220% from 2015 to 2019                          +147% from 2015 to 2018
                                                            250    +22% from 2018 to 2019                           +25% from 2017 to 2018
• Seismic and
  Geomechanical                                                                                                                           2018

  Characterization                                          200
                                                                                                                                           2017
                                                                                                            2019

                                          Cumulative Mboe
• Customized Section
                                                            150                                                                            2016
  Development

• Next Generation                                           100                                                                            2015
  Well Designs

• Tier 1 Investment                                          50
  Strategy
                                                              0
                                                                  0           30                 60            90         120       150         180
                                                                                                              Days                                    17
                      Note: Data includes all horizontal Permian unconventional wells online in each year
Measures of Success

    Milestones                                   2019

  Divest $10 - 15+ B    •   Advance close of Africa asset sale and Midland Basin JV
        assets          •   Continue to execute deleveraging strategy

                        •   Launch procurement and supply chain optimization
 Capture $2+ B annual
                        •   Capital and operation efficiencies
    cost synergies
                        •   Streamlined operations

    $1.5 B capital      •   $400 MM capital reduction from Africa asset sale
     reductions         •   Establish 2020 budget for reduced capital spend

                        •   Continuous focus on safety
  Seamless transition   •   Uninterrupted operations
                        •   Strong culture that emphasizes collaboration and results

                                                                                       18
Measures of Success
    Milestones                                   2020+
  Divest $10 - 15+ B   •   Complete non-core asset divestitures
        assets
                       •   SG&A optimization
Capture $2+ B annual
                       •   Merge Oxy’s distinctive operational expertise with differentiating APC
   cost synergies          practices for full synergy capture
                       •   Returns-based capital allocation process
    $1.5 B capital
                       •   Reduce activity and high-grade development program to result in 5%
     reductions            annual production growth
                       •   Continue sector leading dividend growth strategy
  Capital discipline   •   Commitment to deleveraging to align with historical credit metrics
                       •   Target 20+% CROCE
                       •   Utilize CCUS expertise to enhance Oxy’s business and reduce atmospheric
                           greenhouse gas
   Grow low carbon
                       •   Invest in technology and commercial projects to build new business
      business             opportunities within Oxy’s low carbon strategic pathways
                       •   Carbon neutral aspiration                                             19
Innovative and Sustainable Energy Leadership
 The New Oxy has greatly enhanced cash generating capability through commodity cycles

            Low Cost Portfolio                           Increasing Return of Capital
 Complementary and low risk portfolio             Cash flow growth provides increased
  providing stable cash flow                        shareholder distributions
 Large scale positions in areas of technical      Low risk to shareholder return through
  leadership                                        greater upside to oil price with low breakeven
 Integrated business provides low full cycle      Accelerated deleveraging through non-core
  cost                                              divestitures

   Returns Focused Capital Allocation                        Lower Carbon Future
 Decades of high return and short cycle           Leveraging CO2 Enhanced Oil Recovery
  project inventory                                 expertise
 Moderated growth provides high-graded            Providing the market with innovative low
  capital allocation                                carbon business solutions
 Value based development provides revenue         Economic and carbon impact through
  and cost synergies                                technology, projects, and technical services
                                                                                                   20
You can also read