INVESTOR PRESENTATION - 21 AUGUST 2019 REFINING NZ
←
→
Page content transcription
If your browser does not render page correctly, please read the page content below

REFINING NZ
       ANALYST PRESENTATION

  INVESTOR
PRESENTATION
  21 AUGUST 2019
REFINING NZ
                                                                                                                                                                                                               ANALYST PRESENTATION

DISCLAIMER
•   This presentation contains forward looking statements concerning the financial condition, results and operations of The New Zealand Refining Company Limited (hereafter referred to as “Refining
    NZ”).
•   Forward looking statements are subject to the risks and uncertainties associated with the refining environment, including price and foreign currency fluctuations, regulatory changes, environmental
    factors, production results, demand for Refining NZ’s products or services and other conditions. Forward looking statements are based on management’s current expectations and assumptions and
    involve known and unknown risks and uncertainties that could cause actual results, performance or events to differ materially from those expressed or implied in these statements.
•   Forward looking statements include among other things, statements concerning the potential exposure of Refining NZ to market risk and statements expressing management’s expectations, beliefs,
    estimates, forecasts, projections and assumptions. Forward looking statements are identified by the use of terms and phrases such as “anticipate”, “believe”, “could”, “estimate”, “expect”, “goals”,
    “intend”, “may”, “objectives”, “outlook”, “plan”, “probably”, “project”, “risks”, “seek”, “should”, “target”, “will” and similar terms and phrases.
•   Readers should not place undue reliance on forward looking statements. Forward looking statements should be read in conjunction with Refining NZ’s financial statements released with this
    presentation. This presentation is for information purposes only and does not constitute legal, financial, tax, financial product advice or investment advice or a recommendation to acquire Refining
    NZ’s securities, and has been prepared without taking into account the objectives, financial situation or needs of individuals. Before making an investment decision, you should consider the
    appropriateness of the information having regard to your own objectives, financial situation and needs and consult an NZX Firm or solicitor, accountant or other professional adviser if necessary.
•   In light of these risks, results could differ materially from those stated, implied or inferred from the forward looking statements contained in this announcement. Refining NZ does
    not guarantee future performance and past performance information is for illustrative purposes only. To the maximum extent permitted by law, the directors of Refining NZ,
    Refining NZ and any of its related bodies corporate and affiliates, and their offices, partners, employees, agents, associates and advisers do not make any representation or warranty, express or
    implied, as to accuracy, reliability or completeness of the information in this presentation, or likelihood of fulfilment of any forward-looking statement or any event or results expressed or implied in any
    forward-looking statement, and disclaim all responsibility and liability for these forward-looking statements (including, without limitation, liability for negligence).
•   Except as required by law or regulation (including the NZX Listing Rules), Refining NZ undertakes no obligation to provide any additional or updated information
    whether as a result of new information, future events or results or otherwise.
•   Forward looking figures in this presentation are unaudited and may include non-GAAP financial measures and information. Not all of the financial information (including any
    non-GAAP information) will have been prepared in accordance with, nor is it intended to comply with: (i) the financial or other reporting requirements of any regulatory body;
    or (ii) the accounting principles generally accepted in New Zealand or any other jurisdiction with IFRS. Some figures may be rounded and so actual calculation of the figures may differ from the
    figures in this presentation. Non-GAAP financial information does not have a standardised meaning prescribed by GAAP and therefore may not be comparable to similar financial information
    presented by other entities. Non-GAAP financial information in this presentation is not audited or reviewed.
•   Each forward looking statement speaks only as of the date of this announcement, 21 August 2019.

                                                                                                                                                                                                                                      2
REFINING NZ
                        ANALYST PRESENTATION

AGENDA

PERFORMANCE

LOOKING AHEAD

STRATEGIC INITIATIVES

STRATEGIC DIRECTION
REFINING NZ
                                                                              ANALYST PRESENTATION

AGENDA

PERFORMANCE             Excellent safety and operational performance

LOOKING AHEAD           Refinery margins weaker than expected

                        Strong contribution from distribution segment
STRATEGIC INITIATIVES
                        Positive free cash flow resulting in 2 cps dividend
STRATEGIC DIRECTION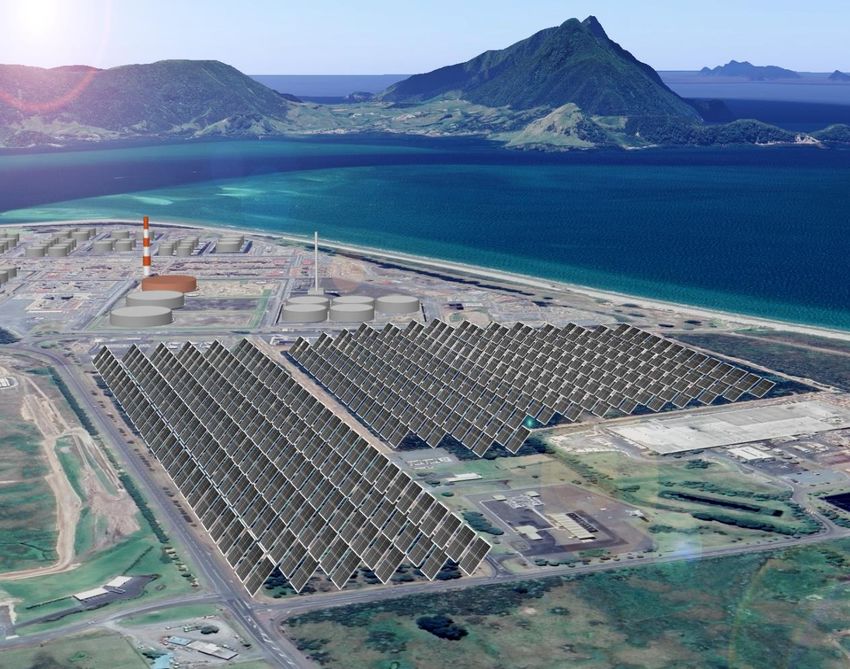
HIGHLIGHTS
                                                                                                                                                                           REFINING NZ
                                                    Excellent operational and safety performance                                                                    ANALYST PRESENTATION

                                                                                                                                                          HY 18           HY 19
                                                                          Personal             LTIF [1,2]                                                   0.47            0.14
                                                                                               Tier 1 (>US$25k) [2]                                               2               0
                                                                          Process
                                     EBITDA                                                    Tier 2 (>US$2.5k) [2]                                              2               0
  Gross Refining Margin

        5.31                               54
                                                                          Releases outside consent                                                                1               1
                            PER
  USD                       BARREL   NZD                M
  5.65 per barrel in HY18            NZD50m in HY18                       Throughput                                                         Mbbl           17.9            21.2
                                                                          RAP Throughput                                                     Mbbl           10.4            10.3
                                                                          Operational availability                                              %           83.3            99.9

                   $                                                      Singapore complex margin[4]                                    US$/bbl            3.23            0.20

                                                                          EBITDA [2]                                                       NZ$M             50.0            54.1
                                     TRCF [1,2]                           NPAT                                                             NZ$M             (2.8)           (3.5)
  Free Cash Flow [3]

        18.2                         0.27
                                                                          Exchange rate                                                US$/NZ$              0.73            0.67

  NZD                       M                                             1   Per 200,000 hours, rolling 12-month
  NZD(75)m in HY18                   0.75 in HY18                         2   For a full definition please refer to Glossary in Appendix I
                                                                              See our Interim Financial Statements for further detail, available at http://www.refiningnz.com/investor-centre.aspx
                                                                          3   Free cash flow calculated as operating cash flow minus actual capital expenditures
                                                                          4   For a definition, please see slide 8.

                                                                                                                                                                                              5
E TU TANGATA
                                                                                                                                     REFINING NZ
                                                     Delivers excellent safety performance                                      ANALYST PRESENTATION

                                                      Standing in the gap for the safety and wellbeing of our workmates:

                                                      • Hauora Hikoi and Korero – fostering a culture of safety

                                                      • Over 4,000 walks and talks delivered in 1H19

                                                      • High performing individuals recognised with safety and wellbeing award (Kaihautu)

                                                      • 10 months without an LTI; Lowest TRCF since 2011

                                                                                                                                                       6
Kaihautu award for safety and wellbeing leadership
EBITDA UP 8%
                                                                                                                                                                                                                          REFINING NZ
                                                                                 Fully imputed interim dividend of 2 cps                                                                                             ANALYST PRESENTATION

    (*) Includes terminalling and handling fees.
    (**) Includes Government inquiry, strategic review and site consent renewal
    The above chart excludes any movement in pass through costs such as natural gas, sulphur and carbon. See our Interim Financial Statements for further detail, available at http://www.refiningnz.com/investor-
    centre.aspx                                                                                                                                                                                                                             7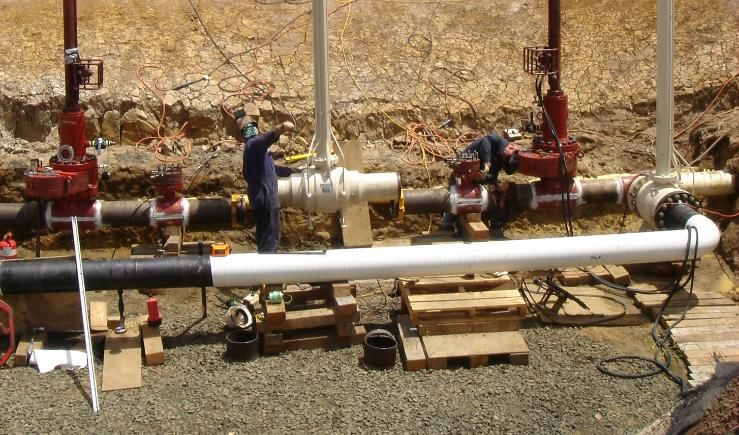
STRONG UPLIFT OVER LOW                                                                    Driven by optimised product make and strong operational
SINGAPORE MARGIN                                                                          uptime                                                                                                                                      REFINING NZ
                                                                                                                                                                                                                                 ANALYST PRESENTATION

                                                                                                                                                                                          UPLIFT                         HY 18      HY 19    Delta
                                                                                                                                                                                          US$/BARREL

                                                                                                                                                                                            Freight                       2.16      2.00     (0.16)

                                                                                                                                                                                            Product quality               0.95      0.65     (0.30)

                                                                                                                                                                                            Plant availability           (2.60)     (0.14)   2.46

                                                                                                                                                                                            Crude cost and yield          1.91      2.60     0.69

                                                                                                                                                                                            TOTAL                         2.42      5.11     2.69

           2014               2015                2016                2017               2018               2019                                   2018                2019
                                                                                                             H1                                     H1                  H1

                                                                                                                                                                                                                                                        8
* The Singapore Complex Margin is calculated using Platts Dubai crude and Singapore product prices, VLCC freight to Singapore, and the International Energy Agency’s Dubai complex refinery yields adjusted for fuel & loss.
BUSINESS SEGMENTS
                                                                                                                                                                 REFINING NZ
                                                               Investing in capability, reliability, cleaner fuels                                      ANALYST PRESENTATION

      1   Refer Glossary (Appendix I)

                  1961             1962           1964                        1986                                 2005           2009                  2015
                  RNZ              Construction   First fuel                  Hydrocracker                         Future Fuels   Point Forward         Te Mahi Hou
                  Established      begins         produced                    installed                            project        project               project (CCR)

                                                               1982         1985                   2000                                                            2017
                                                               Wiri oil     RAP                    Wellsford IPS                                                   RAP capacity
                                                               terminal,    commissioned                                                                           upgrade
                                                               RAP approved                                                                                        (Phases I & II)

                                                                                             1999           2002                                  2014
                                                                                             IPL            Other oil                             New Plymouth
                                                                                             established    companies                             laboratory
                                                                                             BP customer.   customers                             established

                                OUR FUTURE IS IN SUPPORTING NZ’s TRANSITION TO A LOWER CARBON FUTURE                                                                             9
REFINING
                                                                                                                                                                                                         REFINING NZ
                                                                                      Cyclical, but good cash flows over the longer term                                                            ANALYST PRESENTATION

REFINING REVENUE AND EBITDA
                                                                                                           Processing fee based on gross refining margin
NZ$000
                                          EBITDA       Revenue                                             and linked to USD exchange rate
700,000

600,000                                                                                                    Despite cyclical historical results, strong cash flow allowing funding of
500,000                                                                                                    significant capital projects and dividends
400,000
                                                                                                           Favourable supply and demand outlook over medium term
300,000

200,000
                                                                                                           Expected net benefit from MARPOL
100,000

     0
      2005   2006   2007   2008   2009   2010   2011    2012     2013   2014   2015   2016   2017   2018
                                                                                                           Potential upside from regional refinery closures and refinery outages

                                                                                                           Core competitive advantages are location and high reliability

                                                                                                           1   Refer Glossary (Appendix I)
                                                                                                           2   Free cash flow calculated as operating cash flow minus actual capital expenditures
                                                                                                                                                                                                                       10
DISTRIBUTION
REFINING NZ
Stable and growing returns expected ANALYST PRESENTATION
DISTRIBUTION REVENUE AND EBITDA
NZ$000
Multi-product pipeline supplying Auckland
EBITDA Revenue
60,000
Transports 52% of refinery’s production and 37% of NZ’s fuels demand
50,000
40,000 We have invested to meet significant volume growth over the last 5
years
30,000
20,000
Drag reducing agent (DRA) to be trialled in 2H 2019
10,000 15% additional capacity increase possible from DRA, subject to a
0
successful trial
2005 2006 2007 2008 2009 2010 2011 2012 2013 2014 2015 2016 2017 2018
Positioning the main line valve at Kumeu Pump Station 1 Refer Glossary (Appendix I)
2 Free cash flow calculated as operating cash flow minus actual capital expenditures
11LABORATORY
REFINING NZ
Growing revenue beyond the refinery ANALYST PRESENTATION
IPL REVENUE AND EBITDA
Specialist fuels, biofuels and other lab testing services
NZ$000
EBITDA RNZ Revenue Other Revenue
10,000
Established in 1999, and fully owned by Refining NZ since 2016
8,000
Services provided to leading oil companies, governmental agencies
6,000 and international terminals
4,000 Employs ~45 staff in two labs (Marsden Point, New Plymouth)
2,000 Strong growth in the last decade
0
2005 2006 2007 2008 2009 2010 2011 2012 2013 2014 2015 2016 2017 2018 EBITDA and Revenue CAGR1 of 6% since 2005
1 Refer Glossary (Appendix I)
2 Free cash flow calculated as operating cash flow minus actual capital expenditures
12REFINING NZ
ANALYST PRESENTATION
Asian demand growth is expected to outstrip refining
capacity additions (until at least 2029)
PERFORMANCE
FGE expects:
LOOKING AHEAD
– Mogas margins to improve in 2020 (caveat: Chinese
exports and a global slowdown)
STRATEGIC INITIATIVES
– Jet and diesel margins to strengthen further in Q4 2019
STRATEGIC DIRECTION
– High sulphur fuel oil margins likely to fall sharply in
Q4 2019, with a gradual recovery from Q2 2020
RNZ therefore expects a net margin benefit from IMO
market disruptionGASOLINE
REFINING NZ
Market finely balanced ANALYST PRESENTATION
Singapore Light Distillate Inventories (mmb)
Weaker gasoline margins in 1H19: High stocks, reduced
18
17 demand and Chinese exports
16
15
14
FGE OUTLOOK:
13
12
11 • 2019 global gasoline demand growth > supply growth
10
9
8
• Weaker US summer gasoline demand in 2H19. Margins
may reduce before support from IMO2020 effects
2013-2017 5-Year Average 2018 2019
• Higher Chinese exports and a global slowdown may limit
300 Gasoline S/D Balance (y-o-y change) the IMO2020 gasoline upside in 2020
250
200
150
100
kb/d
50
0
-50
-100
-150 Source:
-200
FGE is an independent global energy consultancy that provides research,
2019 2020
Demand Supply Balance analysis and advisory services on the up- and downstream oil and gas markets.
14JET FUEL AND DIESEL
REFINING NZ
RNZ expects to benefit from IMO2020 ANALYST PRESENTATION
Middle Distillates S/D Balance (y-o-y Change)
1,500
FGE OUTLOOK:
1,300
• Global middle distillate demand to outstrip supply growth
1,100
• Middle distillate margins strengthening as low sulphur stocks
build ahead of IMO2020
900
kb/d
700
500
300
100
-100
-300
2019 2020
Source:
Demand Supply Balance
FGE is an independent global energy consultancy that provides research,
analysis and advisory services on the up- and downstream oil and gas markets.
15HIGH SULPHUR FUEL OIL
REFINING NZ
IMO2020 impacts but expect recovery ANALYST PRESENTATION
Fuel Oil S/D Balance (y-o-y change)
750 FGE OUTLOOK:
250 • High sulphur fuel oil margins buoyed by: Middle East power
kb/d
demand, residue upgrade projects, sanctions, lighter global
-250 crude slate
-750
• Low sulphur fuel oil stocks building ahead of IMO2020 support
margins
-1,250
2019 2020 • Expect high sulphur fuel oil margin recovery from Q2 2020
Demand Supply Balance
Singapore 380cst HSFO Cracks vs Dubai (US$/bbl)
6
1
-4
-9
-14
-19
-24
-29 Source:
FGE is an independent global energy consultancy that provides research,
analysis and advisory services on the up- and downstream oil and gas markets.
16ASIA REFINING CAPACITY ADDITIONS Forecasts support refinery utilisation and margins
LAG DEMAND GROWTH (with IMO2020 and Chinese export caveats) REFINING NZ
ANALYST PRESENTATION
Incremental CDU Capacity vs Demand Growth
1,200 87%
1,000 86%
85%
800
84%
600
Kb/cd
83%
400
82%
200
81%
0
80%
-200
79%
-400 78%
-600 77%
Incremental CDU Capacity Incremental Refinery Product Demand Implied Refinery Utilization (%)
Source:
FGE is an independent global energy consultancy that provides research,
analysis and advisory services on the up- and downstream oil and gas markets.
17SINGAPORE PRODUCT MARGIN OUTLOOK
REFINING NZ
Forecast supportive of RNZ’s GRM ANALYST PRESENTATION
Selected Product Cracks (Singapore) vs Dubai
25 (US$/bbl) FGE OUTLOOK:
20 • Gasoline margin is expected to improve but then pressured at end
of the decade by higher engine efficiency and eventually by electric
15
vehicles
10
• IMO2020 supports diesel margins
US$/bbl
5
0 • High Sulphur fuel oil margins recover quickly from a sharp fall with
increasing scrubber installations on ships
-5
-10
-15
-20
-25
Mogas (92 RONC) Diesel, 10 ppm S HSFO (380 cSt)
Source:
FGE is an independent global energy consultancy that provides research,
analysis and advisory services on the up- and downstream oil and gas markets.
18NZ JET FUEL DEMAND
REFINING NZ
Strong growth projected ANALYST PRESENTATION
Million Litres Jet Fuel New Zealand Demand
3,500
Demand projection aligned with Auckland Airport outlook
3,000
2,500 Refinery to Auckland Pipeline – key asset to meet growing
2,000 Auckland demand
1,500
RNZ continues to invest in capacity to meet demand
1,000
500
0
2010 2015 2020 2025
Actual High Growth Low growth
Demand outlook based on 2019 Hale &Twomey high/low growth projections 192019 PROFIT MATRIX REMAINS
UNCHANGED REFINING NZ
ANALYST PRESENTATION
2H 2019 EXPECTATIONS
• Strong throughputs
• Capital spend on budget
• Opex managed
LONGER TERM
• Baseline opex of $180m in 2020 (excluding
inflation) or $182-185m with strategic
initiatives
Pass through costs include natural gas, sulphur and carbon
One-offs include Government inquiry, Strategic Review and Resource Consent 20LONG TERM SUSTAIN CAPITAL
FUNDING PLAN Capital spend under control REFINING NZ
ANALYST PRESENTATION
Asset management process
Next 3 years: Expected higher
• Phase I of long term strategic asset than average due to tank
management plan nearing completion programme, mandatory first
inspection of Te Mahi Hou project
and catalyst replacement
• Alignment to ISO 55001:2014
• Long term reduction in capital spend to
below depreciation achieved
Funding plan highlights
• Overall spend driven by shutdown cycles
• Tank maintenance reducing from 2023
The above chart excludes growth projects such as, Dredging and Maranga Ra, where the investment decision will be economically 21
justified, with alternative financing explored.REFINING NZ
ANALYST PRESENTATION
AGENDA
PERFORMANCE Sulphur project well into construction
LOOKING AHEAD Short payback projects are delivering
Dredging optimisation continues
STRATEGIC INITIATIVES
“Maranga Ra” solar farm – final investment
STRATEGIC DIRECTION decision expected in Q4 2019DELIVERING VALUE
REFINING NZ
Strengthens our capability to make cleaner fuels ANALYST PRESENTATION
SULPHUR FORMING
Facility under construction
Commissioning Q4 2019 Roof being installed on Plant Building Equipment in Plant Building
Silo upper section coating completed Silo support structure being assembled
23FILLING THE FUNNEL
REFINING NZ
Objective of pursuing attractive, short payback projects ANALYST PRESENTATION
IDEAS INITIATIVES IN PROGRESS
GRM uplift
2019 2020 2021 (US cents
Steam system optimisation Q4 Q1 Q2 Q3 Q4 Q1 Q2 Q3 Q4 per barrel)
Export fuel oil infrastructure RAP automation (Phase II) 0.5
Bitumen modernisation RAP DRA trial TBA
Water recycling
Crude demulsifier pre-dosing 1
BRU de-bottlenecking
Light naphtha bypass 3
Octane optimisation
Diesel cold-flow improver
CCR operational flexibility 2
Naphtha optimisation
Hydrogen optimisation 1
Bitumen production capacity TBA
Jet fuel tank conversion
24DREDGING
REFINING NZ
Optimisation continues ANALYST PRESENTATION
Estimated cost $45m–55m (no tank) vs previous
$60m–70m
Economics remain attractive
Project optimisation discussions continue with
customers
Reviewing phasing of tank maintenance to accelerate
Current
GRM dredging and avoid cost of new tank
Final investment decision expected to be taken Q4
GRM 2019/Q1 2020
uplift
PRODUCT / CRUDE
FREIGHT
COST
PRODUCT CRUDE OIL CRUDE OIL
VALUATION CURRENT POST
VALUATION DREDGING
VALUATION
25MARANGA RA – “RISING SUN”
REFINING NZ
26MW solar farm – New Zealand’s largest ANALYST PRESENTATION
Located on land adjacent to the refinery – a 31ha
Estimated cost of ~$36m – 39m [1]
Supply ~10% of refinery’s consumption
Attractive infrastructure returns
Expected cost savings of $3 – $4 million p.a.
Final Investment Decision expected by end of
2019 – construction in 2020
[1] Funded via a combination of non-recourse project debt funding and equity
of $12m – $15m from the Company
26
Illustrative onlyREFINING NZ
ANALYST PRESENTATION
AGENDA
Delivering now – Preparing for the future
PERFORMANCE
Sustainability – contributing to a lower emissions economy
LOOKING AHEAD – Investment in emissions reduction
STRATEGIC INITIATIVES – Ready and willing to invest further
STRATEGIC DIRECTION Community – programme of pro-active engagement
– Charitable donations
– Promoting solar
– Digital learning
Regulatory updateSUSTAINABILITY
REFINING NZ
Contributing to a lower emissions economy ANALYST PRESENTATION
Track record of investment in emissions reduction
• 20% reduction in carbon intensity since 2008
• Investment in cleaner fuels – 24,000 tonnes p.a. sulphur removed from fuels
since 2005
Ready and willing to invest further
• Pipeline of energy saving initiatives already identified
Te Mahi Hou (CCR) has reduced CO2 emissions by 120,000 tonnes pa
• Energy conservation partnership with EECA
• Expect further efficiencies
Energy Manager keeps a close eye on energy intensity of the process units 28COMMUNITY
REFINING NZ
Programme of pro-active engagement ANALYST PRESENTATION
Charitable contributions match safety milestones
• Food for Life (healthy lunches to low decile schools)
• Tai Tokerau Emergency Housing Charitable Trust
Promoting solar in the community
• Solar installed at local marae, kohanga reo
TRC-free quarter celebrated by community donation
• Consulting widely on solar hydrogen plans
Supporting digital learning
• Online tutorials across 22 Northland schools hosted by Bream Bay College
Solar installed at local marae
29REGULATORY UPDATE
Proactive engagement REFINING NZ
ANALYST PRESENTATION
NZ ETS – post Negotiated Greenhouse Agreement
2022
Site resource consents’ renewal – expiry 2022
Government inquiries:
• Pipeline outage and resilience
• Market fuel study – ComCom
30REFINING NZ
ANALYST PRESENTATION
APPENDIX 1
Glossary
• LTIF – Lost time injury frequency (rolling 12 month per 200,000 hours)
• TRCF – Total recordable case frequency (rolling 12 month per 200,000 hours)
• Tier 1 Process Safety Event (API 754) – A tier 1 Process Safety Event (PSE) is an unplanned or uncontrolled release of any material, including non-
toxic and non-flammable, from a process which results in one or more of the following: A LTI and/or fatality; A fire or explosion resulting in greater
than or equal to $25,000 of direct cost to the company; A release of material greater than the threshold quantities given in Table 1 of API 754 in any
one-hour period; A officially declared community evacuation or community shelter-in-place.
• Tier 2 Process Safety Event (API 754) – A tier 2 Process Safety Event (PSE) is an unplanned or uncontrolled release of any material, including non-
toxic and non-flammable, from a process which results in one or more of the following: A recordable injury; A fire or explosion resulting in greater
than or equal to $2,500 of direct cost to the company; A release of material greater than the threshold quantities given in Table 2 of API 754 in any
one-hour period.
• EBITDA – Net Profit Before Finance Costs and added back Depreciation and disposal costs
• CAGR – compound annual growth rate
31REFINING NZ
ANALYST PRESENTATION
INVESTOR
PRESENTATION
21 AUGUST 2019You can also read