2019 BMO Global Metals & Mining Conference - Hollywood, Florida, USA Mick Wilkes President & CEO - OceanaGold
←
→
Page content transcription
If your browser does not render page correctly, please read the page content below
2019 BMO Global Metals
& Mining Conference
Hollywood, Florida, USA

Mick Wilkes
President & CEO
February 26 2019
CONSISTENTLY DELIVERING ON COMMITMENTS

INNOVATION I PERFORMANCE I GROWTH
2
Cautionary and Technical Statements
Cautionary Notes - Information Purposes Only
The information contained in this presentation is provided by OceanaGold Corporation (“OGC”) for informational purposes only and does not constitute an offer to issue or arrange to issue, or the solicitation of an offer to issue, securities of OGC or
other financial products. The information contained herein is not investment or financial product advice and has been prepared without taking into account the investment objectives, financial situation or particular needs of any particular
person. The views, opinions and advice provided in this presentation reflect those of the individual presenters only. No representation or warranty, express or implied, is made as to the fairness, accuracy, completeness or correctness of the
information, opinions and conclusion contained in this presentation. To the maximum extent permitted by law, none of OGC or any of its directors, officers, employees or agents accepts any liability, including, without limitation, any liability arising
out of fault or negligence, for any loss arising from the use of the information contained in this presentation. Furthermore, this presentation does not constitute an offer of shares for sale in the United States or to any person that is, or is acting for
the account or benefit of, any U.S. person (as defined in Regulation S under the United States Securities Act of 1933, as amended (the "Securities Act")) ("U.S. Person"), or in any other jurisdiction in which such an offer would be illegal. OGC’s shares
have not been and will not be registered under the Securities Act.

Cautionary Statement Concerning Forward Looking Information
Certain information contained in this presentation may be deemed “forward-looking” within the meaning of applicable securities laws. Forward-looking statements and information relate to future performance and reflect OGC’s expectations
regarding the generation of free cash flow, execution of business strategy, future growth, future production, estimated costs, results of operations, business prospects and opportunities of OGC and its related subsidiaries. Any statements that
express or involve discussions with respect to predictions, expectations, beliefs, plans, projections, objectives, assumptions or future events or performance (often, but not always, using words or phrases such as “expects” or “does not expect”, “is
expected”, “anticipates” or “does not anticipate”, “plans”, “estimates” or “intends”, or stating that certain actions, events or results “may”, “could”, “would”, “might” or “will” be taken, occur or be achieved) are not statements of historical fact and
may be forward-looking statements. Forward-looking statements are subject to a variety of risks and uncertainties which could cause actual events or results to differ materially from those expressed in the forward-looking statements and
information. They include, among others, the accuracy of mineral reserve and resource estimates and related assumptions, inherent operating risks, and those risk factors identified in OGC’s most recent annual information forms prepared and filed
with securities regulators which are available on SEDAR at www.sedar.com under OGC’s name.
There are no assurances OGC can fulfil forward-looking statements and information. Such forward-looking statements and information are only predictions based on current information available to management of OGC as of the date that such
predictions are made; actual events or results may differ materially as a result of risks facing OGC, some of which are beyond OGC’s control. Although OGC believes that any forward-looking statements and information contained in this presentation
are based on reasonable assumptions, readers cannot be assured that actual outcomes or results will be consistent with such statements. Accordingly, readers should not place undue reliance on forward-looking statements and information. OGC
expressly disclaims any intention or obligation to update or revise any forward-looking statements and information, whether as a result of new information, events or otherwise, except as required by applicable securities laws. The information
contained in this release is not investment or financial product advice.

Technical Disclosure
Mineral Resources for Macraes have been verified and approved by, or are based upon information prepared by or under the supervision of S. Doyle; that relating to Waihi by P. Church; that relating to Didipio by J. G. Moore; and that relating to
Macraes by P. Doelman for open pit and T. Maton for the underground. Mineral Reserves for Macraes have been verified and approved by, or are based upon information prepared by, or under the supervision of, P. Doelman for open pit and T.
Maton for the underground; for that relating to Waihi by T. Maton for open pit and D. Townsend for underground; and that relating to Didipio by C. Fawcett. The Mineral Reserves and Resources for the Haile Gold Mine have been verified and
approved by, or are based upon information prepared by or under the supervision of B. van Brunt.
Information relating to Macraes exploration results in this presentation has been verified by, is based on and fairly represents information compiled by or prepared under the supervision of Hamish Blakemore; information relating to Waihi
exploration results by Lorrance Torckler; information relating to Didipio exploration results by Jonathan Moore; and information relating to Haile exploration results by John Jory.
 P. Church, P. Doelman, S. Doyle, J. Jory, J. G. Moore, and T. Maton and are Members and Chartered professionals with the Australasian Institute of Mining and Metallurgy while Hamish Blakemore is a member of the Australian Institute of
Geoscientists (AIG). Messrs Blakemore, Church, Doelman, Doyle, Jory, Moore, and Maton are employees of OceanaGold, and have sufficient experience, which is relevant to the style of mineralisation and type of deposits under consideration, and
to the activities which they are undertaking, to qualify as Competent Persons as defined in the 2012 Edition of the “Australasian Code for Reporting of Exploration Results, Mineral Resources and Ore Reserves” (“JORC Code”) and all are Qualified
Persons for the purposes of the NI 43 101. Messrs Blakemore, Church, Doelman, Doyle, Jory, Moore, and Maton consent to the inclusion in this public presentation of the matters based on their information in the form and context in which it
appears.
For further scientific and technical information (including disclosure regarding mineral resources and mineral reserves) relating the Macraes Operation, the Didipio Operation, the Waihi Gold Operation and the Haile Gold Mine Project, please refer
to the NI 43-101 compliant technical reports available at sedar.com under the Company’s name.

General Presentation Notes
All AISC and cash costs are net of by-product credits unless otherwise stated
All financials are denominated in US Dollars unless otherwise stated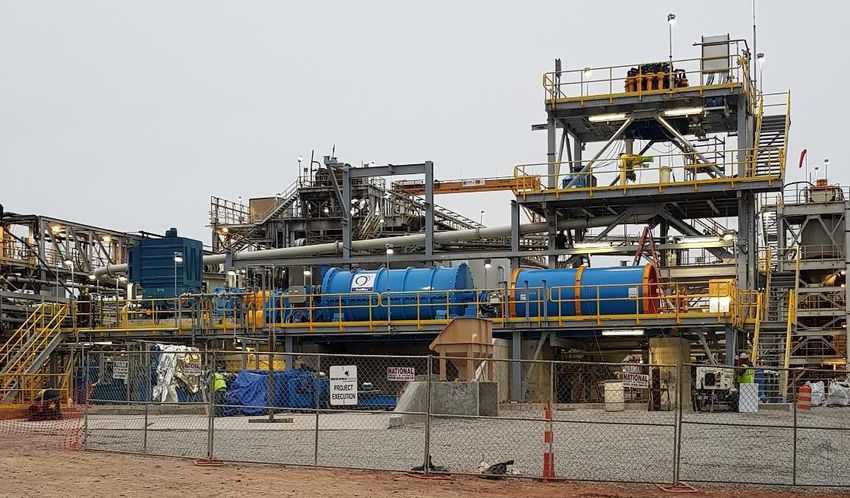
3
                   2018 Operational & Financial Results
     OPERATING RESULTS                                                                                                     ACHIEVED PRODUCTION & COST GUIDANCE
                                                        Q4 2018                           2018                                   7TH CONSECUTIVE YEAR

     GOLD PRODUCTION                                   126,656                        533,286                oz

     GOLD SALES                                        132,161                        532,716                oz

     COPPER PRODUCTION                                    2,881                         14,999               tonnes
                                                                                                                                $121M IN FREE CASH FLOW
     COPPER SALES                                         3,124                         14,527               tonnes                        2018

     AISC                                                  $814                           $767               per oz sold

     FINANCIAL RESULTS

                                                        Q4 2018                           2018                                 RECORD ANNUAL REVENUE
                                                                                                                                    $773 MILLION IN 2018
     REVENUE                                               $183                          $773                million

     EBITDA                                                 $74                          $364                million

     ADJUSTED NET PROFIT(1)                                 $17                          $124                million

     ADJUSTED(1) EPS (fully diluted)                      $0.03                          $0.20
                                                                                                                            STRENGTHENING BALANCE SHEET
     ADJUSTED(2) CFPS (fully diluted)                     $0.12                          $0.56
1.   Based on earnings after income tax and before gain/loss on undesignated hedges and impairment charges
2.   Cash flow from operations before working capital movements
4
Balance Sheet Overview (as at 31 Dec 2018)
                                               Year-on-Year           Year-on-Year

                     CASH BALANCE
                                             CASH BALANCE            NET DEBT
                     $108m
   Total Liquidity   Excludes cash held in
                     marketable securities
                                                      47%                    59%
       $158m
                     Credit Facility
                     (Undrawn)
                     $50m                      NET DEBT           NET DEBT/EBITDA

                                               $69 million              0.19

                     Credit Facility
                     (Drawn)                 DISCRETIONARY DEBT REPAYMENTS IN 2018
                     $150m
     Total Debt
       $176m

                     Equipment Leases
                     $26m                    FIRST DIVIDEND OF 2019 APPROVED BY THE
                                                             BOARD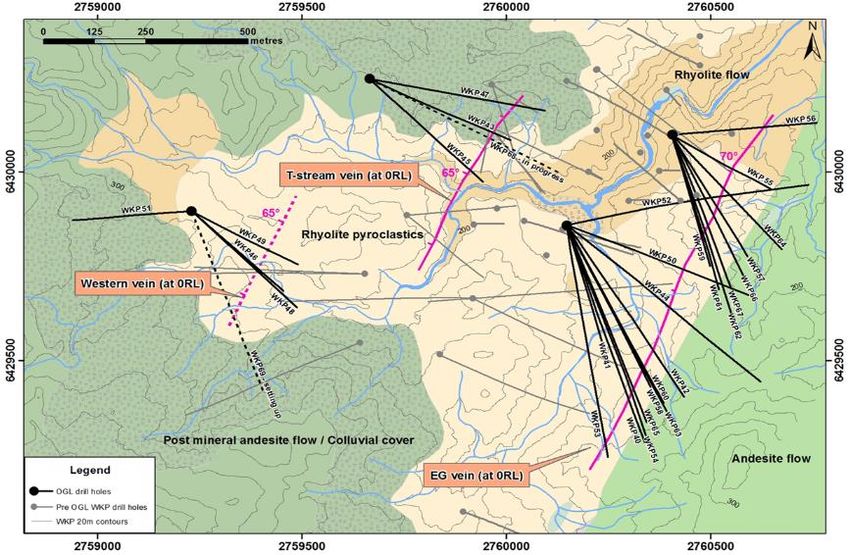
5
                  Consistent Solid Margins & Returns
                                                 35 CONSECUTIVE QUARTERS OF DELIVERING A POSITIVE ROIC

                                         EBITDA MARGIN*                                                 RETURN ON INVESTED CAPITAL*

                                                     Peer Average                                                      Peer Average
         60%                                                                               20%

         50%
                                                                                           15%

         40%

                                                                                           10%
         30%

         20%
                                                                                           5%

         10%
                                                                                           0%
          0%

        -10%                                                                               -5%
                  2011        2012       2013        2014      2015   2016   2017   2018         2011    2012   2013   2014     2015   2016   2017   2018

*Source: Bloomberg. 2018 data based on Company estimates
6
Strategy

   DRIVE EFFICIENCY THROUGH                BOOST PERFORMANCE via NEW
   TECHNICAL EXCELLENCE &                   TECHNOLOGIES (e.g. Analytics,
   LEADERSHIP                                               Automation)

                               OCEANAGOLD
                              VALUE CREATION

                                        REDUCE BUSINESS RISK THROUGH
   ADVANCE ORGANIC GROWTH                        GEOGRAPHIC & ASSET
   OPPORTUNITIES                                      DIVERSIFICATION

                        EFFECTIVE MANAGEMENT &
  HIGH QUALITY ASSETS                               ROBUST BALANCE SHEET
                             ORGANISATION
7
Playing to Our Strengths
✅   TOP 3 RANKED ESG PERFORMANCE GLOBALLY AMONGST GOLD MINERS
            MCSI ESG RATINGS

✅   STRONG BALANCE SHEET WITH PROVEN TRACK RECORD OF PROFITABILITY

✅   CONSISTENT TRACK RECORD OF DELIVERING VALUE TO SHAREHOLDERS

✅   STRONG FREE CASH FLOW GENERATION & EBITDA MARGINS

✅   CONSISTENT, SOLID RETURNS ON INVESTED CAPITAL

✅   SIGNIFICANT PIPELINE OF ORGANIC GROWTH OPPORTUNITIES

                               DECISIONS FOR THE    COUNTER CYCLICAL
    FOCUSED ON MARGINS
                                  LONG-TERM            INVESTING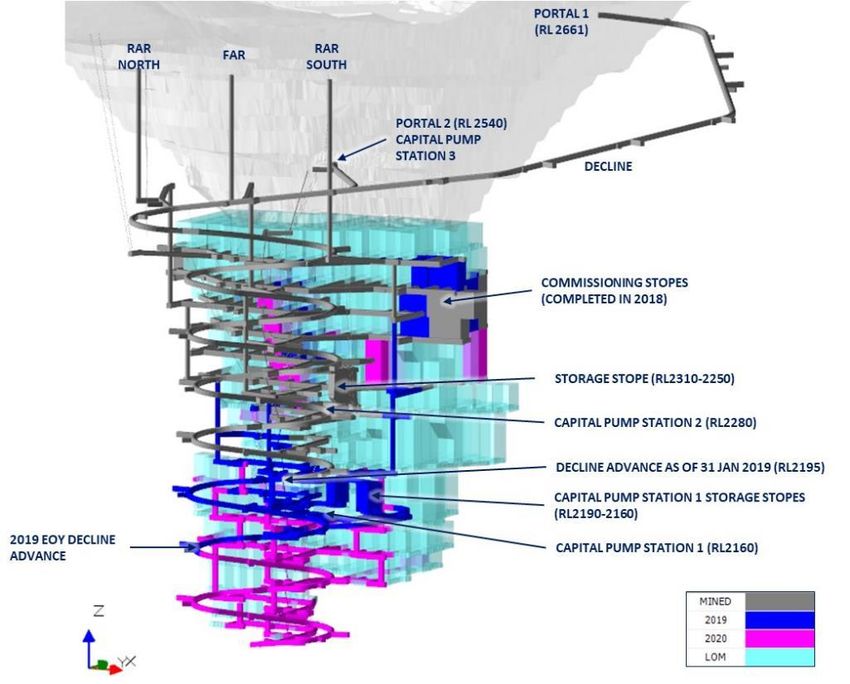
8
                                        Creating Value and Real Growth
                                                  PRODUCTION GROWTH
                                                 Macraes         Reefton       Didipio      Waihi       Haile
                                                                                                                              EBITDA GROWTH
                            700,000                                                                                           2018                                            per share
                                                                                                                                                                    $364M
                                               per share
                            600,000                                                                                                                                              20%
                                                    10%                                                                       2012
                                                                                                                                     $145M                                  (2012 to 2018)
                            500,000
                                           (2012 to 2018)
     Gold Production (oz)

                            400,000

                                                                                                                              EARNINGS GROWTH
                            300,000

                                                                                                                              2018                                            per share
                                                                                                                                                              $0.20/sh
                            200,000

                                                                                                                              2012
                                                                                                                                                                              192%
                            100,000                                                                                            $0.07/sh                                     (2012 to 2018)

                                 0
                                 2012       2013              2014              2015                 2016       2017   2018
                                                                                                                                              GOLD
                                                                                                                                              PRICE                 24%
1.                Reefton entered Closure in December 2016                                                                                   (2012 to 2018)
2.                Per share is based on the fully diluted shares outstanding
3.                EPS adjusted = Earnings after tax before gains/losses on undesignated hedges and
                  impairments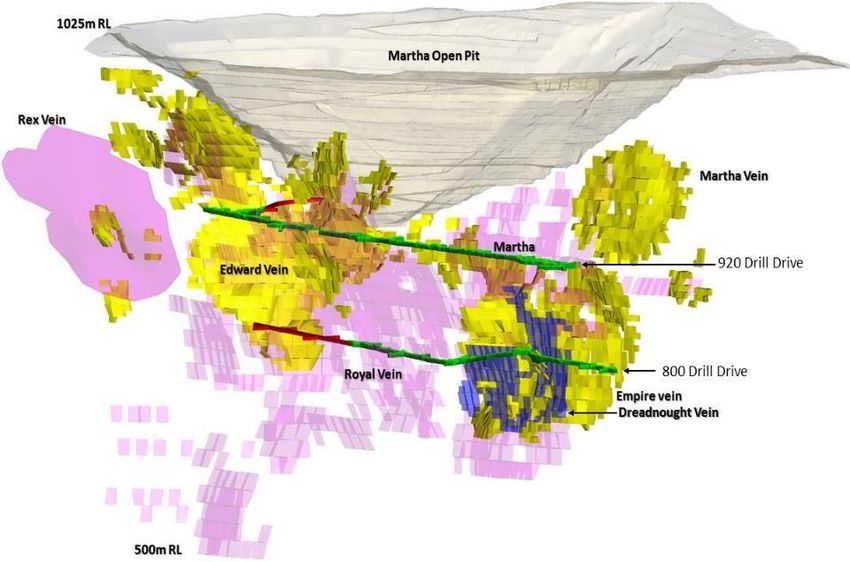
9
      Organic Growth Plan Progressing Well
             VALUE CREATING ORGANIC GROWTH INITIATIVES ARE FALLING INTO PLACE

MARTHA UNDERGROUND PROJECT           WKP (NEW ZEALAND)                HAILE EXPANSION

      PERMIT RECEIVED;               INITIAL RESOURCE           PLANT EXPANSION ADVANCING
   IMPLEMENTING PROJECT                 ANNOUNCED                         WELL

   EXTENSIVE EXPLORATION          INCREASED EXPLORATION         PERMITTING LARGER PITS &
         ONGOING                         BUDGET                HORSESHOE UG PROGRESSING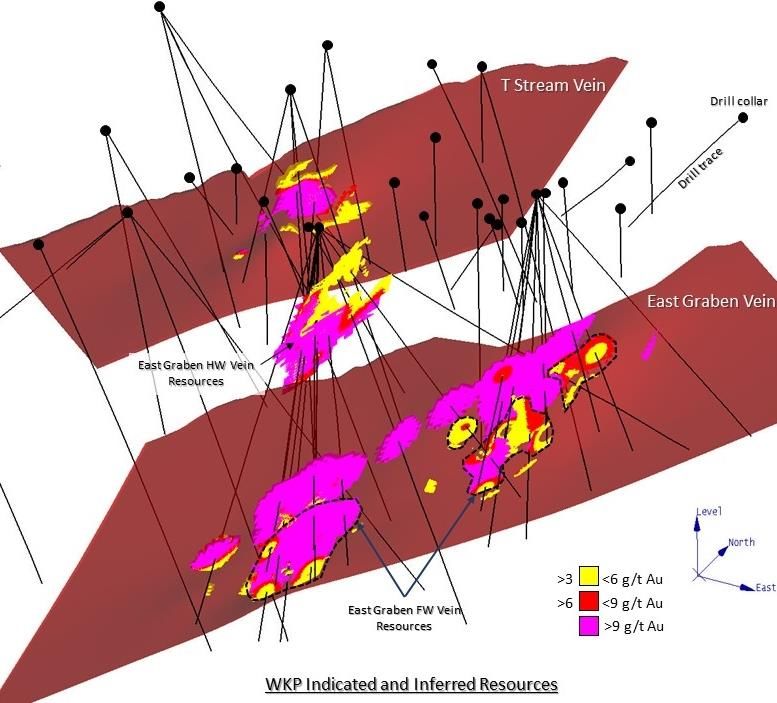
10
                           Martha Underground Project
     RECEIVED PERMITS FOR THE MARTHA UNDERGROUND PROJECT; IMPLEMENTATION UNDERWAY
                                                                                                                                                                                                                                                                                                 (1)
                                                                                                                                                                                                                                          MARTHA U/G RESOURCE GROWTH
                                                                                                                                                                                                                                                             M&I Resource    Inferred Resource

                                                                                                                                                                                                              400

                                                                                                                                                                                                              300

                                                                                                                                                                                                              200

                                                                                                                                                                                                              100

                                                                                                                                                                                                                  0
                                                                                                                                                                                                                                           2016                             2017                 2018

                                                                                                                                                                                                                                                              Martha Underground
                                                                                                                                                                                                                                                 EXPLORATION TARGET(2)

                                                                                                                                                                                                                                                                               50%
1.   Underground resources are reported below the consented Martha Phase 4 open pit design within conceptual underground mining shapes and at a gold price of NZD$2,083/oz. Provision has been made for dilution and mining recoveries. The
     tabulated resources are estimates of metal contained as troy ounces of gold and do not include allowances for processing. All figures are rounded to reflect the relative accuracy and confidence of the estimates and totals may not add correctly.
     There is no certainty that Mineral Resources that are not Mineral Reserves will be converted to Mineral Reserves
2.   Exploration Target is outlined as a potential volume of between 5 million and 8 million tonnes at a grade of between 4.0 g/t and 6.0 g/t gold, inclusive of reported Indicated and Inferred Mineral Resources. Insufficient exploration work has been
     conducted to date to define a mineral resource of this magnitude and it is uncertain if further exploration will result in the delineation of additional mineral resources. The exploration target is conceptual in nature and is based on the
     assessment of surface and underground drilling data collected by the Company as well as historical and archived geological and mining data from over a century of mining activity at Waihi.. Refer to OceanaGold news release dated 9 August
     2018 for additional information.
11
Initial Resource at WKP (WHAREKIRAUPONGA)
NEWLY DISCOVERED HIGH-GRADE MINERALISATION IN NEW ZEALAND
INDICATED RESOURCE(1) INFERRED RESOURCE(1)
Dome Field GOLD: 234,000 oz GOLD: 401,000 oz
North
SILVER: 296,000 oz Silver: 568,000 oz
Dome Field ▪ 0.41 Mt @ 18.0 g/t Au ▪ 1.05Mt @ 11.9 g/t Au
South
▪ 0.41 Mt @ 22.7 g/t Ag ▪ 1.05Mt @ 16.8 g/t Ag
Ohui
RECENT SIGNIFICANT INTERCEPTS FROM
Twin Hills EAST GRABEN VEIN(1)
White Bluffs
▪ 8.7 metres @ 24.5 g/t gold, 32.0 g/t silver
Glamorgan
▪ 5.0 metres @ 39.0 g/t gold, 76.6 g/t silver
Hauraki (WKP)
Golden Cross
▪ 10.2 metres @ 19.2 g/t gold, 20.0 g/t silver
Waihi North ▪ 9.0 metres @ 21.2 g/t gold, 24.4 g/t silver
Karangahake
WAIHI ▪ 3.6 metres @ 35.8 g/t gold, 43.3 g/t silver
1. Refer to OceanaGold news releases dated 25 Feb 2019, 12 Feb 2019 & 9 July 201812
WKP Oblique & Cross Section
East Graben Vein Long section
open
open
open
open
CURRENT EAST GRABEN VEIN PARAMETRES(1)
▪ Avg. width: 5 metres (1)
▪ Avg. grade: 16.0 g/t Au(1)
▪ Strike: 1,000m & open in both directions
▪ Vertical: 200m, open 100-200m up-dip
1. Average width and grade of the East Graben vein target have been calculated based on all intercepts to date (20) in the preferred
undifferentiated rhyolite host(refer to OceanaGold news release dated 25 Feb 2019).13
WKP Exploration
DRILLING FOCUSSED ON EAST GRABEN VEIN – SIGNIFICANT UPSIDE
T STREAM VEIN
Veins open in multiple
directions
EAST GRABEN VEIN
WESTERN VEIN14
Haile Plant Expansion
HAILE PLANT EXPANSION PROJECT CONTINUES TO YIELD POSITIVE RESULTS
HAILE PLANT EXPANSION PROFILE(1)
Actual Throughput Estimated Throughput Actual Production Estimated Production
5.0 250
TARGET EXPANSION THROUGHPUT
BETWEEN 3.5 – 4.0 MTPA
4.5
4.0 200
3.5
Annual Throughput (Mtpa)
Gold Production (koz)
3.0 150
INCREASE PLANT CAPACITY & ENHANCE PLANT
2.5
PERFORMANCE
2.0 100
✅ INSTALL PEBBLE CRUSHER 1.5
1.0 50
✅
0.5
INSTALL TOWER MILL
0.0 0
2017A 2018A 2019E 2020E 2021E 2022E
H1
2019
INSTALL ISAMILL 1. Refer to Haile 43-101 Technical Report located at www.oceanagold.com for additional details on Haile Expansion
2. Refer to Cautionary Statements: 2019E production based on mid-point of guidance, 2020E – 2022E are approximate expectations
and is not to be used as formal guidance15
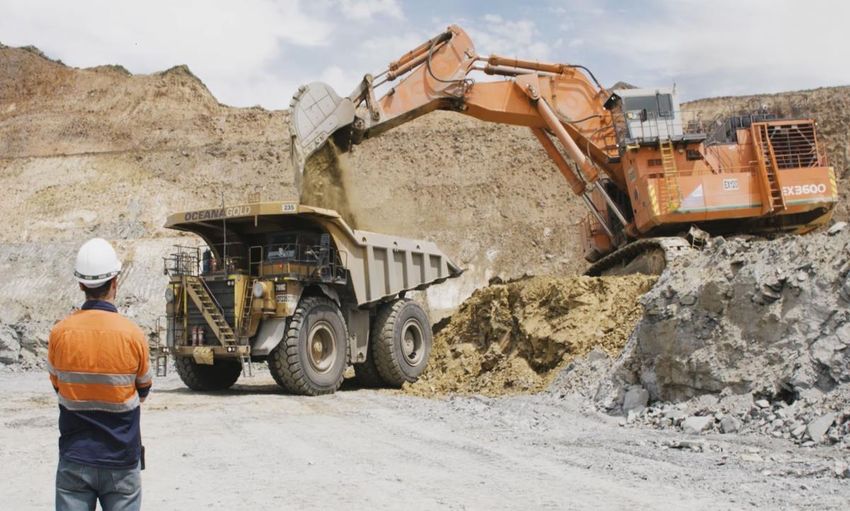
Upgraded Fine Grinding Circuit Construction
IsaMill
Tower Mill16
Haile Expansion
HORSESHOE RESERVES
Tonnes Grade Gold
(Mt) (g/t) (Moz)
Proven - - -
Probable 3.12 4.38 0.44
TOTAL RESERVES 3.12 4.38 0.44
MINING EXPANSION
HORSESHOE RESOURCES
✅ COMMENCE PERMITTING OF MINE EXPANSION Tonnes
(Mt)
Grade
(g/t)
Gold
(Moz)
Measured - - -
2021 HORSESHOE U/G
Indicated 2.71 5.68 0.49
Total M&I Resources 2.71 5.68 0.49
2021 EXPANDED OPEN PITS
Inferred 1.2 5.0 0.20
1. Refer to Haile 43-101 Technical Report located at www.oceanagold.com17
Opportunities for Improvement at Haile
2018 RAINFALL AT HAILE
18 WEATHER
16
14 ▪ Severe storms and heavy sustained rainfall identified
Rainfall (inches)
12 opportunities for improvement
10
8 WORKFORCE
Average
6 Monthly Rainfall ▪ Extensive recruitment campaigns in Western USA
4
2 ▪ Addressing labour shortage
0
PRODUCTIVITY
November
December
February
March
July
August
June
September
October
May
April
January
▪ Extensive maintenance program being implemented
SOUTH CAROLINA UNEMPLOYMENT RATE ▪ Upskilling the workforce
14
▪ Replacing mining fleet with larger equipment
12
10 ▪ Continued plant operator training
8
GEOLOGY
6
4 ▪ Additional infill drilling in sparsely drilled areas
2 Lowest rate in 30 years
0
2001
2010
1990
1991
1992
1993
1994
1995
1996
1997
1998
1999
2000
2002
2003
2004
2005
2006
2007
2008
2009
2011
2012
2013
2014
2015
2016
2017
201818
Macraes Organic Growth
GOLDEN POINT CROSS-SECTION
TARGETING ORGANIC MINE LIFE
EXTENSIONS
INVESTIGATING POTENTIAL FOR
STANDALONE UG MINE AT GOLDEN POINT
NEW MINE PLANNING DESIGNED TO
UNLOCK RESERVES, ADDITIONAL MINE LIFE
ROUND HILL PROJECT REPRESENTS
POTENTIAL OPTIONALITY
UNDERGROUND
POTENTIAL19
Didipio Underground
RAMP-UP OF UNDERGROUND PROGRESSING WELL, INCREASING MINING RATES IN 2019
+19 MT OF ORE STOCKPILED FOR PROCESSING
INCREASING MINING RATES
▪ 2018: 500 – 600 kt (actual: 627 kt)
▪ 2019: 1.2 – 1.3 Mt
▪ 2020 and beyond: 1.6 Mt
CONSTRUCTION OF PANEL TWO UNDERWAY
POTENTIAL ADDITIONAL RESOURCES AT DEPTH
Drilling at depth20
2019 Guidance
Gold Production Copper Production All-In Sustaining Costs
500,000 – 550,000 14,000 – 15,000 US$850 – US$900
ounces tonnes per ounce
HAILE DIDIPIO WAIHI MACRAES
Production (ounces) 145,000 – 160,000 120,000 – 130,000 60,000 – 70,000 175,000 – 190,000
Copper Production (tonnes) – 14,000 – 15,000 – –
AISC (per oz sold) $850 – $900 $625 – $675 $875 – $925 $1,000 – $1,050
CAPITAL GUIDANCE
HAILE DIDIPIO WAIHI MACRAES OTHER CONSOLIDATED
(USDm)
General operating 10 – 15 10 – 15 2–3 10 – 15 – 40 – 50
Pre-Strip / Capitalised mining 10 – 15 – 3–5 30 – 35 – 45 – 55
Exploration 3–5 2–3 15 – 20 6–8 10 – 15 40 – 50
Growth 55 – 60 35 – 40 15 – 20 1–2 3–5 110 – 125
TOTAL 80 – 95 45 – 55 35 – 50 50 – 60 15 – 20 235 – 28021
2019 Priorities
GENERATE STRONG CASH FLOWS AND BUILD FOR THE FUTURE
OPERATIONS GROWTH
▪ Continue improvement of safety leadership ▪ Implement Martha Underground project
▪ Focus on mine and plant productivity ▪ Advance the Haile mine & plant expansion plans
improvements at Haile ▪ Continue construction of panel two at Didipio
▪ Implement innovative technologies Underground
EXPLORATION FINANCIAL
▪ Significantly increase reserves at Waihi ▪ Disciplined capital allocation
▪ Increase mine life at Macraes ▪ Maintain low leverage
▪ Sustain reserves at Haile ▪ Continue to deliver strong ROIC
▪ Establish ourselves in new gold provinces
through joint venturesCorporate Headquarters Americas Corporate Office
Level 14, 357 Collins Street 777 Hornby Street Suite 1910
Melbourne, Victoria, 3000 Vancouver, British Columbia
V6Z 1S4
Australia
Canada
PO Box 355, E: info@oceanagold.com
Flinders Lane Post Office
Melbourne, Victoria, 3000
Australia
T: +61 3 9656 5300
F: +61 3 9656 5333
E: info@oceanagold.com
oceanagold.comYou can also read