CORPORATE PRESENTATION - Suntec Singapore International Convention & Exhibition Centre 25 March 2019
←
→
Page content transcription
If your browser does not render page correctly, please read the page content below
CORPORATE
                                                                      PRESENTATION
                                                  Suntec Singapore International Convention & Exhibition Centre
                                                                                                    25 March 2019

                                                                                                                                                                                                     mermaid-group.com
Disclaimer: The information contained in this document is intended only for use during the presentation and should not be disseminated or distributed to parties outside the presentation. Mermaid Group accepts no liability whatsoever
with respect to the use of this document or its contents.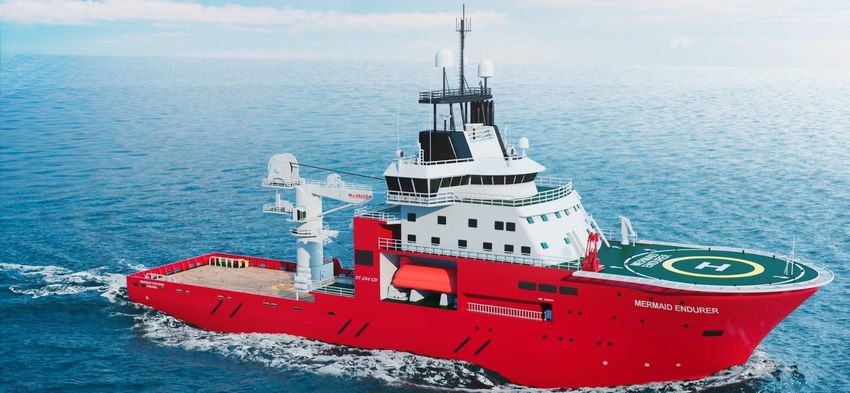
AGENDA

• Corporate Introduction
• Financial Review
• Market Review & Business Outlook

                                     2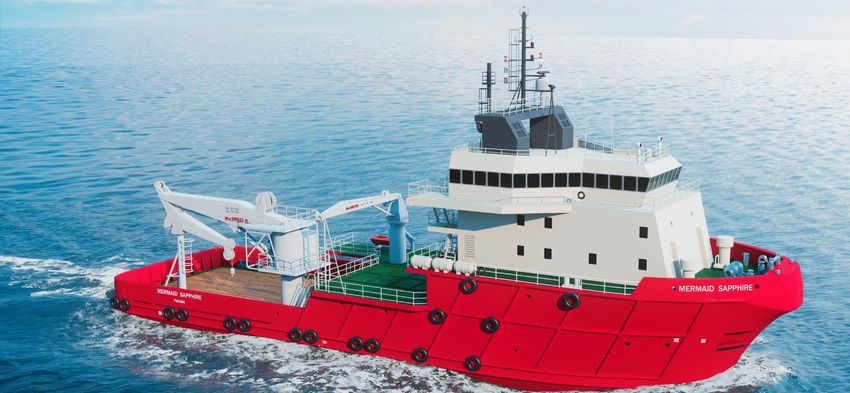
CORPORATE INTRODUCTION
                         3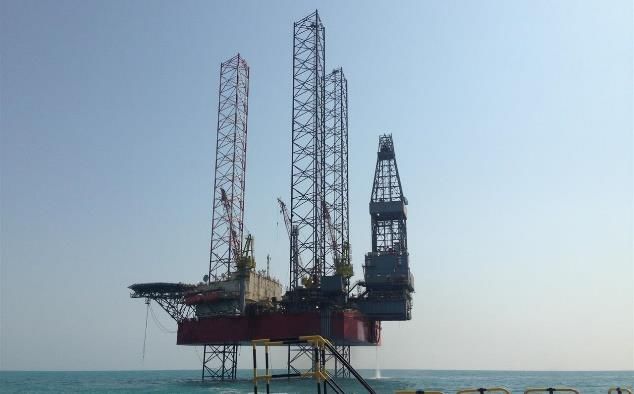
MERMAID GROUP
Having served the Oil & Gas industry for over 30 years,
Mermaid boasts a proven track record of subsea excellence.     “ We operate internationally, as
With operations throughout South East Asia and the Middle       one integrated group, globally
East, Mermaid plays a pioneering role in the global subsea      aware and locally sensitive ”
markets. Mermaid has the ability provide a subsea solution,
in any water depth which involve complex and challenging
engineering, in any region of the world for the Oil and Gas                Mr. Prasert Bunsumpun
                                                                           Chairman
markets.
                                                                           30+ years industry experience
                                                                           including CEO of Thailand’s National
Owning and operating a fleet of subsea construction,                       Oil Company PTT and Chairman of
intervention and survey vessels that enable us to offer                    PTT Exploration and Production

differentiated positions with our clients, Mermaid focuses
on long term relationships that enhance our service delivery
and reduce overall risk.
                                                                           Mr. Chalermchai Mahagitsiri
With a team of over 1,000 people worldwide our core                        Executive Vice Chairman & CEO
business is in subsea engineering, IRM, project management,                Proven track record of successfully
vessel chartering and operations, survey, ROV and diving                   managing and growing a variety of
                                                                           businesses including coffee, steel,
operations. Our Mission is to provide subsea engineering                   copper, shipping, media,
                                                                           entertainment, food and beverage,
solutions to the offshore oil & gas industry that are safe,                resorts and golf courses
efficient and on budget, every time.
                                                                                                                  4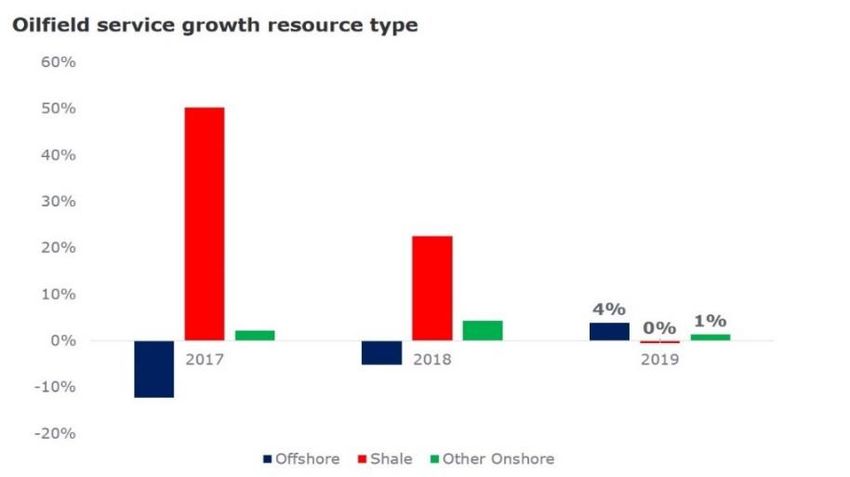
VISION, MISSION, VALUES

           VISION                                      MISSION                                      VALUES
To become the leading integrated subsea        To provide subsea engineering solutions      Respect
service provider by delivering technically-   to the offshore oil & gas industry that are
 unique solutions and creating high value     safe, efficient and on budget, every time.    Enhancing Value
   for our customers and shareholders.
                                                                                            Safety Commitment & Performance
                                                                                            Protecting the Environment
                                                                                            Ethical Business Standards
                                                                                            Compliance with Policies & Procedures
                                                                                            Technically Leading Solutions

                                                                                                                                    5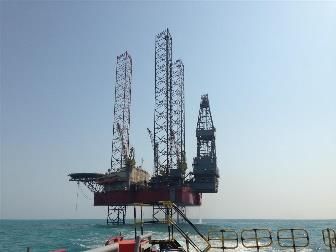
MERMAID MILESTONES
  Founded by Danish                   Successfully raised               Acquired Subtech Middle              Achieved record US$45m            Business turnaround from          Stabilized the
  mariners as Mermaid                 S$246m from its IPO on            East to expand subsea                net profit                        successful cost saving
  Marine Services Ltd. to             the Singapore Stock               services in Middle East                                                projects                          company for the
  provide offshore marine             Exchange (SGX)                    and Arabian Gulf                                                       Low gearing of c.0.1x with        future growth
  services such as life raft and                                        Acquired 33.76% stake in                                               no bonds and no capex
  firefighting maintenance                                              Asia Offshore Drilling to                                              outstanding
  services                                                              expand into jack-up
                                                                        drilling rig business

1983         2005                  2007         2008            2010              2012               2014                  2015        2016               2017              2018

                                                                                         PM Group Acquires
                                                                                         Thoresen:
                                                                                         • Provided leadership stability                                        Expanded business to new
                                                     Acquired Seascape                   • Implemented new strategic
                                                                                                                             New cable-laying business          geographical areas:
                    Expanded into tender             Surveys for access to                 direction                         in Middle East                     Malaysia; Singapore; and
                    drilling rig business by         hydrographic and                    • Strengthened the core, and        Impairment loss to reflect         countries in the Middle
                    acquiring two tender rigs        positioning services                  drove profit turnaround           asset market value                 East

                                                                                                                                                                                                   6
GLOBAL SERVICE SPECIALIST
“Predominantly focused on the production phase of the offshore oil and gas value chain.”
1 - 2 years 3 - 5 years 15+ years 1 year
Initial Exploration Field Development Production Abandonment
Field
Most Priority Appraisal Development Maintenance
Least Priority
Seismic Commissioning Cable Laying Decommission
Drilling Drilling & Inspection
& Installation
NOC / Independents
Spending Priority ◔ ◔ ◐ ◐ ● ● ◐
SUBSEA DRILLING
Field Development - Subsea support vessels assist in, among other things, survey and
preparations of the seabed, installation of modules, umbilical cables and risers, as well as provision
of Remotely Operated Vehicles (ROVs) or divers for tie-in and testing.
Production - Once installed, the equipment is surveyed and maintained, together with both
larger repair and development campaigns.
Jack-up Rig is a mobile self-elevating drilling platform
equipped with legs that can be lowered down to the ocean
Abandonment - To cease efforts to find or produce from a well or field, and to plug well and
floor. Once a foundation is established, the drilling
salvage material and equipment - subsea vessels are utilized.
platform is elevated to a level above the highest expected
Subsea engineering services also include Underwater Cable Laying Services for wave height. When the rig is relocated, the platform is
telecommunications, electric power transmissions, or other purposes. lowered to sea level and towed by a supply vessel to its
next location.
7FLEET & ASSETS
Our Subsea Fleet and Asset
specialize in IRM, survey and
construction installation support,
subsea decommissioning, subsea
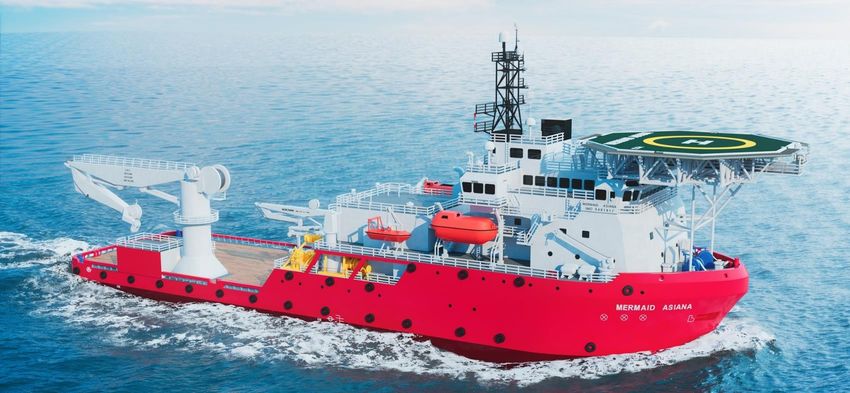
Endurer Asiana Commander Sapphire vessels and specialized work ROV
Owned Vessels
Built 2010
DSV
Built 2010
DSV
Built 1987 Built 2009 services.
DSV RSV
Middle East Middle East Thailand Middle East
Complex IRM operations are made
efficient through Mermaids ongoing
innovation and dedicated people.
Subsea Services:
Challenger Siam Barakuda
Built 2008 Built 1991 Built 1982
• Cable & SURF Installation
MV DCSB
Thailand Middle East
SS
Indonesia
• Full compliment of Subsea
Engineering
• Inspection, Repair & Maintenance
Drilling Services Assets & Equipment
(IRM)
• Subsea Infrastructure Installation
6+17 Support
AOD 15 SATURATION
AND
• Remotely Operated Vehicle (ROV)
I, II, III ROVs AIR DIVING Support
SYSTEMS • Survey and Positioning Services
8OUR CLIENTS
National Oil & Gas Companies International Oil & Gas Companies Major EPCIC Contractors
9FINANCIAL REVIEW
10SUBSEA REVENUE
Subsea Services FY2018 FY2017 FY2016
Revenue % USD MM % USD MM % USD MM
Subsea Services
IRM 100% 94.8 100% 144.7 95% 175.5
Cable laying 0% 0.0 0% 0.0 5% 9.7
Total 94.8 144.7 185.2
Regional FY2018 FY2017 FY2016*
Revenue % USD MM % USD MM % USD MM
Subsea Services
Middle East 80% 75.4 61% 88.5 60% 104.1
South East Asia 20% 19.4 39% 55.7 34% 59.8
East Asia 0% 0.0 0% 0.5 6% 10.8
Europe 0% 0.0 0% 0.0 0% 0.5
Africa 0% 0.0 0% 0.0 0% 0.3
Total 94.8 144.7 175.5
*Excluding cable laying revenue
11SUBSEA OWNED FLEET UTILIZATION
4-Major Owned Fleet Utilization Four Major Owned Vessels
1,800
1,600
1,400
65% Mermaid Asiana
56% 57%
1,200
Working in Middle East with 1+1
year contract
1,000
800
600
1,074 Mermaid Endurer
400
804 740 Supporting demand in Middle East
200 market
-
FY2016 FY2017 FY2018
Operating Days Vessels Utilization Rate Mermaid Commander
Supporting demand in South East
Asia market
Non-Performing Vessels
Mermaid Sapphire
Mobilized to work in Middle East in
2018
Mermaid Siam Barakuda Mermaid
Challenger
12PROFIT & LOSS
FY2018 FY2017 FY2016
Profit and Loss for the Year
USD MM % of Revenue USD MM % of Revenue USD MM % of Revenue
Revenue from Services 94.8 100.0% 144.7 100.0% 185.2 100.0%
Costs of Services (86.2) 90.9% (103.3) 71.4% (131.4) 71.0%
Gross Profit 8.6 9.1% 41.4 28.6% 53.8 29.0%
Admin Expenses, Other Expenses, Other Income (20.9) 22.0% (18.7) 12.9% (26.4) 14.3%
EBITDA from Operation (12.3) -13.0% 22.7 15.7% 27.4 14.8%
Share of Profit of Associates & Joint Venture 8.1 8.5% 4.7 3.2% 11.5 6.2%
Depreciation and Amortization (18.3) 19.3% (19.5) 13.5% (21.0) 11.3%
EBIT (22.5) -23.7% 7.9 5.5% 17.9 9.7%
Finance Costs (3.9) 4.1% (3.6) 2.5% (3.5) 1.9%
Profit (Loss) Before Tax (26.4) -27.8% 4.3 3.0% 14.4 7.8%
Tax (Expenses) Benefit (0.9) 0.9% (0.1) 0.1% 2.8 1.5%
Net Profit (Loss) for the Year (27.3) -28.8% 4.2 2.9% 17.2 9.3%
Earnings (Losses) Per Share (US cents) (1.9) 0.3 1.2
13VESSEL RUNNING COSTS
Owned Vessel Running Costs were stable
USD MM
Owned Vessels 31.3
▪ Vessel running costs was remained the same as 24.6
24.0
FY2017. The slight increase from last year was due to
repair and maintenance cost.
Chartered-In Vessels
12.9
▪ Resolution had been chartered-in until end of July 8.5
2018 and was returned to Owner. 1.7
▪ No chartered-in vessel at the end of FY2018. Owned Vessels Chartered-In Vessels
FY2016 FY2017 FY2018
14HEALTHY & STRONG BALANCE SHEET
Balance Sheet 31 Dec 31 Dec 31 Dec 31 Dec 31 Dec 31 Dec
(USD MM)
(USD MM) 2018 2017 2016 2018 2017 2016
Cash & Cash Equivalents and Deposits 54.5 68.7 89.8 Interest Bearing Debt
Trade Accounts Receivable 35.9 62.1 65.3 Asset-backed Financing 67.7 79.6 89.5
Other Current Assets 8.5 11.0 19.0
Unsecured Loan - - -
Total Current Assets 98.9 141.8 174.1
Finance lease 0.1 0.2 -
Restricted deposit at banks 14.6 12.8 8.0
Total Debt 67.8 79.8 89.5
Investment in Associates & JV 121.5 108.2 86.3
Cash, Deposits and Bank Balances (69.1) (81.5) (97.8)
Property, Plant and Equipment 169.4 182.9 198.2
Other Non-Current Assets 5.2 5.4 5.5 Total Debt, Net of Cash (1.3) (1.7) (8.3)
Total Non- Current Assets 310.7 309.3 298.0 Shareholders’ Equity 314.9 342.2 338.3
Total Assets 409.6 451.1 472.1 Net Gearing -0.4% -0.5% -2.4%
Trade Accounts Payable 5.2 4.8 5.8
Current Portion of Long-term Borrowings 15.9 11.9 9.9 Financial Ratio:
Other Payable 19.2 22.2 35.8
Total Current Liabilities 40.3 38.9 51.5 ▪ Current Ratio = 2.45x
Long-Term Borrowings 51.8 67.7 79.6 ▪ Liabilities to Equity Ratio = 0.30x
Other Non-Current Liabilities 2.6 2.3 2.7 ▪ Net Debt to Equity Ratio = 0.21x
Total Non-Current Liabilities 54.4 70.0 82.3 ▪ Net Gearing = -0.4% (Positive cash balance)
Total Liabilities 94.7 108.9 133.8
Total Equity 314.9 342.2 338.3
15DEBT MATURITY PROFILE
Interest-Bearing Debt Maturity
USD 67.7 MM Asset-Backed Debt
(31 December 2018)
▪ As at 31 December 2018, there is USD 67.7 USD 67.7 MM
million of long-term loan and no short- 30.9
term loan.
20.9
▪ The majority of debt maturity profile is 15.9
from 2020 onward.
▪ Liquidity risk is still low with high financial
flexibility.
2019 2020 2021
16POSITIVE CASH FLOWS FROM OPERATIONS
Cash Flows (USD MM) FY2018 FY2017 FY2016
Cash Flow From Operating Activities:
Before Changes in Working Capital (10.2) 23.4 37.5
Changes in Working Capital 20.9 (9.7) 19.1
Others (0.9) (2.4) (4.2)
9.8 11.3 52.4
Cash Flow From Investing Activities:
Increase in Current Investments (17.8) - -
Proceeds from Short-term Deposit at Financial Institutions - 28.0 (28.0)
Increase in advance payment for investment - (17.3) -
Acquisition of Investment in Associate (5.2) - -
Proceeds from Sale of Property, Plant and Equipment 4.0 - -
Acquisition of Property, Plant and Equipment and Intangible Assets (7.5) (3.1) (5.3)
Dividend and Interest Received 0.7 0.9 7.1
(25.8) 8.5 (26.2)
Cash Flow From Financing Activities:
Repayment of Borrowings (12.0) (10.0) (18.0)
Finance Costs Paid (3.8) (3.5) (3.4)
(15.8) (13.5) (21.4)
Net increase (decrease) in cash and cash equivalents (31.8) 6.3 4.8
Effect of Exchange Rates (0.4) 0.6 (0.4)
Beginning Balance as at 1 January 68.7 61.8 57.4
Cash Balance as at 31 December * 36.5 68.7 61.8
*Excluding restricted cash
17ORDER BOOK
Total Order Book (excluding AOD)
USD MM
174 173 165
150 148
129
99 95
31-Mar-17 30-Jun-17 30-Sep-17 31-Dec-17 31-Mar-18 30-Jun-18 30-Sep-18 31-Dec-18
Order Book by Region Order Book by Year
100%
95 MM
95 MM
100%
FY2019 FY2020 FY2021+
Middle East Asia Pacific & SEA
18AOD’S 3 RIGS CONTRACT
AOD Rigs Utilization Share of Profit of Associates
100% 99% 100% (USD MM)
99% 100% 100% 100% 100% 99%
10.6
8.1
4.6
FY2016 FY2017 FY2018
FY2016 FY2017 FY2018
AOD I AOD II AOD III
▪ Excellent performance in FY2018, 99-100% average utilization for 3 rigs.
▪ Share of profits increased when compared to the last year due to Bareboat Chartered rate increasing.
▪ The outstanding balance of Senior Secured Credit Facility as at 31 December 2018 remained at US$ 210
million.
▪ AOD I has secured contract extension for another three years with the same customer commencing
from July 2019 through June 2022.
2013 2014 - 2017 2018 2019 2020 2021 2022
J F MA M J J A S O N D J F MA M J J A S O N D J F MA M J J A S O N D J F MA M J J A S O N D J F MA M J J A S O N D J F MA M J J A S O N D
AOD I
AOD II
AOD III
Finished Confirmed Unconfirmed
19MARKET REVIEW & BUSINESS OUTLOOK
20MARKET REVIEW
Oil Prices’ Volatility
▪ Brent price increased by more than 20% and hit a four-year high of $86/bbl in
October 2018, but throughout the rest of the year it was dragged down to as low
as $50-55/bbl.
▪ Factors influencing the current global oil prices:
• On the supply side there is tension between OPEC, led by Saudi Arabia who is
exceeding its pledge as part of the deal reached in January to remove 1.2 million
barrels from the market, against the continued ramp up of U.S. oil production.
• Coupled with this is the ongoing trade war and imposed tariffs between the US
and China.
▪ Oil prices will continue to be under pressure in 2019, but they won’t collapse. The
world’s major suppliers, Russia, Saudi Arabia, and China will continue to pump
more oil into the market, as a slow-down in the global economy will taper demand.
Source: Bloomberg & Oilprice.com
21MARKET REVIEW
Offshore Spending & Subsea Market
▪ Offshore service market and the maintenance,
modifications and operations sector is projected to grow
by 4% in 2019.
▪ Spending in the shale industry to stay flat.
▪ Market started to see an uptick in the number of new
projects of 62 projects in 2017, some 90 projects in 2018,
and over 100 projects in 2019
Source: Rystad Energy
▪ Investments in the offshore sector are more robust
whereby even with an oil price of $50/bbl, investments 2019 Offshore Spending
are expected to increase for midwater and Deepwater
E&P activities.
Europe & Middle East,
▪ Revenues to start growing in 2019, with 30% of 2019 North America, 30%
projects value sits in Middle East, 25% in South America, 30%
15% in both Africa and Asia, and the rest are in Europe $210bn
and North America combined.
• Expenditure on subsea vessel operations to amount $10- South
13 billion per year from 2019-2023, with subsea vessel Africa & Asia, America, 25%
15%
demand days forecast to grow by 12%.
Source: Rystad Energy
22BUSINESS OUTLOOK
1 Brent crude oil averaged $57/b in December 2018, down from an average of $81/b in October
2018. The decline in late 2018 largely reflected rising oil inventories. Prices also fell as a result of
uncertainties about global economic indicators and future oil demand growth.
2 The outlook for offshore service contractors including subsea service providers currently
appears to be positive as more than 100 new projects are aiming to be sanctioned in 2019.
3 According to Rystad Energy, 30% of the 2019 projects value sits in Middle East, 25% in South
America, 15% in both Africa and Asia, and the rest in Europe and North America combined.
4 The Mermaid Asiana, Sapphire and Endurer continue to operate in the Middle East and will
remain in the region for the foreseeable future as we still expect to achieve higher utilization
rates throughout 2019.
23BUSINESS OUTLOOK
5 MSS is currently positioning itself to secure lucrative cable and subsea engineering installation
projects. Additionally, MSS continues to focus on the Gulf of Thailand decommissioning
projects with alignments with heavy lift and decontaminate service providers.
6 Mermaid Commander is undergoing cold stacking. The other non-performing assets
i.e. Challenger, Siam and Barakuda remain cold stacked and are marketed for sale.
7 MSS is reviewing options to secure larger DP3 OSCV’s to enhance it subsea engineering
capability in SURF, Cable installations and Deepwater operations to increase business
activities in global markets.
8 All three jack-up drilling rigs ‘AOD I’, ‘AOD II’ and ‘AOD III’ remain on contract in the Middle
East thus reducing downside risk as market recovers. AOD loan refinancing continues in
progress.
24MERMAID’S POSITIONING
Wider Geographical Core Business Focused, with
Coverage an Addition of Integrated
Service Packages
• Shallow water – more defensive
and less affected by lower oil • Remain focused on IRM scopes,
price. Several conventional further enhancement internally
projects will be carried-out in with enhancing our in-house
Mermaid’s home markets engineering suite of services.
continues.
• Offer an integrated range of
• Mermaid expansion geographically subsea services with a revamped
into other markets such as North highly specialized workforce
Sea, West Africa, Mediterranean continues.
continues.
Track Record of Quality and Fiscal Discipline
Safety, Modern Asset Base • Retain low gearing and sufficient
• Excellent operational and safety cash reserve.
record and stable management • Flexibility to take advantage of any
team. opportunistic and organic growth
• Robust subsea fleet with that may present itself in the
chartering-in plan to serve present time.
fluctuating demand.
• AOD’s three jack-up drilling rigs
contract extended to 2019 in the
Middle East.
25A Company Moving Forward
ir@mermaid-group.com
mermaid-group.comYou can also read