Insurance Technology Market Update - Q1 2021 - Houlihan Lokey
←
→
Page content transcription
If your browser does not render page correctly, please read the page content below

Insurance Technology Market Update
Q1 2021
Insurance Technology Market Update—Q1 2021
Q1 insurance technology (insurtech) capital raising and M&A activity continue at an accelerated pace following a record 2020.
Dear Clients and Friends,
Houlihan Lokey is pleased to present its Insurance Technology Market Update for Q1 2021.
Insurtech continued its hot streak in Q1 2021 with ~$6.6 billion in financing volume and ~$18.5 billion in M&A volume.
~$6.6 billion in Q1 2021 financing volume was ~840% higher than Q1 2020 levels and ~340% higher than Q1 2019 levels.
˗ 120 financings in Q1 were ~70% higher than the year-ago period and ~30% higher than Q1 2019 financings.
˗ Lots of Q1 financing activity across digital distribution, software, and data and analytics, including large financing rounds for Next, Coalition, Zego,
Pie, Corvus, and others.
Q1 saw ~$18.5 billion in M&A volume, making it the highest volume quarter we’ve seen to date, driven by a few large deals, including UnitedHealthcare’s
acquisition of Change Healthcare, Insight and Stone Point’s acquisition of CoreLogic, and BC Partners’ acquisition of Davies Group.
˗ 49 M&A transactions in Q1 were ~160% higher than the year-ago period and Q1 2019 M&A transactions.
Q1 2021 continued to see additional insurtech IPOs such as Oscar, as well as IPOs via SPAC mergers (either completed or announced/in process) for
Clover, Metromile, Alight, CCC, Doma (formerly States Title), Hippo, and QOMPLX.
˗ Insurance software and online distribution companies lead the pack, trading at 20.3x and 17.9x EV/2021E EBITDA, respectively.
We hope you enjoy this report, and please reach out if you have any questions. We look forward to staying in touch.
Regards,
Additional Team Contacts
Kegan Greene
KGreene@HL.com Mark Fisher Tim Shortland Craig Muir
MFisher@HL.com TShortland@HL.com CMuir@HL.com
415.273.3639
+44 (0) 20 7907 4203 +44 (0) 20 7907 4213 212.497.7803
Rob Freiman Chris Pedone Paul Tracey
RFreiman@HL.com CPedone@HL.com PTracey@HL.com
212.497.7859 212.830.6166 +44 (0) 20 7907 4225
Sources: Pitchbook.com, S&P Capital IQ, news articles, and company filings.
Note: Market data as of March 31, 2021. 2Continued Insurtech Public Market Activity in 2021
Q1 2021 saw a strong continuation from 2020 public market activity with the announcement of three additional insurtech IPOs/SPAC mergers
(Clover, Metromile, and Oscar) and five others in process (Alight, CCC, Doma, Hippo, and QOMPLX).
Pre-Deal Pre-Deal Post-Deal Trading Update/
Company Description Funding Deal Date Transaction Details Valuation Valuation Commentary
Preferred provider organization (PPO) platform intended to • EV: $4.5B Stock performance (50%)
$925M Jan-21 $3.7B $4.5B
improve the quality of life of its members and physicians. • Proceeds: $400M since Jan-21 SPAC date.
Recent IPOs
Provides personalized auto insurance policies, which are priced • EV: $1.0B Stock performance (6%)
$285M Nov-20 $550M $1.0B
and billed by the mile with rates based on user driving activity. • Proceeds: $160M since Nov-20 SPAC date.
Provider of an online health insurance network designed to • Offer price: $39 Stock performance (15%)
$1.9B Mar-21 $6.5B $7.9B
make insurance simple and intuitive. • Total raised: $1.4B since Mar-21 IPO date.
Foley Trasimene’s SPAC
Provider of outsourced administration and cloud-based human • EV: $7.3B has agreed to acquire
$1.0B Jan-21 $3.0B $7.3B
resources and financial applications. • Est. proceeds: $300M Alight; expected to close
Q2 2021.
Dragoneer’s SPAC has
Connects insurance companies, repair facilities, OEMs, and • EV: $7.0B
$375M Feb-21 $3.0B $7.0B agreed to acquire CCC;
third-party data to manage the claims and repair process. • Est. proceeds: $968M
expected to close Q2 2021.
Announced/
Capitol Investment’s SPAC
In Process
Developer of technologies intended to remove the friction in
• EV: $3.0B has agreed to acquire
underwriting title insurance, making the process simple and $300M Mar-21 $2.6B $3.0B
• Est. proceeds: $645M Doma; expected to close
efficient.
Q2 2021.
Reinvent Technology
Provider of home insurance services designed to offer smart • EV: $5.0B Partners Z has agreed to
$700M Mar-21 $3.8B $5.0B
coverage for homeowners. • Est. proceeds: $1.2B acquire Hippo; expected to
close mid-2021.
Tailwind Capital’s SPAC
Decision platform for detection, monitoring, adaptive response, • EV: $1.4B has agreed to acquire
$100M Mar-21 N/A $1.4B
and risk optimization of disparate data sources. • Est. proceeds: $180M QOMPLX; expected to
close mid-2021.
Rumored
Developer of an online business insurance Developer of an aggregator Developer of software for the
IPOs
platform designed to transform the insurance platform intended to offer automobile insurance claims
experience for small businesses. insurance products. processing industry.
Sources: Pitchbook.com, S&P Capital IQ, news articles, and company filings.
Note: Market data as of March 31, 2021. 3Continued Record Investment Into the Insurtech Sector
We are well positioned for another record fundraising year with more than $6.6 billion in financing volume across 120 transactions in Q1.
Financing volume in Q1 2021 was ~840% higher than Q1 2020 levels and has already surpassed the full year of financing volume from 2019.
Selected Major Insurtech Financings
Number of Transactions
480
$12,000
500
Financing Volume ($USD M) 450
$10,000
400
332
332
$8,000
350
269 300
$6,000
206 216 250
163 $10,310 200
$4,000
127 120
150
88 $6,003 $6,626 100
$2,000
$3,989
$2,773 $2,694 $3,185 50
$702
$
0
2014 2015 2016 2017 2018 2019 2020 Q1 2021
$60M $500M $103M $130M $500M $500M $1.2B(2) $1.4B
$65M $931M $400M $160M $165M $300M $914M $1.2B(2)
$110M(1) $38M $160M $120M $200M $205M $725M $968M(2)
$38M $50M $300M $350M $405M $645M(2)
$200M $250M $365M(1) $250M
Sources: Pitchbook.com, Mergermarket, and S&P Capital IQ.
Notes: Market data as of March 31, 2021. Includes seed, angel, early- and late-stage VC, corporate, accelerator/incubator financing rounds, and IPOs.
(1) Oscar raised two rounds in 2014 worth $30 million and $80 million, respectively, and raised two rounds in 2020 worth $225 million and $140 million, respectively. $294M(2)
(2) Estimated amounts per Pitchbook.com, Mergermarket, S&P Capital IQ. 4Financing Activity Remains Active Across All Categories of Insurance
Q1 2021 has far outpaced every quarter in the past 24 months, with more than $6.6 billion in financing volume across 120 transactions. More than
half of Q1 financing activity is attributable to a continued wave of insurtech IPO and SPAC mergers (Oscar, Hippo, and CCC).
Quarterly Financing Activity ($M)(1) Selected Q1 2021 Financing Transactions ($M)
$1.4B
LTM financing volume:
$16.2B across 380 deals $1.2B(2) Selected Amt. Post-Money
Ann. Date Company Investor(s) Invested Valuation
$968M(2)
$1.2B
000 140 03/25 $118.0 N/A
$725M $6,626
03/10 $150.0 $1,000.0
$294M
000 120 120
03/10 $100.0 $750.0
$4,340
000 100
95 03/08 $30.0 N/A
90 89
000 80 02/21 $75.0 $1,075.0
76
72
02/10 $30.0 $220.0
63 62
000 60
54
54
02/03 $52.0 $222.0
000 $3,840 40
02/01 $175.0 $1,750.0
$3,014
000 $2,121 20 01/26 $125.0 $1,000.0
$1,808
$1,520 $1,519 $1,423
$1,155
$707 01/26 $95.0 $480.0
$ 0
Q1 2019 Q2 2019 Q3 2019 Q4 2019 Q1 2020 Q2 2020 Q3 2020 Q4 2020 Q1 2021
01/26 N/A N/A
Average Deal Size ($M)
16.9 24.1 18.6 33.5 9.8 18.7 43.1 45.7 55.2 01/06 $52.5 $252.5
Sources: Pitchbook.com, Mergermarket, and S&P Capital IQ.
Note: Market data as of March 31, 2021.
(1) Includes seed, angel, early- and late-stage VC, corporate, accelerator/incubator financing rounds, and IPOs.
(2) Estimated amounts per Pitchbook.com, Mergermarket, S&P Capital IQ. 5M&A Activity Off to a Strong Start in 2021…
2021 M&A volume has already seen a number of large deals, including UnitedHealthcare’s acquisition of Change Healthcare and Insight and
Stone Point’s acquisition of CoreLogic. The total number of transactions in Q1 2021 outpaced Q1 2020 levels by approximately 160%.
Selected Major Insurtech M&A Transactions
Number of Transactions Financing Volume ($USD M) 196
$20,000 140
$18,000
115 120
$16,000
$14,000
85 88 100
$12,000
71 73 74
74
67 49
80
$10,000
$18,547
60
$8,000
$17,449 $18,548
$6,000
$11,805 40
$4,000
$7,444 $8,693
$2,000
$5,052 $5,559 20
$ 0
2014 2015 2016 2017 2018 2019 2020 Q1 2021
$2.4B $8.7B $1.4B $2.5B $155M $3.5B $5.35B $8.6B(2)
$400M $760M $174M $919M Undisclosed $1.5B $2.65B $6.0B(2)
Acquirer logo on top
$160M $490M Undisclosed $1.6B ~$900M(1) $1.7B
Houlihan
Lokey
deal
$322M $6.7B $1.4B $730M $225M(3)
Sources: Pitchbook.com, Mergermarket, and S&P Capital IQ.
Notes: Market data as of March 31, 2021. Includes merger/acquisition, (2) Pending close. Excludes ~$5 billion and ~$2 billion of debt for
buyout/LBO, private secondary, PIPE, and PE growth/expansion deals. Change Healthcare and CoreLogic, respectively.
(1) Estimated per Pitchbook.com. (3) Development capital via PIPE transaction.
6…Driven by a Few Large Transactions
Q1 2021 had a few large M&A deals, putting volume well ahead of all previous quarters, along with a continued record number of transactions.
Quarterly M&A Activity ($M) Selected Q1 2021 M&A Transactions ($M)
LTM M&A volume:
$8.6B(3) $6.0B(3)
Transaction
$35.1B across 145 deals Ann. Date Buyer Target Value
$1.7B
03/23 N/A
0,000
$18,548
8,000 50 03/09 N/A
49
6,000 03/04 N/A
40
4,000 36
$5.4B 03/03 N/A
36
2,000 $9,460
$2.65B
$3.5B 31 30 03/03 N/A
29
0,000
$7,432
$868M
02/04 $6,000.0(3)
8,000 22
21 20
19 19 $686M
6,000 $5,443
01/14 $100.0
12
4,000 $1.4B 01/07 N/A
10
2,000 $1,876 $4,110
$3,932
$2,267 01/07 N/A
$1,753 $1,681 $1,238
$476 $744 $865
$ (1)
0
Q1 2019 Q2 2019 Q3 2019 Q4 2019 Q1 2020 Q2 2020 Q3 2020 Q4 2020 Q1 2021 01/06 $8,616.0(3)
Average Deal Size ($M)(2)
26.4 83.5 187.2 62.0 45.5 54.2 146.8 37.5 49.3 01/01 $136.0(4)
Sources: Pitchbook.com, Mergermarket, and S&P Capital IQ.
Notes: Market data as of March 31, 2021. Includes merger/acquisition, buyout/LBO, private (2) Average deal sizes exclude outlier transactions.
secondary, PIPE, and PE growth/expansion deals. (3) Pending close. Excludes ~$5 billion and ~$2 billion of debt for Change Healthcare and
(1) Q2 ’19 includes $140 million sale of an investment portfolio by Axiata Digital to CoreLogic, respectively.
Singaporean Fund managed by Gordian Capital, which included their stake in BIMA. (4) Based on 10,002 INR converted to USD at a rate of 0.01360522 USD/INR.
7Mixed Insurtech Public Company Performance...
Brokerage and services and digital carriers lead the insurtech pack.
LTM Share Price Performance
240
220
200
180
160 150.5
140.2
140 133.9
131.1
120 123.9
100
Insurance Software Digital Carriers Online Distribution Health and Benefits Brokerage and Services
Public Insurtech Ecosystem
Insurance Digital Online Health and Brokerage
Software Carriers Distribution Benefits and Services
/
LTM Share Price
33.9% 40.2% 31.1% 23.9% 50.5%
Performance
Source: S&P Capital IQ.
Note: Market data as of March 31, 2021. 8...Drives Multiple Differentiation for Certain Categories
Insurance software and online distribution companies lead the pack, trading at 20.3x and 17.9x EV/2021E EBITDA, respectively.
Enterprise Value/2021E Revenue Enterprise Value/2021E EBITDA
9.0x 8.2x 24.0x
8.0x 20.3x
20.0x 17.9x
7.0x
15.5x 15.3x
6.0x 5.2x 16.0x
5.0x
4.1x 12.0x
4.0x
2.9x
3.0x 8.0x
2.0x
2.0x
4.0x
1.0x
NM
-- --
Insurance Digital Brokerage and Health and Online Insurance Online Brokerage and Health and Digital
Software Carriers Services Benefits Distribution Software Distribution Services Benefits Carriers
Public Insurtech Ecosystem
Insurance Digital Online Health and Brokerage
Software Carriers Distribution Benefits and Services
/
2021E Revenue Multiple 8.2x 5.2x 2.0x 2.9x 4.1x
2021E EBITDA Multiple 20.3x NM 17.9x 15.3x 15.5x
Notes: Trading multiples are based on share price, other market data, and broker consensus future earnings estimates from S&P Capital IQ as of March 31, 2021. Growth and multiples shown are
median values for comp group. All financials calendarized to a December year-end. 9Leading Independent Advisory Firm
Houlihan Lokey is the trusted advisor to more top decision-makers than any other independent global investment bank.
Corporate Finance Financial Restructuring Financial and Valuation Advisory
2020 M&A Advisory Rankings 2020 Global Distressed Debt & Bankruptcy 2001 to 2020 Global M&A Fairness
All U.S. Transactions Restructuring Rankings Advisory Rankings
Advisor Deals Advisor Deals Advisor Deals
1,500+ 1 Houlihan Lokey 210 1 Houlihan Lokey 106 1 Houlihan Lokey 956
Employees 2 Goldman Sachs & Co 172 2 PJT Partners Inc 63 2 JP Morgan 876
3 JP Morgan 132 3 Lazard 50 3 Duff & Phelps 802
4 Evercore Partners 126 4 Rothschild & Co 46 4 Morgan Stanley 599
23
5 Morgan Stanley 123 5 Moelis & Co 39 5 BofA Securities Inc 542
Locations Refinitiv (formerly known as Thomson Reuters). Announced
Source: Refinitiv (formerly known as Thomson Reuters) Source: Refinitiv (formerly known as Thomson Reuters) or completed transactions.
No. 1 U.S. M&A Advisor No. 1 Global Restructuring Advisor No. 1 Global M&A Fairness Opinion
~45% Top 5 Global M&A Advisor 1,000+ Transactions Completed Valued
Advisor Over the Past 20 Years
Employee-Owned at More Than $3.0 Trillion Collectively 1,000+ Annual Valuation Engagements
Leading Capital Markets Advisor
~$4.5 Billion
Market Cap North America Europe and Middle East Asia-Pacific
Atlanta Miami Amsterdam Madrid Beijing Sydney
More Than Boston Minneapolis Dubai Milan Hong Kong Tokyo
$1 Billion
Chicago New York Frankfurt Paris Singapore
Annual Revenue
Dallas San Francisco London
No Houston Washington, D.C.
Debt Los Angeles
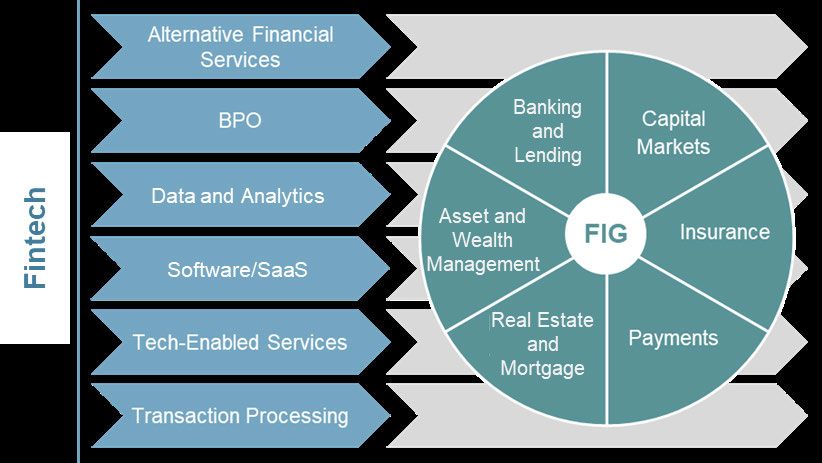
10Global, Market-Leading Fintech Practice
There is significant momentum in fintech following a dedicated team build-out in partnership with our industry leading Financial Institutions Group
(FIG) franchise, further supported by the extensive resources and relationships of Houlihan Lokey’s broader global platform.
75+ Global 50+ 2016–2020 M&A Advisory Rankings
dedicated fintech/FIG single specialized completed or announced Global Financial Institutions
bankers based in London, practice across fintech M&A and private Transactions Under $1 Billion(1)
New York, Los Angeles, the world placement transactions
Rank Advisor Deals
Miami, and San Francisco since the start of 2019
1 Houlihan Lokey 56
2 Barclays Capital Inc. 54
3 Morgan Stanley 52
4 Goldman Sachs & Co. LLC 49
5 J.P. Morgan Securities LLC 48
Source: SNL Financial.
(1) Rankings exclude depository transactions.
Product Capabilities
M&A Advisory (Sellside and Buyside)
Private Capital Markets (Debt and Equity)
Financial Restructuring
Board and Special Committee Advisory
Fairness Opinions and Valuation Services
11Proven Fintech Track Record With Exceptional Momentum
Transaction Pending Transaction Pending Transaction Pending
a division of
has agreed to acquire including has sold its minority stake in
has received a minority investment has been acquired by has invested in has been acquired by
from has been acquired by has received a $260m structured
investment from
a portfolio company of
has agreed to be acquired by to
has agreed to be acquired by Macquarie
Nordic Capital
Buyside Advisor Sellside Advisor Financial Advisor and Placement Agent Sellside Advisor Sellside Advisor Sellside Advisor Financial Advisor Buyside Advisor and Financing Advisor Sellside Advisor Sellside Advisor
Mar. 2021 Mar. 2021 Feb. 2021 Feb. 2021 Dec. 2020 Dec. 2020 Dec. 2020 Dec. 2020 Dec. 2020 Dec. 2020
Capital Markets Real Estate/Mortgage Data and Analytics Banking/Lending Insurance Capital Markets Data and Analytics Corporate/Diversified Asset/Wealth Corporate/Diversified
Unit4 Wholesale B.V.
Protection America Inc. a subsidiary of
has been acquired by has acquired has been acquired by
has participated in the
has been acquired by
has received an investment by Minneapolis Grain Exchange a portfolio company of
has been recapitalized by has been acquired by
has been acquired by
a portfolio company of a portfolio company of a portfolio company of
a portfolio company of has been acquired by
Series B financing round
Sellside Advisor Sellside Advisor Sellside Advisor Sellside Advisor Buyside Advisor Placement Agent Sellside Advisor Financial Advisor Sellside Advisor Sellside Advisor
Nov. 2020 Nov. 2020 Nov. 2020 Oct. 2020 Oct. 2020 Oct. 2020 Oct. 2020 Aug. 2020 July 2020 June 2020
Insurance Capital Markets Insurance Data and Analytics Insurance Insurance Corporate/Diversified Capital Markets Corporate/Diversified Asset/Wealth
Unit4 VerzuimSignaal B.V.
a subsidiary of
and its wholly-owned subsidiary
has agreed to merge with PropTech has acquired the venture capital arm of a portfolio company of
Acquisition Corporation via SPAC has acquired an investment in has acquired a majority stake in Series A has invested in
combination Senior Secured Notes
Growth Capital have been acquired by
a leading U.K. pension and Growth Equity has been acquired by
investment advisory business Portag3 Ventures II LP
$400,000,000
$50,000,000 $40,000,000 Preferred Equity
Advisor to Special Committee Financial Advisor Financial Advisor Financing Advisor Exclusive Financial Advisor & Placement Agent Financial Advisor Exclusive Placement Agent Placement Agent* Sellside Advisor Sellside Advisor*
May 2020 Mar. 2020 Mar. 2020 Mar. 2020 Mar. 2020 Feb. 2020 Feb. 2020 Dec. 2019 Nov. 2019 Nov. 2019
Real Estate/Mortgage Asset/Wealth Banking/Lending Asset/Wealth Banking/Lending Asset/Wealth Banking/Lending Fintech Fund Corporate/Diversified Asset/Wealth
Funds managed by
have entered into an agreement to
combine a portfolio company of a portfolio company of
has completed a recapitalization has been acquired by a portfolio company of
with has been acquired by has acquired
has been acquired by has been acquired by
and has been acquired by has been acquired by
the parent company of
has been acquired by
Fairness Opinion Sellside Advisor* Sellside Advisor Buyside Advisor Fairness Opinions Sellside Advisor Sellside Advisor Sellside Advisor Sellside Advisor Sellside Advisor
Sept. 2019 Sept. 2019 Sept. 2019 Sept. 2019 June 2019 May 2019 Apr. 2019 Mar. 2019 Mar. 2019 Mar. 2019
Banking/Lending Capital Markets Insurance Asset/Wealth Real Estate/Mortgage Capital Markets Data and Analytics Capital Markets Capital Markets Insurance
Note: List of transactions shown is illustrative, not exhaustive.
* Denotes transaction executed by firms acquired by Houlihan Lokey. 12Proven Fintech Track Record With Exceptional Momentum (cont.)
LenderLive Network
a portfolio company of
has received an investment from a portfolio company of
a division of has sold
has acquired a majority interest in Lowell has sold its payments has been acquired by
business unit in the Nordics to
has been acquired by has been acquired by
has received a minority investment
from has been acquired by has been acquired by
to and
Undisclosed Investor Group ELLIOTT
Sellside Advisor* Sellside Advisor Sellside Advisor Financial Advisor Buyside Advisor Sellside Advisor Sellside Advisor Sellside Advisor Sellside Advisor* Sellside Advisor
Feb. 2019 Jan. 2019 Jan. 2019 Dec. 2018 Dec. 2018 Dec. 2018 Nov. 2018 Oct. 2018 Oct. 2018 Oct. 2018
Capital Markets Real Estate/Mortgage Banking/Lending Banking/Lending Payments Payments Capital Markets Data and Analytics Capital Markets Real Estate/Mortgage
a portfolio company of a portfolio company of a portfolio company of has closed a funding round led by
has acquired
has been acquired by has been acquired by Structured Equity Investment has been acquired by
has been acquired by
has merged with
has been acquired by
has acquired
a portfolio company of
Sellside Advisor Financial and Tax Due Diligence Financial Opinion Sellside Advisor Sellside Advisor Sellside Advisor Sellside Advisor* Financial Advisor Financial Advisor* Financial Advisor
Oct. 2018 Oct. 2018 Aug. 2018 July 2018 June 2018 June 2018 June 2018 June 2018 May 2018 Apr. 2018
Insurance Data and Analytics Payments Data and Analytics Banking/Lending Data and Analytics Asset/Wealth Banking/Lending Data and Analytics Insurance
Funds managed by
has divested its Commercial Health
have entered into an agreement to Insurance Payer Products Business has been acquired by a portfolio company of
has been acquired by
combine to has been acquired by has been acquired by has repurchased shares from
has received an investment from has been acquired by
EQT
Vermeg Group N.G. Five Arrows Principal
a portfolio company of Verisk Analytics Francisco Partners Investments has been acquired by
and and
Moody’s Corporation
Financial Advisory Services Sellside Advisor Sellside Advisor* Sellside Advisor Sellside Advisor* Sellside Advisor* Sellside Advisor* Fairness Opinion Sellside Advisor* Fairness Opinion
Apr. 2018 Mar. 2018 Feb. 2018 Dec. 2017 Nov. 2017 Oct. 2017 Oct. 2017 Sept. 2017 Aug. 2017 Aug. 2017
Asset/Wealth Insurance Capital Markets Payments Data and Analytics Asset/Wealth Insurance Data and Analytics Data and Analytics Payments
a portfolio company of
a subsidiary of
a portfolio company of has received an investment from a portfolio company of has closed a series C has received strategic investment
financing round with from has been acquired by
has received an investment from
has been acquired by and minority-owned by
HG Capital Wadhawan Global Capital
IK Investment Partners has been acquired by
has been acquired by
has been acquired by £21 million Series C Financing
Equiniti Group PLC
and
has been acquired by
Verisk Analytics
PostFinance
Sellside Advisor* Placement Agent* Sellside Advisor Placement Agent Sellside Advisor* Sellside Advisor* Sellside Advisor* Sellside Advisor* Sellside Advisor Sellside Advisor
Aug. 2017 Aug. 2017 Aug. 2017 Aug. 2017 July 2017 July 2017 July 2017 June 2017 June 2017 June 2017
Insurance Banking/Lending Corporate/Diversified Asset/Wealth Banking/Lending Capital Markets Data and Analytics Capital Markets Payments Real Estate/Mortgage
Note: List of transactions shown is illustrative, not exhaustive.
* Denotes transaction executed by firms acquired by Houlihan Lokey. 13Disclaimer
© 2021 Houlihan Lokey. All rights reserved. This material may not be reproduced in any format by any means or redistributed without the prior written consent of
Houlihan Lokey.
Houlihan Lokey is a trade name for Houlihan Lokey, Inc., and its subsidiaries and affiliates, which include those in (i) the United States: Houlihan Lokey Capital, Inc.,
an SEC-registered broker-dealer and member of FINRA (www.finra.org) and SIPC (www.sipc.org) (investment banking services); Houlihan Lokey Financial
Advisors, Inc. (financial advisory services); HL Finance, LLC (syndicated leveraged finance platform); and Houlihan Lokey Real Estate Group, Inc. (real estate
advisory services); (ii) Europe: Houlihan Lokey EMEA, LLP, and Houlihan Lokey (Corporate Finance) Limited, authorized and regulated by the U.K. Financial
Conduct Authority; Houlihan Lokey (Europe) GmbH, authorized and regulated by the German Federal Financial Supervisory Authority (Bundesanstalt für
Finanzdienstleistungsaufsicht); Houlihan Lokey GmbH; Houlihan Lokey S.p.A.; Houlihan Lokey (Netherlands) B.V.; Houlihan Lokey (España), S.A.; and Houlihan
Lokey (Corporate Finance), S.A.; (iii) the United Arab Emirates, Dubai International Financial Centre (Dubai): Houlihan Lokey (MEA Financial Advisory) Limited,
regulated by the Dubai Financial Services Authority for the provision of advising on financial products, arranging deals in investments, and arranging credit and
advising on credit to professional clients only; (iv) Singapore: Houlihan Lokey (Singapore) Private Limited, an “exempt corporate finance adviser” able to provide
exempt corporate finance advisory services to accredited investors only; (v) Hong Kong SAR: Houlihan Lokey (China) Limited, licensed in Hong Kong by the
Securities and Futures Commission to conduct Type 1, 4, and 6 regulated activities to professional investors only; (vi) China: Houlihan Lokey Howard & Zukin
Investment Consulting (Beijing) Co., Limited (financial advisory services); (vii) Japan: Houlihan Lokey K.K. (financial advisory services); and (viii) Australia: Houlihan
Lokey (Australia) Pty Limited (ABN 74 601 825 227), a company incorporated in Australia and licensed by the Australian Securities and Investments Commission
(AFSL number 474953) in respect of financial services provided to wholesale clients only. In the European Economic Area (EEA), Dubai, Singapore, Hong Kong,
and Australia, this communication is directed to intended recipients, including actual or potential professional clients (EEA and Dubai), accredited investors
(Singapore), professional investors (Hong Kong), and wholesale clients (Australia), respectively. Other persons, such as retail clients, are NOT the intended
recipients of our communications or services and should not act upon this communication.
Houlihan Lokey gathers its data from sources it considers reliable; however, it does not guarantee the accuracy or completeness of the information provided within
this presentation. The material presented reflects information known to the authors at the time this presentation was written, and this information is subject to
change. Houlihan Lokey makes no representations or warranties, expressed or implied, regarding the accuracy of this material. The views expressed in this material
accurately reflect the personal views of the authors regarding the subject securities and issuers and do not necessarily coincide with those of Houlihan Lokey.
Officers, directors, and partners in the Houlihan Lokey group of companies may have positions in the securities of the companies discussed. This presentation does
not constitute advice or a recommendation, offer, or solicitation with respect to the securities of any company discussed herein, is not intended to provide information
upon which to base an investment decision, and should not be construed as such. Houlihan Lokey or its affiliates may from time to time provide investment banking
or related services to these companies. Like all Houlihan Lokey employees, the authors of this presentation receive compensation that is affected by overall firm
profitability.
14CORPORATE FINANCE
FINANCIAL RESTRUCTURING
FINANCIAL AND VALUATION ADVISORY
HL.com
15You can also read