Unified Fashion Journey: Demand-Driven Merchandising Strategies
←
→
Page content transcription
If your browser does not render page correctly, please read the page content below
JANUARY 2021 • STRATEGY

Unified Fashion
Journey: Demand-
Driven Merchandising
Strategies
Introduction | Research & Strategy | Assortment Planning &
Sourcing | Manufacturing & Shipping | Operations & Analysis |
Key Next Steps

Written by Nur Atiqah Kamarudin, Senior Business Intelligence Analyst
JANUARY 2021 • STRATEGY

Introduction
Key Insights
•   New Data Integration: The increasingly crowded online space calls for
    a new business operating model known as the Unified Fashion
    Journey, which focuses on demand-driven merchandising with internal
    and external e-commerce data to achieve market visibility and win
    consumers.

•   Tiered Pricing Strategy: Reviewing competitors’ activities with a
    demand-led perspective not only validated Pull & Bear and
    Stradivarius’ trade success with good-better-best pricing, but also
    uncovered an optimising opportunity for the former on Jeans at USD
    20-30 price range.

•   Slow-Moving Categories: Identifying slow-movers is as important as
    understanding bestsellers. H&M’s ageing products need to be
    addressed to start the new year with a healthy inventory level.

As stated in The State of Fashion 2021 by Business of Fashion and
McKinsey & Company, the digital adoption has soared during the Covid-
19 pandemic with businesses expecting online channels to grow by 20%
in 2021. However, with tough trading conditions expected to persist,
demand for fashion is unlikely to return to pre-pandemic level. Many
brands have taken the data-driven route with proven success, as the
pandemic has accelerated the demand for all things digital throughout
the fashion value chain.

                                                                            Instagram @hm
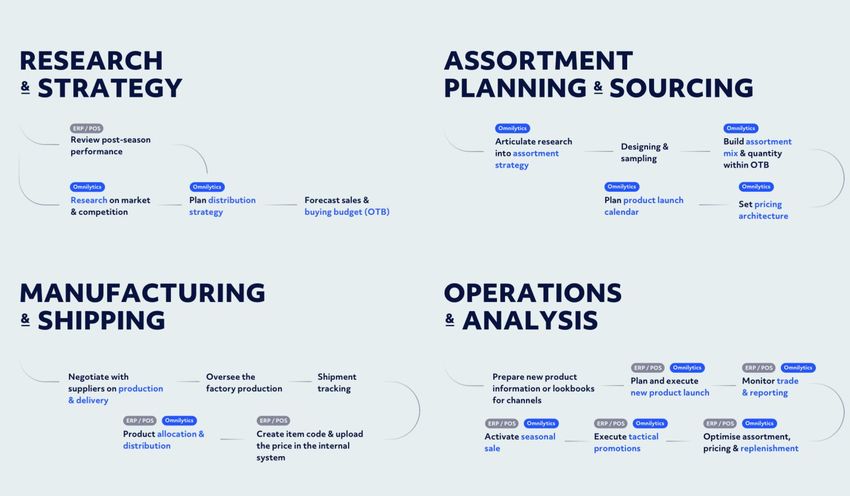
JANUARY 2021 • STRATEGY

Introduction (cont’d)
To empower brands in making informed decisions in the new normal,
Omnilytics has developed the Unified Fashion Journey operating model
to deliver data-backed insights.

Incorporate Insightful Data From Start to Finish
Supporting the four main retail processes:
• Research & Strategy: The process of researching on market is now
  backed with insights on consumer demand and competition. With
  Omnilytics’ data validation in this process, brands can accurately
  forecast sales and optimise OTB to maximise margins.
• Assortment Planning & Strategy: Omnilytics supports the creative
  process of building a product mix by factoring in data-backed trends,
  prices and consumer demand.
• Manufacturing         &    Shipping:      Optimise       product      allocation     and
  distribution by evaluating channels’ performances. Omniltyics helps to
  assess and identify the right platform to meet a brand’s positioning and
  business goals.
• Operations & Analysis: Brands can react quickly and with confidence,
  backed by insights on the market and competition landscape.

This report demonstrates how a brand's own data when combined with
market e-commerce data can provide a business with a holistic
perspective for effective actions. Over 300,000 data points were
screened from July to December 2020 across womenswear categories on
these key US fashion retailers:
1. Asos                                   6. Pull & Bear
2. H&M                                    7. Fashion Nova
3. Zara                                   8. Forever 21
4. Topshop                                9. Stradivarius
5. River Island                           10. Bershka
 All data used in this report comes from products retailing online as tracked by Omnilytics,
 unless otherwise mentioned.

CHART 1: TRADE ANALYSIS BY RETAILER
JANUARY 2021 • STRATEGY

Research & Strategy
Uncover Insights Through Research
Market research is the first important task for every successful business.
It minimises risks when making key business decisions, with insights on
competition as well as validated consumer demands and trends.

In this current climate, a thorough market research should be done
consistently to monitor the shift in demand and the latest trends. With
Omnilytics’ dashboard, brands can quickly access the relevant insights in a
snapshot without having to manually click on competitors’ websites for
information, as seen in Chart 1.

Identify Direct and Indirect Competition
With a market size projected to reach USD1 trillion in 2025, the fashion
industry is facing fierce competition with retailers and brands scaling        Are you an Omnilytics Dashboard subscriber? Click here to see detailed analysis on retailers’ performance.
omnichannel strategies to capitalise on the e-commerce boom.
                                                                                CHART 2: BRAND POSITIONING MAP

To rise above the competition, it is pivotal for brands to first understand                                                              Sell-Out Rate (%)
                                                                                                                                       High Demand Accuracy
their position in the market and against direct competitors before                                                                                   100

crafting action plans.

                                                                                                                                                     75
Developing a brand positioning map is now effortless using Omnilytics’
Competitor Benchmarking module (Chart 2). With greater visibility on
                                                                                                                                                                                            Avg sell-out 56 %
current positioning, brands now have the clarity to determine where to
                                                                                                                                                                                                  Median
reposition themselves. The outcome of this decision will lead to strategies   Weak Brand    0                 10                20                                   40                50    60   Price (USD)
that will realise the new positioning.                                        Perception                                                                                                          Strong Brand
                                                                                                                                                                                                  Perception
                                                                                                                                                     25

                                                                                                                                                     0

                                                                                                                                        Low Demand Accuracy
JANUARY 2021 • STRATEGY                                                       CHART 3: TRADE ANALYSIS BY CATEGORY FOR H&M

Assortment Planning & Sourcing
Reflecting on the immediate previous season’s performance is now more
crucial than against the past season, to identify the right assortment mix
for future strategies. As the pandemic has worsened fashion’s excess
inventory issue and proliferated markdowns, assortment planning is a key
area to get right. This can be done by taking a demand-focused approach
to the assortment strategy to increase full-price sell-through.

Identify Validated Demand Shifts
Overall, H&M’s performing and underperforming categories were in line
with the ‘new normal’ lifestyle. With the waist-up dressing gaining
popularity during the pandemic, Tops and Outerwear performed strongly
at full price.

In contrast, Dresses warrants a risky category, registering a lower than
average sell-out rate despite the high average discount. With low demand
for going-out attire, brands should trade cautiously within this category.
Granular analysis on a subcategory level will help brands identify the type
of dresses that are in demand to invest in.

Find Opportunities to Optimise
Understanding the relationship between category mix and performance            Want to see how H&M’s individual category performed for FW20? Click here to find out more, if you are an Omnilytics Dashboard
                                                                               customer.
enables brands to uncover category opportunities. In the case of H&M,
Intimates was a category of focus as it delivered an above average full
price sell-out. Similarly, the brand should also capitalise on the ongoing
popularity of Activewear, as it performed strongly in both sell-out
metrics.

While Maternity Wear did not trade as strongly at full price, the limited
assortments by competitors gives H&M the opportunity to optimise to                                                                                                                                            5
an authoritative positioning in the category.
JANUARY 2021 • STRATEGY                                                      CHART 4: TRADE ANALYSIS BY CATEGORY FOR H&M

Assortment Planning & Sourcing
(cont’d)
Drilling further into Tops, it is apparent that subcategories which can be
doubled up as loungewear performed exceptionally well. These included
T-Shirts, Tank Tops, Cami Tops and Crop Tops, which delivered strong
full price sell-outs despite high discounted product contributions (Chart
4).

While Bodies only accounted for 3% of total Tops assortment, the
subcategory showed great potential as its sell-out rates were above the
category average. The style, which was trending in the market since
Spring 2020, cemented itself as a must-have item in Fall (Chart 5).

                                                                             How did the Tops subcategories perform? Click here.

                                                                             CHART 5: TREND PERFORMANCE FOR TOPS IN THE US MARKET

                                                                                                                                                                           6
                                                                             Discover the trending Tops subcategories in the US using the Trend Performance module here.
JANUARY 2021 • STRATEGY                                                          CHART 6: TRADE ANALYSIS BY CATEGORY FOR COMPETITORS

Assortment Planning & Sourcing
(cont’d)
Spot New Opportunities
Reviewing external market and competitors’ data is not consistently
practised by most brands but it is an important step to discover new
areas for expansion. With Omnilytics, brands have complete visibility into
competitors’ category performance and products on demand all in one
place, at the click of a button.

The top three biggest categories by competitors yielded similar results as
H&M’s. While analysing the trade of six key retailers (Chart 6), Jeans and
Shorts cropped up as opportunities with strong performance across total
sell-out and sell-out at full price. The former category’s full price sell-out
was led by Inditex’s Pull & Bear and Stradivarius. This shows how external
data is important in uncovering potential assortment gaps in ensuring
competitiveness.                                                                  Look at how competitors’ categories performed in FW20 here.

As Jeans and Shorts were underperformers in H&M (Chart 3), this should
prompt the brand to investigate why they failed to work, alongside
determining what drove customers to purchase these from competitors.

                                                                                                                                                7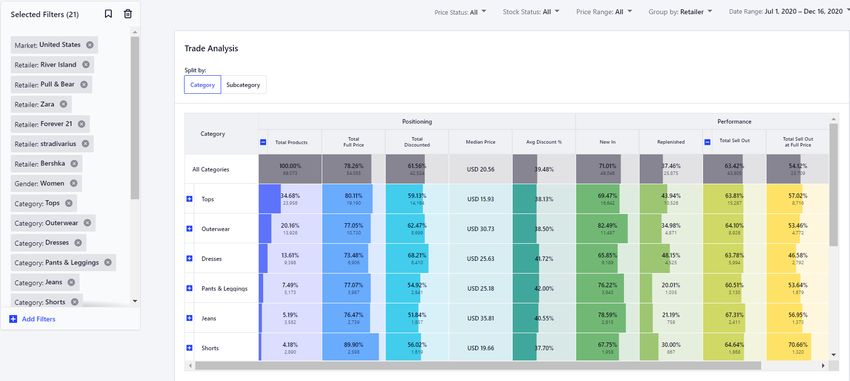
JANUARY 2021 • STRATEGY                                                         CHART 7: PRICE BREAKDOWN OF WOMEN’S JEANS BY RETAILER

Assortment Planning & Sourcing
(cont’d)
Reviewing     competitors’    pricing    by   category,     subcategory   and
fashionability attributes provides the accurate market perceived value for
every product. Insights gained from this granular level are crucial to
constantly optimise pricing ladders to remain competitive and relevant.

Go Granular on Good-Better-Best Pricing
Despite pricing at 19% higher than the average median price, Pull & Bear
delivered an effective good-better-best strategy. The distinctive product
attributes translated into demand, as each pricing tier held high sell-out
rates (Chart 7). However, this also revealed a white spot in the lower tier
of its ‘better’ pricing at USD 20-30, where majority of H&M and
Stradivarius’ Jeans were concentrated at.

As shown in Chart 7, H&M’s low median price failed to drive strong sell-
out for the brand. This is due to the lack of variety and distinction for its
Jeans, especially in the ‘good’ and ‘better’ fashionability tiers.              Want to see how you can uncover insights into competitors’ good-better-best pricing strategy? Click here.

                                                                                CHART 8: GOOD-BETTER-BEST PRICING OF WOMEN’S JEANS BY RETAILER

                                                                                 Women’s Jeans                     Good                                  Better                                      Best

                                                                                                     USD 0-20                             USD 20-40                                > USD 40
                                                                                                     • Essential jeans                    • Minimal worn details – faded,          • Classic style with worn details
                                                                                 H&M
                                                                                                     • Regular skinny ankle jeans           ripped                                 • Made of high quality fabrics - ultra-
                                                                                                     • Light fabric                       • Includes wide leg and straight cut       flexible stretch, shaping features

                                                                                                     USD 10-20                            USD 20-40                                USD 40-50
                                                                                                     • Basic skinny jeans                 • Worn details – washed, ripped          • Highly worn details – frayed, large rips
                                                                                 Pull & Bear
                                                                                                     • Clean, minimal design              • Trendy – slouchy fit, elastic waist,   • More progressive – patchwork design,
                                                                                                                                            flare cut                                cuffed elastic hem

                                                                                                     USD 10-20                            USD 20-40                                USD 40-50
                                                                                                     • Essential jeans                    • Skinny, slim-fit jeans                 • Paperbag, wide-leg jeans
                                                                                 Stradivarius        • Minimal design                     • Coloured                               • Progressive – patchwork design,
                                                                                                     • Baggy twill jeans in seasonal                                                 ripped, pearl beads
                                                                                                       colours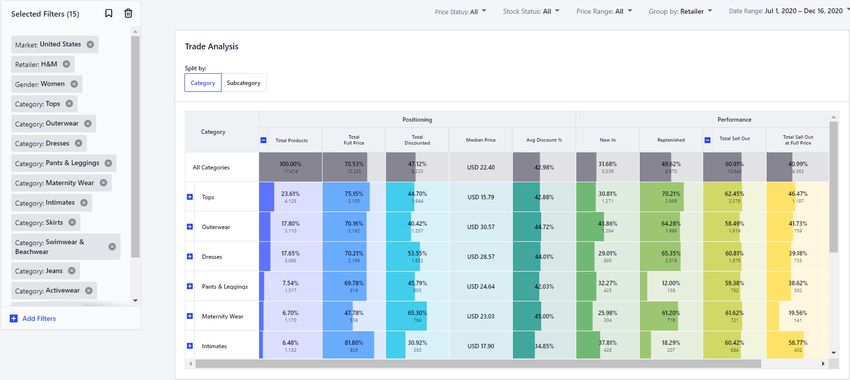
CHART 9: GOOD-BETTER-BEST FASHIONABILITY BY BRAND FOR WOMEN’S JEANS
JANUARY 2021 • STRATEGY
                                                                          Good                                               Better                                             Best

Assortment Planning & Sourcing
(cont’d)
Pull & Bear and Stradivarius provided detailed attributes that
corresponded more clearly across the different denim fits, cuts, styles
and finishes.

With comfort continues to reign across apparel categories in the new
normal, fit becomes key in driving demand. While skinny remains the
growth driver, wide leg, flare, slouchy and mom jeans gained popularity
with 30% contribution in sell-out.

Meanwhile, H&M offered mostly basic styles, lacking varieties and clear
product differentiation across pricing tiers.

                                                                                                                                                                                                        9

                                                                          Click into the circles at each price bracket on the chart to see all the products based on good-better-best fashionability.
JANUARY 2021 • STRATEGY                                                         CHART 10: TRADE ANALYSIS BY RETAILER

Manufacturing & Shipping
Evaluate the Right Channel
Brands are not only pivoting to e-commerce during the pandemic, but
also expanding to multiple online distribution channels. Omnilytics
supports assessing the available distribution channels to pin down the
right ones that meet brand positioning and business goals.

Looking at the retailers that share similar median prices on fast fashion
Jeans, Asos’ performance was the most promising. The retailer’s sell-out
rate was driven by full price despite the high discounted products at 86%.
While this indicated an opportunity to drive full price sell-out on Asos as a
channel, a new brand will need to strategise competing against over 190         Identify and compare the different distribution channels with similar median price here.
brands on the site. Among the strategies brands can take include:
   •   Tailor assortment according to consumer profile and preferences.         CHART 11: TRADE ANALYSIS BY RETAILER FOR PULL & BEAR BRAND

   •   Optimise assortment by identifying white space opportunities on a
       subcategory level.
   •   Spot pricing gaps based on product distribution and sell-out.

In the case of Pull & Bear, the brand managed to maximise its potential on
Asos as its Jeans traded strongly at full price (Chart 11). The brand
offered styles that were in line with the current consumer demand on the
site, with 60% of its products consisted of loose and relaxed fits.

                                                                                Analyse the performance of Pull & Bear’s Jeans from the marketplace vs. own e-commerce store here.
CHART 12: NEW-IN VS FIRST DISCOUNT BY MONTH FOR ZARA
JANUARY 2021 • STRATEGY
Operations & Analysis
In a crowded online space, brands need to nail the perfect launch timing
to cut through the noise, in addition to crafting the right messaging.
Omnilytics’ Calendar module shows insights on competitors’ launch
activities, be it new arrivals, promotions or sale events. Equipped with the
relevant data, brands can make informed decision to time launch along
with or away from competition.
Monitor Competitors’ Product Launch Strategy to Stay Ahead
Zara had managed to keep its markdown activities to its usual cycle even
during the pandemic, which was a biannual seasonal sale in June and
November (Chart 12). It continued to practice reducing the number of
newness during seasonal markdowns to avoid cannibalising on its full-
priced products.
Analysing the new-in by date helps identify competitors’ launch patterns.
Friday was the most popular day to launch new arrivals for Zara and
H&M. However, Zara had the advantage of capturing a larger market
share as it focused on launching early in the week, on Monday and
Click here to see Zara’s New-In and First Discount strategy from the Calendar module.
Tuesday, compared to H&M on Wednesday (Chart 13).
CHART 13: NEW-IN BY DATE FOR H&M
With this insight, brands can have effective launch strategies by picking
the best possible launch dates to stay ahead of competition.
Compare H&M’s product launch strategy here.JANUARY 2021 • STRATEGY CHART 13: AGEING BY RETAILER
Operations & Analysis (cont’d)
Consistent Monitoring and Regular Actions
Maintaining a healthy inventory is critical in improving sales performance.
However, clearing out seasonal inventory blindly is risky especially in this
current climate where consumer preferences and behaviours are vastly
changing. Retailers such as Dillard’s and Kohl’s have seen improved
profitability as a result of consistent monitoring, coupled with aggressive
and smart inventory clearance measures.
Omnilytics’ Ageing Analysis module helps brands to track and analyse
Click here to analyse Zara and H&M’s ageing inventory through the Ageing Analysis module.
performance against online presence ageing easily and combine these
insights with internal inventory ageing data for quick rectifying actions.
CHART 14: AGEING BY CATEGORY FOR H&M
Perform Granular Analysis for Effective Inventory Management
While H&M recorded a strong performance during the season, its
products aged more than 180 days warrant an immediate action to clear
out. Targeting the problematic areas of the inventory revealed Swimwear
& Beachwear to be among the slow-movers with the lowest sell-out rate.
A deeper dive into the products showed 105 bikinis and swimsuits were
never discounted despite being more than 270 days old. Similarly, going-
out styles in Dresses should also enter deep markdowns as some were
aged more than 450 days and in broken sizes.
Learn which slow-moving categories that impacted H&M’s performance here.JANUARY 2021 • STRATEGY Key Next Steps Incorporate Insightful Data: The e-commerce data is now more valuable than ever as online sales are projected to grow rapidly. With a fashion market insights tool like Omnilytics, brands can employ it at every stage, from product development to operations, as outlined in the Unified Fashion Journey operating model. As demonstrated in Chart 5 and 6, having the external views and competitors’ data are crucial in helping brands identify gaps and opportunities in the market. A holistic view presents greater market visibility to empower brands in making informed decisions with confidence. Identify and Validate Consumer Wants: As the pandemic continues to affect the shift in consumer preferences and behaviour, brands must pay attention to the demand signals and react to them quickly. Validated by data, the pandemic hero categories such as Tops, Activewear, Intimates and Loungewear are still performing strongly at full price. However, with the vaccine discovery, consumers might look forward to dressing up again, causing another shift in demand. To stay competitive, brands should utilise Omnilytics’ e-commerce market data to capture demand shift early and validate it to plan next steps. Optimise Assortment and Pricing: With the right assortment offering, brands can achieve sales conversion target, as demonstrated by Inditex’s brands Pull & Bear and Stradivarius. However, assortment optimisation should go hand-in-hand with pricing. Based on Chart 7, the good-better- best pricing strategy for Jeans demonstrated the market perceived value of the product. To remain competitive, Pull & Bear should consider filling in the white spot opportunity in the USD 20-30 bracket. Instagram @stradivarius
Definition of Key Metrics

Metric                         Description

                               The total count of stock keeping unit (SKU) i.e. the number of styles that a brand offers. In the report context, it is the total product count
 Assortment SKUs Count
                               within a data set.

 Popularity Score              Popularity score takes into account product age, replenishment factor and discount rate over time.

                               Trend score is the average popularity score in the last 6 months. It is the difference in popularity score between current category and all
 Trend Score                   categories. If current category score is above all categories average, the line will be green, and the score will be positive. The more popular a
                               category relative to other categories is, the higher is the score. The less popular categories will be red, with a negative score.

 Median Price                  Refers to the price of the product at the mid point of the data set.

 New-In                        The products that are newly added to the retail website within the timeframe selected.

 New-In Contribution %         Calculated by adding the number of new-in product count over the total new-in count within a data set.

 Discounted                    The products that were listed with a markdown within the time frame selected.

 Sell-Out                      A product registers a sell-out event when it is indicated as out-of-stock or no longer published on the website.

 Sell-Out Rate                 Calculated by dividing the number of out-of-stock product count over the total product count within a data set.

                               Signals consumers’ willingness to pay at full price. It is calculated by dividing the number of out-of-stock product count at full price over the total
 Sell-Out Rate at Full Price
                               number of out-of-stock product count.

 Sell-Out Contribution         Calculated by dividing the number of sell-out product count over the total sell-out count within a data set.
www.omnilytics.co Get in touch Omnilytics is a fashion analytics company that helps brands and retailers – born to make data accessible and insights actionable so that businesses can make decisions with confidence and speed. At the core of what Omnilytics does is the belief that information is power; pairing deep industry expertise and ground-breaking technical innovation to bolster businesses’ agility with data-driven insights. Find out more
Similar Industry Reports

                                                                See more Industry Reports

 MAY 2020 • STRATEGY            JULY 2020 • STRATEGY

 Merchandising Strategies for   Everlane’s Successful
 the New Normal                 Essentials with Right Pricing
You can also read


