14 November 2018 INVESTOR DAY - Amazon AWS
←
→
Page content transcription
If your browser does not render page correctly, please read the page content below
INVESTOR DAY
14 November 2018
DISCLAIMER
The information in this presentation was prepared by EBOS Group Ltd with due care and attention. However, the information is supplied
in summary form and is therefore not necessarily complete, and no representation is made as to the accuracy, completeness or
reliability of the information. In addition, neither the EBOS Group nor any of its subsidiaries, directors, employees, shareholders nor any
other person shall have liability whatsoever to any person for any loss (including, without limitation, arising from any fault or negligence)
arising from this presentation or any information supplied in connection with it.

This presentation may contain forward-looking statements and projections. These reflect EBOS’ current expectations, based on what it
thinks are reasonable assumptions. EBOS gives no warranty or representation as to its future financial performance or any future matter.
Except as required by law or NZX or ASX listing rules, EBOS is not obliged to update this presentation after its release, even if things
change materially. This presentation does not constitute financial advice. Further, this presentation is not and should not be construed as
an offer to sell or a solicitation of an offer to buy EBOS Group securities and may not be relied upon in connection with any purchase of
EBOS Group securities.

This presentation contains a number of non-GAAP financial measures, including Gross Profit, Gross Operating Revenue, EBIT, EBITDA,
Underlying EBITDA, NPAT, Underlying NPAT, Underlying Earnings per Share, Free Cash Flow, Net Debt and Return on Capital Employed.
Because they are not defined by GAAP or IFRS, EBOS’ calculation of these measures may differ from similarly titled measures presented
by other companies and they should not be considered in isolation from, or construed as an alternative to, other financial measures
determined in accordance with GAAP. Although EBOS believes they provide useful information in measuring the financial performance
and condition of EBOS' business, readers are cautioned not to place undue reliance on these non-GAAP financial measures.

The information contained in this presentation should be considered in conjunction with the consolidated financial statements for the
period ended 30 June 2018.

All currency amounts are in New Zealand dollars unless stated otherwise.

                                                                                                                                                2
Introduction and Group Overview
          John Cullity, EBOS Group CEO

          Healthcare
          Brett Barons, CEO Symbion

          Consumer Brands
          Sean Duggan,
          CEO Animal Care & Consumer Brands

          Financial Overview
          Shaun Hughes, CFO

          Positioned for Future Growth

 AGENDA
AGENDA
          John Cullity, EBOS Group CEO

          Site tour – new Brisbane facility

                                              3
Introduction and Group Overview
John Cullity, EBOS Group CEO
GROUP INTENT

     EBOS will focus on delivering shareholder value through
    disciplined investments in a diverse portfolio of health and
                   animal care related activities.

   Together with our trading partners, we will play an important
 role in the delivery of health outcomes to the community and we
  aspire to hold leading positions in the sectors we participate in.

                                                                       5
EBOS GROUP TODAY
Diversification within Healthcare and Animal Care is a key signature of our approach

                 HEALTHCARE                             ANIMAL CARE
COMMUNITY    INSTITUTIONAL   CONTRACT    CONSUMER     PRODUCT &                VET
                                                                   RETAIL
 PHARMACY     HEALTHCARE     LOGISTICS   PRODUCTS      BRANDS                WHOLESALE

                                                                                         6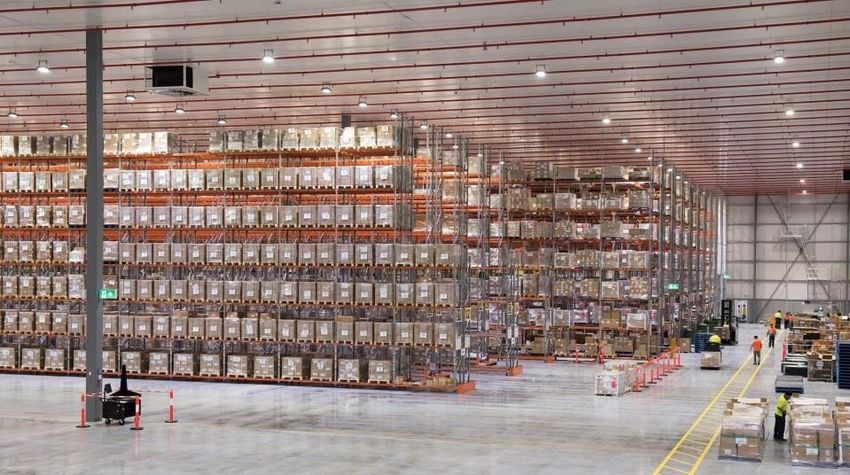
EXECUTIVE LEADERSHIP TEAM

                                                     Chief Executive Officer
                                                           John Cullity

               CEO Animal Care &   Chief Financial      Chief Information                         Group Human        Executive General
CEO, Symbion                                                                   General Counsel
                Consumer Brands        Officer                Officer                            Resources Officer   Manager, Strategy
Brett Barons                                                                     Janelle Cain
                 Sean Duggan       Shaun Hughes            Andrea Bell                           Tim Goldenberg         David Lewis

                                                                                                                                      7
EBOS STRATEGIC APPROACH
Our Healthcare and Animal Care strategic focus is centred on
Leading Market Disciplined Capital
Investing for Growth
Positions Management
We aim to have positions of Two types of investments: Cash generation to drive
scale in the markets we scope for further
operate in and maximise Acquisitions: we have a investment which allows
opportunities across our wide successful track record of deal for dividends to be paid in
range of businesses wherever execution. the range of 60-70% of
possible. EBOS has completed 20 deals Net Profit After Tax.
since 2000.
Acquisitions and new
Internal Capex: investment to business focus on
lift productivity, manage costs supporting the Group’s
and deliver better customer return on capital
service. employed.
We focus on delivering profitable growth and superior returns
8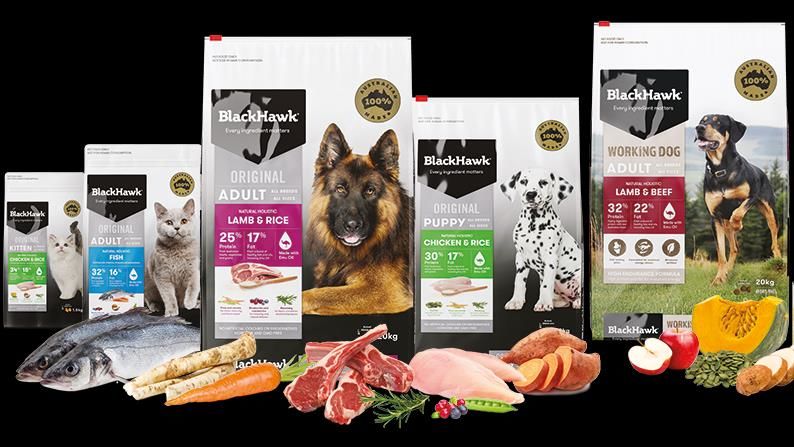
LEADING MARKET POSITIONS
EBOS Group is the largest and most diversified Australasian marketer, wholesaler and
distributor of healthcare, medical and pharmaceutical products. It is also a leading
marketer and distributor of recognised consumer products and animal care brands.

              Combined pharmacy and
                                                          Hospital pharmaceutical
              hospital pharmaceutical
                                                         wholesaler in Australia and
             wholesaler in Australia and
                                                               New Zealand
                   New Zealand

 No.1         To be the #1 Community
             Pharmaceutical wholesaler
                                                          3PL/4PL Pharmaceutical
             in Australia from July 2019
                                                          provider in New Zealand.
                    following the
                                                           Full range of services in
             commencement of trading
                                                                   Australia.
                  with the Chemist
                 Warehouse Group

                                                                Comprehensive
                                                         distribution network in the
               Pharmacy wholesaler in                     animal care market, with
                   New Zealand                           pet brands, speciality retail
                                                         outlets in NZ, and a leading
                                                            veterinary wholesaler.
                                                                                         9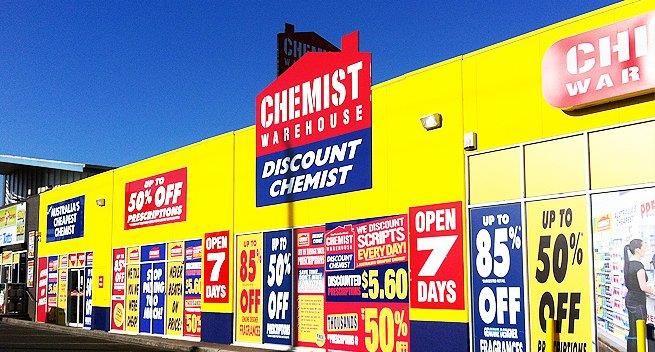
EBOS M&A APPROACH
Our M&A activity aligns with our strategy.
We buy value accretive businesses with strong management teams
and solid prospects for further growth.
We are disciplined in the prices we will pay for businesses and aim to
enhance the Group’s ROCE >15%.
Board provides valuable oversight of all M&A activity.
10INVESTING FOR GROWTH
RECENT TRANSACTIONS
Acquisition of the minority shares in TerryWhite Group Limited,
expected to complete by 31 December 2018.¹
Acquisition of Warner & Webster (31 Aug 2018). A medical &
surgical supplies wholesaler with operations in Victoria and
South Australia.
Acquisition of Ventura Health (April 2018). Management
company of Australian pharmacy retail group.
Acquisition of Gran’s Remedy (March 2018). New Zealand
leading foot care consumer health brand.
14% investment in ASX listed, MedAdvisor Ltd (October 2017).
Australia’s leading digital medication management company.
HPS (June 2017) leading provider of outsourced pharmacy
services to Australian Private Hospitals.
¹ Subject to approval of TWG minority shareholders and satisfaction of other conditions
11Healthcare Brett Barons, CEO Symbion
HEALTHCARE MANAGEMENT TEAM

                                                   CEO, Symbion
                                                    Brett Barons

Executive GM, Pharmacy     Executive GM,
                                               Executive GM, Contract   GM Wholesale & Retail
    and Institutional    Operations & Supply                                                     CFO, Symbion
                                                      Logistics              Services
       Healthcare               Chain                                                           Sharon Papworth
                                                   Michael Broome           Sab Ambroino
    Stuart Spencer          Simon Bunde

                                                                                                                  13
HEALTHCARE DIVISIONAL SUMMARY
Primary care /
Customer Community Pharmacy Hospitals Manufacturer
Aged care
Wholesale Retail Contract Logistics
2
Core
Brands &
Service
Offering
Additional
valued
services
1
¹ EBOS has a 14.1% shareholding in Medadvisor as at 30 June 2018. ² EBOS has a 25% shareholding in GPPW as at 30 June 2018. 14CHEMIST WAREHOUSE TENDER WIN
In July 2018, EBOS won the tender to act as the exclusive third party distributor of
pharmaceutical products to more than 450 stores in Australia.
EBOS expects to enter into a five-year supply agreement, to take effect from 1 July
2019, with the potential for an extension of a further 3 years.
EBOS estimates that sales to the Chemist Warehouse Group (CWG) stores will generate
approximately A$1 billion in revenue in the first full year of the agreement.
The increase in ethical sales volumes is estimated to increase our share of CSO funding
from ~ one-third to over 40%.
EBOS acts as CWG’s wholesaler in New Zealand.
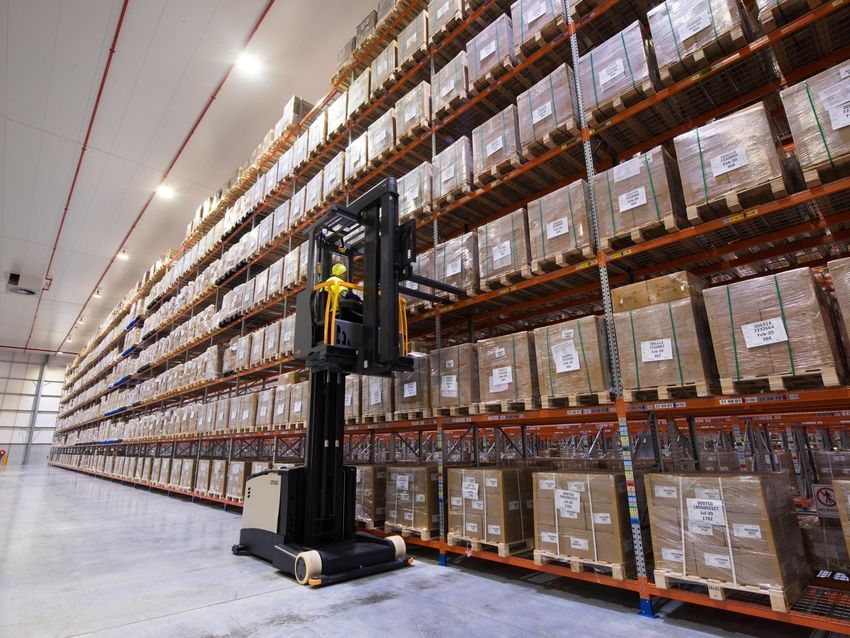
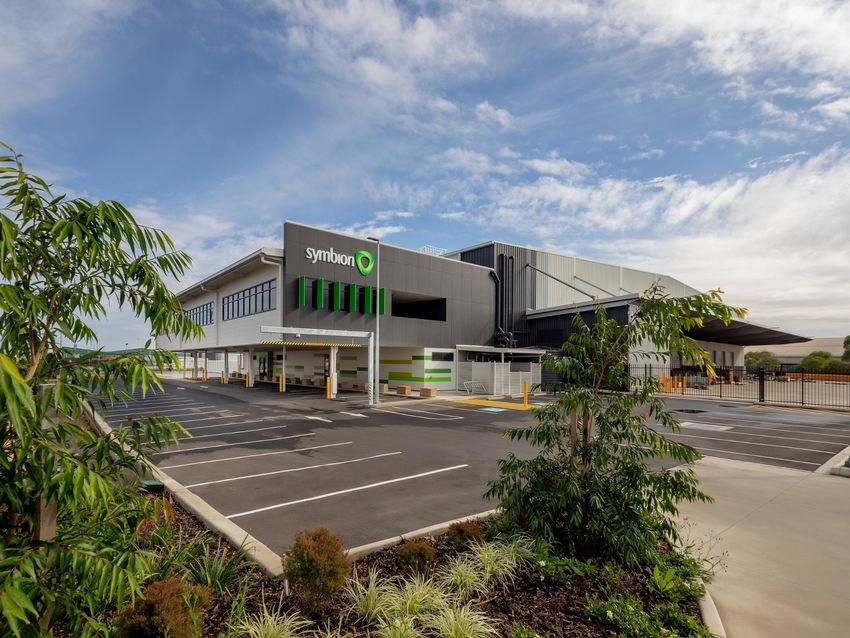
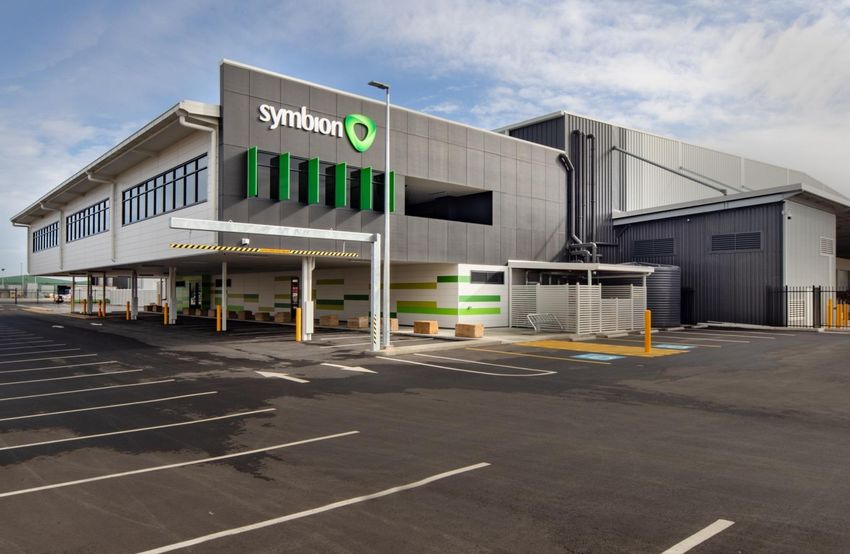
15NEW BRISBANE WAREHOUSE
High volume pharmaceutical facility –
~10,000m2
World class storage and picking systems
Highly efficient pick to person technology
16PRODUCTIVITY GAINS FROM INVESTMENTS
Significant productivity and cost improvements are expected from the new Brisbane warehouse
consistent with our investment in automation at Sydney and Melbourne.
Volume increases from 1 July 2019 will further improve productivity in all warehouses across
Australia.
VIC
opened
October 2014 Warehouse Productivity comparison: VIC vs QLD
~+50%
VIC productivity
above old QLD
site
Oct-14
Oct-15
Oct-16
Oct-17
Feb-15
Jun-15
Feb-16
Jun-16
Feb-17
Jun-17
Feb-18
Jun-18
VIC QLD
17HEALTHCARE LOGISTICS
Logistics solutions to a GMP Pharmaceutical standard to Healthcare companies for
their warehousing, distribution and related services in Australia and New Zealand.
Customers
Pharmaceutical manufacturers
(including generics & specialty).
Medical consumables.
Medical devices.
Consumer products.
Facilities
Auckland (x2), 16,000m².
Sydney, 25,000m².
Services
3PL & 4PL healthcare distribution.
Clinical trial logistics.
Secondary packaging.
Specialised programs.
18AUSTRALIAN GOVERNMENT POLICIES
Proactive engagement with the Australian Government on key policies impacting wholesale
distribution of medicines
Community Service Obligation Special Price Access
CSO Deed expires December 2018. Government seeking to reduce net
funding of high cost drugs.
Government considering options to
ensure adherence to National Various alternatives have been
Medicines Policy standards. scoped with the Pharmacy Guild,
Medicines Australia and the NPSA.
National Pharmaceutical Services
Association continues to lobby Model has not yet been agreed.
Government.
Wholesalers will seek Government
funding should additional costs be
imposed.
19HEALTHCARE STRATEGIC PRIORITIES
• Continue to drive efficiencies through cost leadership in a competitive
environment.
• Bed down Chemist Warehouse.
• Grow Healthcare Logistics in Australia.
• Increase retail presence through TerryWhite Chemmart, Ventura and other
management company investments.
• Pursue acquisition opportunities in the medical consumables sector.
20Consumer Brands Sean Duggan, CEO Animal Care & Consumer Brands
BUSINESS OVERVIEW
Business   ENDEAVOUR CONSUMER HEALTH           ANIMAL CARE

  Key           Products & Brands            Products & Brands
Brands
  and
Service
Offering

                                       Australia Wholesale Distribution

                                             New Zealand Retail

                                                                          22
CONSUMER BRANDS ROLE WITHIN EBOS
Attractive earnings
• Higher gross margin & EBIT% Brands play a key role within
our markets
• Higher growth potential
• Strong ROCE We are deeply
passionate about
helping people
Diversified earnings in a less through our brands
and helping our
people to reach their
regulated environment full potential
Consistent, reliable growth We can be the
best in the world
Profit per brand
at delivering
drives our
trusted brands
economic engine
built on sincere
belief
23CONSUMER BRANDS LEADERSHIP TEAM
CEO
Sean Duggan
EGM EGM EGM
IS/IT Manager
Commercial Director Endeavour Consumer
Australasia EBOS Asia Wholesale
Health
24OUR CORE COMPETENCIES
Leading teams of engaged employees passionate about our brands & categories
Belief based Brand building
Supply chain & logistics, leveraged off our broader network
Vendor management & sourcing
Quality control and quality assurance
Sales across FMCG & specialty environments
25PET INDUSTRY – ANZ
ANZ pet sector is worth ~$14 billion and is growing at an estimated 2% to 3% per annum¹
ANZ Pet Market by segment Market growth driven by trends towards:
humanisation of pets;
Pet
Products premiumisation of pet food and products; and
outsourcing of services like grooming, training
and obedience and dog washing.
Other
Services Australian 5 year forecast sales growth rates per
Pet Food
annum:
Pet retailers: 3.2%², with premium food
growing at faster rates.
Veterinary
Services Online pet food and pet products: 7.8%3.
Veterinary services: 2.6%4.
Sources: 1 – Management estimate based on industry reports. 2 – IBISWorld industry reports Pets and Pet Supplies Retailers in
Australia, February 2018. 3 – IBISWorld Online Pet Food and Pet Supply Sales in Australia, May 2018. 4 – IBISWorld Veterinary Services 26
in Australia, July 2018.CONSUMER HEALTH & WELLBEING - ANZ
The Consumer Health & Wellbeing market across Australia and NZ is significant and highly
fragmented across multiple product categories
Total Consumer Health & Wellbeing markets
Australia ¹ New Zealand ²
$17.4b $1.28b
Grocery Pharmacy Grocery Pharmacy
$13.2b $4.2b $900m $383m
EBOS has focussed on developing our own brands in the following sub-categories : EBOS brands
Vitamins, Minerals
& Supplements ³ $4.9b $262m
Toothpaste ⁴ $273m (total) $80m (total)
$7m (natural) $7.3m (natural)
Specialty Tea ⁴ $104m $32m
Liniments ⁴ $84m $17m
OTC Medicines ⁵ $2.5b
1 Management estimate from extrapolation of data from IBIS World reports -Supermarkets & Grocery in Australia (Oct-18) & Pharmacies in Australia Industry Report (Sep-18).
2 NZ data from IRI market data , 3 AU Data from CMA Annual Report 2018, NZ based on IRI market data , 4 Management estimates based Neilsen and Aztec scan data ,
5 Management estimate based on IBIS World Report - Pharmacies in Australia Industry Report (Sep-18) 27BLACK HAWK GROWTH
Black Hawk Sales (pre and post acquisition)
Australia’s fastest growing premium pet food brand over
the last four years, now with a leading position in the pet 23%
specialty retail channel. 48%
Range & brand extension
Investment in marketing driving increased brand 55%
awareness and retail support. 23%
In July 2017, Black Hawk was launched in the New Zealand
market and has exceeded our expectations.
Growing presence in Asian markets.
FY14 FY15 FY16 FY17 FY18
28VITAPET – CONSISTENT GROWTH
Vitapet has an extensive range of pet treats in both Grocery
and Pet Specialty
Vitapet has built very strong market positions in both Vitapet sales growth last 5 Years
Australia and New Zealand due to: 5%
7% 7%
an extensive and growing product range 8%
products having quality ingredients that are loved by
pets; and
the humanisation of pets driving premiumisation and
an increased spend per pet.
Vitapet NZ Grocery market share¹ Vitapet AU Grocery market share¹
VitaPet
Others 23%
27%
VitaPet
63% Others
77%
¹ MAT Data - Aztec Scan data period ended 14/10/18 29RED SEAL IN NEW ZEALAND
Strong market share in New Zealand supermarkets across key categories ¹
Vitamins - Grocery Specialty Teas - Grocery Natural Toothpaste - Grocery
Red Seal Red Seal
Red Seal
¹ Data based on IRI scanned sales market share data Aug-18. 30ASIA – CONSUMER BRANDS OPPORTUNITY
Asia, especially China, wants brands that are trusted and successful in our
own home markets
The important role of brands in our categories are just as relevant in Asia
Viewed as an important ‘third leg’ of growth for EBOS
Our Asian strategy:
Tailored for each brand and market
Establish a physical presence in China
• Speed up responsiveness to market needs
• Localise offering & execution
31CHINA’S PET FOOD MARKET
A growing export opportunity
• China’s Pet Food market is growing at >30% pa.
• Households owning a pet in China is ~5% vs Australia & NZ ~60%
China Pet Food Market overview & 5 Year Forecast
50,000 45% 50%
44,851
Chinese Dog & Cat Retail Food market
45,000 45%
40,000 37% 40%
36,743
(Chinese RMB - million)
33%
Annual Growth rate %
33%
35,000 35%
30% 29,875
30,000 27% 27% 30%
25%
23% 22%
25,000 25%
18,956 23,984
20,000 20%
14,591
15,000 10,968 15%
10,000 8,009 10%
4,137 5,507
5,000 5%
0 0%
2014 2015 2016 2017 2018 2019F 2020F 2021F 2022F 2023F
Dog&Cat food Retail Value in RMB Million (LHS) Market Annual Growth rate % (RHS)
Source: Euromonitor International Pet Care in China May 2018
32SUMMARY - CONSUMER BRANDS
Our role within the wider EBOS group is to deliver enduring profitable growth
Future opportunities are strong:
Build out existing brands & markets
Continued Asian expansion
Acquire new ‘seed’ brands to take advantage of our existing infrastructure
33Financial Overview Shaun Hughes, EBOS Group CFO
CAPITAL ALLOCATION
Proven record in delivering superior returns from investment in existing businesses whilst
leveraging financial strength & cash flow generation to invest in adjacent & new opportunities

 1                                                            2
       Portfolio of strong Trans-tasman businesses                Leveraging financial strength to invest in
       with good momentum and cash generation                     adjacent & new business opportunities
     • Opportunities to invest & drive continued growth in    • Established capabilities to evaluate & execute M&A
       existing portfolio of businesses with leading market     opportunities for long-term growth
       positions
                                                              • Framework to encourage new business initiatives
     • Capital & resources available to support divisional      and leverage existing assets
       strategy & execution
     • Good balance between Divisional autonomy and
       Corporate support

               Strict criteria & financial discipline applied to all investment decisions

                 Strong commercial capabilities across Corporate office & divisions

                                                                                                                     35
SHAREHOLDER DISTRBUTIONS
Delivering long-term returns to shareholders
Dividends Per Share (NZ$ cents)
• We believe we have the right balance
H1 H2
between shareholder distributions and
35.5
retaining sufficient funds for further 32.5
33.0
Cents per share
investment. 20.5
25.0
33.0
• Target dividend pay-out ratio is between 20.5 22.0 26.0 30.0
60-70% of Net Profit After Tax (NPAT).
FY14 FY15 FY16 FY17 FY18
• Dividends are 100% franked for Australian Underlying Earnings Per Share (NZ$ cents)
resident shareholders.
Cents per share
98.5
84.0 91.3
62.8 70.8
FY14 FY15 FY16 FY17 FY18
36BALANCE SHEET & DEBT MANAGEMENT
Debt Maturity Profile – current facility limits (A$m)
Strong balance sheet
• Average maturity of term debt & securitisation
facilities of 3.4 years at 30 June 2018.
• Focus on maintaining ROCE above 15.0%. 400
293
161
Net Financial debt of NZ$471m (A$432m) at 30 64 50
-
June 2018 (Gearing 1.74x) FY19 FY20 FY21 FY22 FY23
• Recent acquisition of Warner & Webster and Cash advance facility Term debt facilities Securitisation
Terry White investment will modestly increase
Return on Capital Employed
gearing in 1H FY19.
• Inventory build expected to start Q4 FY19 (in
relation to CWG) of approximately $100m.
16.4% 16.4%
15.8%
13.7%
12.8%
FY14 FY15 FY16 FY17 FY18
37FINANCIAL AND CAPITAL CONSIDERATIONS
Focus on maintaining our:
Industry leading cash conversion cycle (Cash conversion days: 15 at Jun-18).
Strong credit disciplines balance sales and credit risk.
Disciplined capital allocation approach.
Strong balance sheet with capacity for acquisition opportunities.
ROCE >15%.
Acquisition and internal investments to be earnings accretive and deliver acceptable
returns on capital employed.
Deliver returns to shareholders.
5 Year Underlying EBITDA (NZ$m)
FY18 272.4
FY17 241.4
5 Year
CAGR
FY16 225.5
+11.6%
FY15 196.7
FY14 175.4
38Positioned for Future Growth John Cullity, EBOS Group CEO
STRATEGIC FOCUS AREAS FOR GROWTH
Continue to execute on both organic growth and strategic value
accretive acquisitions.
Leverage our position as the lowest cost wholesaler / distributor.
Expand our presence in community pharmacy.
Build and acquire brands that consumers value.
Expand our brands into Asian markets.
40Site Tour – New Brisbane Facility OHS Bus departing at 11.15am, returning to the Stamford at 1.00pm.
You can also read