COVID-19 Vaccine Equity Metric Evaluation Brief - Minnesota ...
←
→
Page content transcription
If your browser does not render page correctly, please read the page content below
MINNESOTA DEPARTMENT OF HEALTH

       COVID-19 Vaccine Equity Metric
              Evaluation Brief
7/29/2021

Context
The Minnesota Department of Health (MDH) prioritized vaccination throughout the state in a phased approach.
Given their burden and vulnerability to severe COVID-19 after infection, seniors (i.e., adults age 65 and over) were
prioritized early in Minnesota. It became clear in the early weeks of 2021 that an additional intentional allocation
strategy was needed to advance racial equity as gaps began to emerge by race and ethnicity. On February 6, 2021,
13.8% of non-Hispanic white Minnesotans had at least one dose of vaccine, compared to 7.7% of Black/African
American, 4.8% of Hispanic, and 8.0% of Asian/Pacific Islander Minnesotans. Tribes had their own allocation
criteria and as such, not only had higher vaccine coverage (17.2%) but had also vaccinated other community
members who lived in counties near reservations.

Persistent disparities in vaccination coverage by race and ethnicity necessitated strategic action toward health
equity. To that end, congruent with the recommendations of leading thinkers in the topic of vaccine ethics, the
MDH moved to address equity by using place-based strategies to allocate vaccine doses that incorporated a
metric of community need of which race/ethnicity was one of several factors.1-4

Using the CDC’s Social Vulnerability Index (SVI),5 MDH ranked the ZIP code areas of the state and divided them
into quartiles (with quartile 1 (Q1) being areas of highest disadvantage to quartile 4 (Q4) having the lowest
disadvantage) based on their SVI score. These quartiles were then used to compare the vaccination rates of
Minnesotans based on vulnerability/disadvantage. One main way MDH operationalized our equity metric was to
determine a specific allocation percentage prioritized for communities hit hardest by the COVID-19 pandemic
using the SVI ZIP code quartiles.

Table 1 presents descriptive information about the demographics of residents in each SVI quartile. Multiple
reports continue to find that SVI is associated with COVID-19 burden; nationally, this finding has been identified at
the county level, and within Minnesota, our data continues to show the disproportionate impact of COVID-19.6-7

People of all ages living in high-SVI ZIP codes represent 29% of Minnesota’s population, but represent 32% of
Minnesota’s COVID-19 cases, 39% of hospitalizations, and 38% of deaths. Among Minnesotans age 16 and under,
people in Q1 SVI ZIP codes represent 41% of hospitalizations. Drawing from the example of California, which
prioritized equity by allocating vaccine doses proportionate to the burden of COVID-19 in its most disadvantaged
areas, we set an allocation goal of 40% of weekly vaccine doses being administered to Minnesotans living in Q1
SVI ZIP codes.

                                                       1 of 10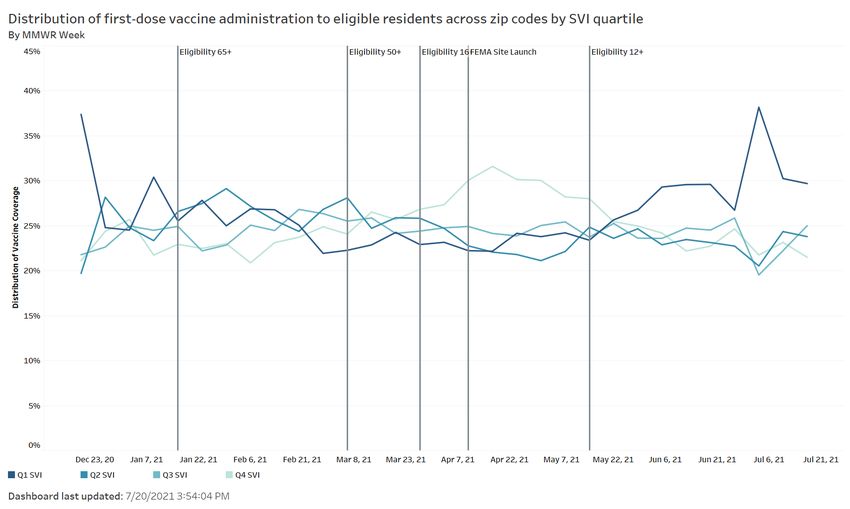
VACCINE EQUITY METRIC EVALUATION BRIEF

Table 1. Demographics of SVI Quartiles in Minnesota
                               Q1 SVI (High)               Q2 SVI                    Q3 SVI               Q4 SVI (Low)
Race/Ethnicity
American Indian or                 54%                      17%                        8%                        7%
Alaska Native
Black or African                   53%                      20%                       11%                        9%
American
Hispanic or Latinx                 47%                      22%                       17%                      14%
Asian or Pacific                   24%                      22%                       22%                      26%
Islander
White                              24%                      22%                       22%                      26%
Multiple                           35%                      23%                       16%                      20%
Other                              39%                      24%                       14%                      20%
Other Characteristics
Limited English                    59%                      17%                        9%                        9%
Proficiency
Living with
Disabilities                       34%                      23%                       19%                      18%

MN
Medicaid/MNCare                    43%                      23%                       17%                      17%
enrollees
Total Population                   29%                      22%                       22%                      26%

This table shows the percentage of each category in each SVI quartile (e.g., 59% of Minnesotans with limited English
proficiency live in Q1 SVI ZIP codes). All data is based on ZIP codes. Totals may not add up to 100% due to some ZIP codes
having a missing SVI quartile value. Data source: 2015-2019 ACS Estimate.

Table 2. COVID-19 Burden by SVI Quartile, All Ages
                        Q1 SVI (High)                   Q2 SVI                     Q3 SVI                 Q4 SVI (Low)
Indicator            Number       Percent      Number        Percent      Number        Percent       Number          Percent
COVID-19
cases                125,689        32%         88,638           23%       83,239           21%       94,888           24%

COVID-19              8,182         39%          4,681           22%        4,057           19%        4,162           20%
hospitalizations
COVID-19              1,144         38%           700            23%         597            20%         579            19%
deaths
Total              1,612,434        29%        1,248,704         22%     1,225,355          22%      1,467,333         26%
population

Data as of June 8, 2021, excluding long-term care residents. Table should be interpreted as N of Y population (X% of Y
population lives in respective vulnerability quartile). Data source: 2015-2019 ACS Estimate.

                                                           2 of 10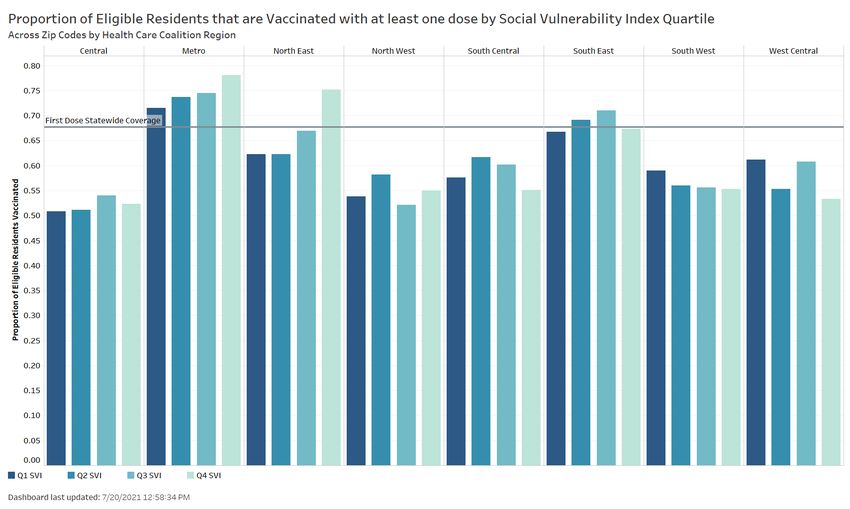
VACCINE EQUITY METRIC EVALUATION BRIEF

Interventions
The use of MDH’s vaccine equity metric has involved several components operating in tandem. Several of these
strategies are highlighted below.

Engagement with external partners
Each week, we provide a list of ZIP codes to local public health, health systems, Federally Qualified Health Centers
(FQHC), health care coalitions, and Medicaid managed care health plans that includes the SVI quartile and vaccine
coverage of each ZIP code. This data has also been mapped out at the ZIP code level and broken down by health
care coalition region and county to better inform our local partners in their response. We have also created a
dashboard for local public health bureaus and community health boards that provides detailed analyses of the SVI
and vaccine coverage as well as mapping down to the census tract level by SVI and vaccination rates.

Sharing data for transparency
MDH collaborates with the Minnesota EHR Consortium to securely share data matching the race/ethnicity of
patients in their electronic health record (EHR) to their vaccination records from the Minnesota Immunization
Information Connection (MIIC), enabling MDH to add race and ethnicity data to our public vaccination dashboard.
The vaccination by race/ethnicity part of the dashboard was stood up in March 2021. After adding SVI as our
vaccine equity metric it was included in the public dashboard in May in addition to the race/ethnicity data already
posted. This corresponded with the development of a weekly internal vaccine equity report, which describes
vaccine coverage throughout the state, identifies areas that are low in vaccine coverage and compares regions
and vaccine providers.

SVI has also been used throughout MDH in other work, including in other parts of the COVID-19 response. MDH is
working to standardize the use of SVI across the agency. One example is using SVI as part of various CDC grant
applications, describing how MDH will use SVI to help guide equity efforts of the agency. MDH has also provided
technical assistance to other state agencies; for example, working with the Minnesota Department of Education
(MDE) to help use SVI for at-risk populations.

Tailored and specific vaccine distribution and outreach programs
MDH’s COVID-19 response has diligently been working on COVID-19 outreach to focus communities to
disseminate culturally relevant, linguistically appropriate, accurate, and timely messages related to COVID-19
vaccines, testing, and other topics. Our teams working with cultural, faith, and disabilities communities have been
working in tandem with MDH’s contracted diverse media vendors, community engagement contractors, and
COVID Community Coordinators (“CCCs” - community-based organizations that connect Minnesota’s diverse
communities to COVID-19 testing, vaccination, and other resources).

Early on, community vaccination sites were recognized to be a vital strategy in helping close the gaps in our
vaccination rates by decreasing the barriers communities face in accessing the COVID-19 vaccine. Use of SVI as an
equity metric helped guide this strategy and the well-established work of our MDH teams and CCCs as we
expanded our efforts to bring shots directly to communities. Among MDH supported community vaccination
clinics carried out or planned as of June 28, 2021, 72% have or will occur in ZIP code areas that are in the Q1 SVI

                                                      3 of 10
VACCINE EQUITY METRIC EVALUATION BRIEF
quartile. When we include all the known community vaccination clinics supported by external partners like local
public health agencies, FQHCs, large health care systems, and regional health care coalitions the number of events
carried out or planned as of June 28, 2021, that have or will occur in Q1 ZIP code areas is 62%.
Similarly, our mobile vaccination buses have targeted outreach to communities to fill gaps in access to COVID-19
vaccination. As of June 30, 2021, 57% of events have occurred in Q1 SVI ZIP code areas.
In May, MDH and the Minnesota Department of Human Services (DHS) launched a partnership with private health
plans to identify Minnesotans who have been most impacted by COVID-19 and continue to face barriers to getting
vaccinated to connect them with vaccination opportunities. As of June 29, 2021, 366,680 outreach attempts had
been made to members living in Q1 SVI ZIP code areas including 19,870 individual phone calls.
Assumptions and methods
For the purposes of this analysis, vaccine coverage is defined where eligible people (i.e., age 16 and over) have
had at least one dose of their vaccine series. We selected first dose because for our purposes, the number of
people who have not started a series is the most indicative of barriers in access to information or immunization. In
this document, a high SVI area refers to a geographic unit placed in the highest quartile of SVI rankings statewide.
We used the current projections for the first three weeks of April to estimate the number of vaccines allocated.
For the fourth and fifth week, we took the average of the previous three weeks, which varied. We calculated 40%
of all vaccines, rather than estimating type-specific allocation. We summed the total of these four weeks to
estimate the number of newly vaccinated Minnesotans living in high SVI areas. We added this to the current
estimate of vaccinated people living in high SVI areas to project vaccine coverage after four weeks using this
strategy.
Our projections of the impact of the equity allocation did not account for changes in vaccine supply and assumed
that all weekly allocated doses would be used. This estimate did not account for migration across SVI areas (i.e.,
Minnesotans living in lower SVI areas migrating to high SVI areas or vice versa). This also assumed all doses
allocated to our equity goal would be distributed to people living in high SVI zip code areas.
Results
An equity allocation goal of 40% of vaccines going to high SVI zip code areas was set based on the analysis
performed in Table 2. Projections of allocations were used to estimate the coverage reached in high SVI areas
(Q1) were we to meet the equity allocation goal. By week 5, first dose vaccine coverage in residents 16 and older
of high SVI areas was expected to be 63.7%, with the actual coverage attained being 62.2%. One of the
assumptions when modeling the projections was that vaccine demand was going to remain the same; however, it
decreased and then plateaued. In Table 3 it can be seen that actual coverage was exceeding projections through
week 2 and was then slightly lower than expected. Of note, Table 3 also demonstrates how the gap between
overall first dose coverage statewide and in Q1 ZIP code areas did slightly narrow even though actual coverage did
not meet our projections.
4 of 10VACCINE EQUITY METRIC EVALUATION BRIEF
Figure 1 visualizes the proportion of each week’s administered doses by SVI quartile out of the total people who
received them. Each vertical line corresponds to changes in vaccine allocation policies. The darkest color
corresponds to greater disadvantage by SVI (Q1) and the lightest color corresponds to lower disadvantage (Q4).
Initially, Q1 had the highest share of administered doses (largely due to early prioritization of seniors,
Minnesotans in congregate living settings, and Tribal nations who were largely in or near high-SVI areas,
vaccinating at high rates). By February this changed, and until the third week in May, where we began to see
increases in their share, Minnesotans living in high-SVI areas had received the smallest proportion of doses.
Table 3. Equity Allocation and First Dose COVID-19 Vaccine Coverage in SVI Quartile 1
Expected Gap between actual
Actual statewide Overall Statewide Q1
Goal week statewide Q1 Q1 coverage coverage coverage and state
coverage coverage
Week 1 (5/3-5/9) 55.1% 57.2% 61.0% -3.8%
Week 2 (5/10-5/16) 57.2% 58.5% 62.2% -3.7%
Week 3 (5/17-5/23) 60.8% 60.1% 63.6% -3.5%
Week 4 (5/24-5/30) 62.6% 61.1% 64.5% -3.4%
Week 5 (5/31-6/6) 63.7% 61.8% 65.1% -3.3%
Figure 1. Week-to-Week Split of First-Dose Administration by SVI Quartile
Week of
(MMW R
week) Quartile First dose distribution 3/6/20 21 Q1 SVI 0.26548 5/22/2 021 Q2 SVI 0.21893 9
12/19/ 2020 Q1 SVI 0.28906 4 3/6/20 21 Q2 SVI 0.23804 4 5/22/2 021 Q3 SVI 0.20335 3
12/19/ 2020 Q2 SVI 0.24656 5 3/6/20 21 Q3 SVI 0.23529 5 5/22/2 021 Q4 SVI 0.25710 9
12/19/ 2020 Q3 SVI 0.22531 6 3/6/20 21 Q4 SVI 0.26017 3 5/29/2 021 Q1 SVI 0.33743 8
12/19/ 2020 Q4 SVI 0.22898 3/13/2 021 Q1 SVI 0.26806 7 5/29/2 021 Q2 SVI 0.21907 6
12/26/ 2020 Q1 SVI 0.25009 5 3/13/2 021 Q2 SVI 0.22473 8 5/29/2 021 Q3 SVI 0.19722 9
12/26/ 2020 Q2 SVI 0.23442 5 3/13/2 021 Q3 SVI 0.22577 4 5/29/2 021 Q4 SVI 0.24415 9
12/26/ 2020 Q3 SVI 0.23345 2 3/13/2 021 Q4 SVI 0.28009 9 6/5/20 21 Q1 SVI 0.35082 2
12/26/ 2020 Q4 SVI 0.2793 3/20/2 021 Q1 SVI 0.29078 5 6/5/20 21 Q2 SVI 0.22477 2
1/2/20 21 Q1 SVI 0.26112 4 3/20/2 021 Q2 SVI 0.21642 4 6/5/20 21 Q3 SVI 0.19443 7
1/2/20 21 Q2 SVI 0.23967 6 3/20/2 021 Q3 SVI 0.21629 2 6/5/20 21 Q4 SVI 0.22798
1/2/20 21 Q3 SVI 0.23425 5 3/20/2 021 Q4 SVI 0.27538 3 6/12/2 021 Q1 SVI 0.36858
1/2/20 21 Q4 SVI 0.26196 2 3/27/2 021 Q1 SVI 0.27478 4 6/12/2 021 Q2 SVI 0.21836 7
1/9/20 21 Q1 SVI 0.28048 3/27/2 021 Q2 SVI 0.22036 6 6/12/2 021 Q3 SVI 0.19379 8
1/9/20 21 Q2 SVI 0.23580 1 3/27/2 021 Q3 SVI 0.21389 3 6/12/2 021 Q4 SVI 0.21605 7
1/9/20 21 Q3 SVI 0.25352 5 3/27/2 021 Q4 SVI 0.28997 9 6/19/2 021 Q1 SVI 0.37029 8
1/9/20 21 Q4 SVI 0.22841 9 4/3/20 21 Q1 SVI 0.25844 8 6/19/2 021 Q2 SVI 0.22157 4
1/16/2 021 Q1 SVI 0.25766 2 4/3/20 21 Q2 SVI 0.21787 4 6/19/2 021 Q3 SVI 0.18936 7
1/16/2 021 Q2 SVI 0.26622 6 4/3/20 21 Q3 SVI 0.21791 9 6/19/2 021 Q4 SVI 0.21568 4
1/16/2 021 Q3 SVI 0.24391 9 4/3/20 21 Q4 SVI 0.30471 6 6/26/2 021 Q1 SVI 0.35508 1
1/16/2 021 Q4 SVI 0.22992 4/10/2 021 Q1 SVI 0.25554 1 6/26/2 021 Q2 SVI 0.21603 3
1/23/2 021 Q1 SVI 0.29130 6 4/10/2 021 Q2 SVI 0.21324 6 6/26/2 021 Q3 SVI 0.20093 7
1/23/2 021 Q2 SVI 0.24099 6 4/10/2 021 Q3 SVI 0.21756 1 6/26/2 021 Q4 SVI 0.22413 1
1/23/2 021 Q3 SVI 0.22097 1 4/10/2 021 Q4 SVI 0.31299 9 7/3/20 21 Q1 SVI 0.35415 3
1/23/2 021 Q4 SVI 0.24262 9 4/17/2 021 Q1 SVI 0.25902 6 7/3/20 21 Q2 SVI 0.22144 5
1/30/2 021 Q1 SVI 0.27774 1 4/17/2 021 Q2 SVI 0.20900 5 7/3/20 21 Q3 SVI 0.19556 3
1/30/2 021 Q2 SVI 0.23968 1 4/17/2 021 Q3 SVI 0.21330 8 7/3/20 21 Q4 SVI 0.22613 2
1/30/2 021 Q3 SVI 0.23158 1 4/17/2 021 Q4 SVI 0.31773 2 7/10/2 021 Q1 SVI 0.34409 6
1/30/2 021 Q4 SVI 0.24788 7 4/24/2 021 Q1 SVI 0.27163 2 7/10/2 021 Q2 SVI 0.22995 3
2/6/20 21 Q1 SVI 0.27567 5 4/24/2 021 Q2 SVI 0.21222 9 7/10/2 021 Q3 SVI 0.18902 5
2/6/20 21 Q2 SVI 0.23238 9 4/24/2 021 Q3 SVI 0.21142 8 7/10/2 021 Q4 SVI 0.23533 4
2/6/20 21 Q3 SVI 0.23210 6 4/24/2 021 Q4 SVI 0.30401 9 7/17/2 021 Q1 SVI 0.34863 8
2/6/20 21 Q4 SVI 0.25603 6 5/1/20 21 Q1 SVI 0.28116 6 7/17/2 021 Q2 SVI 0.22375 6
2/13/2 021 Q1 SVI 0.27236 9 5/1/20 21 Q2 SVI 0.20068 5 7/17/2 021 Q3 SVI 0.19331 6
2/13/2 021 Q2 SVI 0.22948 7 5/1/20 21 Q3 SVI 0.20962 7 7/17/2 021 Q4 SVI 0.23152 9
2/13/2 021 Q3 SVI 0.23128 3 5/1/20 21 Q4 SVI 0.30762 1 7/24/2 021 Q1 SVI 0.31921 4
2/13/2 021 Q4 SVI 0.26456 5/8/20 21 Q1 SVI 0.29421 3 7/24/2 021 Q2 SVI 0.21883
2/20/2 021 Q1 SVI 0.27229 2 5/8/20 21 Q2 SVI 0.20962 3 7/24/2 021 Q3 SVI 0.21105 1
2/20/2 021 Q2 SVI 0.21694 1 5/8/20 21 Q3 SVI 0.21350 6 7/24/2 021 Q4 SVI 0.24914 7
2/20/2 021 Q3 SVI 0.23797 7 5/8/20 21 Q4 SVI 0.28164 2 7/31/2 021 Q1 SVI 0.33178 2
2/20/2 021 Q4 SVI 0.27017 3 5/15/2 021 Q1 SVI 0.30331 4 7/31/2 021 Q2 SVI 0.19974 6
2/27/2 021 Q1 SVI 0.26757 5 5/15/2 021 Q2 SVI 0.21934 8 7/31/2 021 Q3 SVI 0.20101 6
2/27/2 021 Q2 SVI 0.23292 9 5/15/2 021 Q3 SVI 0.20672 1 7/31/2 021 Q4 SVI 0.26703 3
2/27/2 021 Q3 SVI 0.22949 5 5/15/2 021 Q4 SVI 0.26926 5
2/27/2 021 Q4 SVI 0.26861 5/22/2 021 Q1 SVI 0.31921 6
5 of 10MINNESOTA DEPARTMENT OF HEALTH
Another impact of our vaccine equity strategies has been media engagement. Some of this has been through our
COVID-19 Contracts for Diverse Media Messaging and Community Outreach
(https://www.health.state.mn.us/communities/equity/funding/covidcontracts.html) to reach a diverse breadth of
communities and to create culturally specific messaging. In addition, participation in MDH’s media briefings
occurred weekly in May. Vaccine equity has also remained a topic of interest in multiple local news organizations.
This regular engagement shows the depth of presence in the public eye, continues to help bring awareness of our
work with focus communities, and helps reflect the incredible work of the MDH vaccine equity team.
Limitations
While we can describe the contribution of our vaccine equity strategies to increasing vaccine coverage among
Minnesota’s most disadvantaged residents, it is a challenge to attribute how much specifically was due to these
strategies. Our equity strategies worked in tandem with one another at the state level, and many other events
coincided. Local public health agencies, health systems, clinics, and pharmacies created their own events to
vaccinate people outside our campaign. In addition, the doses allocated in the strategy mentioned above were
not the only doses administered for equity purposes. Through FEMA funding, we received doses and support to
vaccinate at community sites (separate from the state’s allocation) along with setting up a site at the Minnesota
State Fairgrounds. These doses were specifically prioritized for Q1 SVI ZIP code areas. Over the course of this
successful effort, 97% of Minnesotans vaccinated were from Q1 SVI ZIP codes. FEMA doses were not captured
when we talk about the equity allocation goal because they were allocated directly by the federal government.
However, the impact of those doses on the overall immunization rate in Q1 illustrates the need to have a multi-
pronged approach that prioritizes equity.
A broader limitation is that our current data does not allow insight into vaccination rates among Minnesotans
with disabilities or those who identify as Lesbian, Gay, Bisexual, Transgender or Queer (LGBTQ), communities that
have noted barriers to testing, vaccines, and care. We also are not currently able to further disaggregate
vaccination data by race and ethnicity in a standardized way that allows us the ability to identify where gaps and
disparities exist within racial and ethnic communities within Minnesota. We recognize that SVI is an imperfect
proxy and MDH is continuing to work on improving our data to meet our commitment to health and racial equity.
Next steps
Overlap of race/ethnicity, SVI, and vaccination rates
Although SVI was selected a proxy for the impact of historical disinvestment in areas of our state, it does not
completely capture the impact of structural racism. The disproportionate impact our Black, Native American,
Hispanic, Asian, and other communities of color have experienced during COVID-19 related to the overlap of
geographic deprivation, racism, and language was recently described by looking at Minnesota communities using
the Area Deprivation Index8. This effect was also seen when looking at vaccination rates among race/ethnicity
groups in Minnesota stratified by SVI using Minnesota Immunization Information Connection (MIIC) data.
While a gap in vaccination rates do exist for white Minnesotans who live in Q1 ZIP codes versus those in Q4 ZIP
codes, as seen in Table 4, the difference is more than three times larger for Black Minnesotans and American
Indian/Alaskan Native Minnesotans and two and half times larger for Asian Pacific Islander Minnesotans. This
suggests that we need to focus further on Q1 ZIP code areas experiencing gaps in immunization rates stratified by
6 of 10VACCINE EQUITY METRIC EVALUATION BRIEF
race/ethnicity as we continue to target both outreach and vaccination opportunities. Our vaccine equity team has
generated a list of priority ZIP codes stratified in this manner and attentive to regional geography. We will be
working with our existing contracted COVID Community Coordinators, Community Based Organizations, vaccine
outreach directors and external partners to prioritize engagement and vaccination efforts in these communities
through the months of July and August. Additionally, this information can help inform MDH leadership’s strategy
around broader COVID-19 resources like testing and guidance around other mitigation measures if we see a rise in
infection rates from new variants.
Regional level data
There are notable differences in vaccination rates based on geography. This has been noted nationally and in
Minnesota. We have been looking at the overlap of SVI and regional vaccination rates to help guide strategies
since the end of June (Figure 2). To further assist our partners we will be launching a tool for local public health
through our trusted partners site that allows them to see the vaccination rates stratified by SVI quartile down to
the county level, as well as the overall distribution of administered vaccines at the county level by SVI quartile
compared to the overall distribution of the county’s population by SVI quartile. In this dashboard, local public
health officials will also be able to compare the first dose coverage by quartiles in their jurisdiction to the
statewide coverage by quartiles as well as estimate the number of individuals yet to be vaccinated. This report, in
combination with regional vaccine rates will allow officials working on vaccine initiatives to be more strategic with
outreach and engagement efforts so as to increase coverage over time (Figure 3).
Public vaccine equity report
Data transparency for vaccine equity is an important issue for MDH to continue to address. Having stood up a
vaccine equity metric and created an internal vaccine equity report, we are also now publishing a weekly version
that is available for the public along with a dataset that includes ZIP code level data on SVI quartile and
vaccination rates. The report can be found on COVID-19 Vaccine Equity in Minnesota
(https://www.health.state.mn.us/diseases/coronavirus/vaccine/mnsvi.html).
Childhood immunization
Shortly after the March 2020 declaration of the COVID-19 pandemic in the United States, an analysis of provider
ordering data from the federally-funded Vaccines for Children program found a substantial decrease in routine
pediatric vaccine ordering9. While initial drops have partially recovered for some vaccine-preventable illnesses,
several notable gaps have persisted throughout the pandemic10. An MDH analysis of data from MIIC, the state’s
immunization information system (IIS), found that immunization coverage rates among children and adolescents
are lagging behind previous years. Routine immunization coverage among children and adolescents show
disparities exist along lines of race, ethnicity and SVI zip code quartile, with gaps most pronounced in adolescent
vaccination. Additional MDH analyses using 2020-21 school immunization data further highlight the adolescent
gap with large decreases in coverage for the vaccines required for seventh grade students seen. Tdap and
meningococcal coverage dropped by 8 and 7 percentage points, respectively. Also of note, since the CDC’s
Advisory Council on Immunization Practices (ACIP) approved Pfizer’s mRNA COVID-19 vaccine down to age 12 and
also provided guidance on co-administration of the COVID-19 vaccine with other routine immunizations, there has
been minimal co-administration noted in Minnesota. This translates into missed opportunities to address gaps in
both COVID-19 and routine immunization. In addition to preparing our children to be protected from COVID-19 as
they re-enter school and fall activities, preventing additional vaccine-preventable outbreaks using the impressive
7 of 10VACCINE EQUITY METRIC EVALUATION BRIEF
infrastructure we have in place for COVID-19 vaccination is among MDH’s goals and will be a priority in the work
of the vaccine equity team over the next two months. These efforts will continue to be guided by our vaccine
equity metrics.
Table 4. Difference in Statewide First Dose 16+ Vaccination Rates by Race/Ethnicity and
SVI ZIP Code Quartile based on MIIC data
Gap in Q1:Q4 first dose coverage
(% difference)
American Indian/Alaskan Native -36.1%
Asian or Pacific Islander -28.8%
Black/African American -37.1%
White -11.8%
Hispanic/Latinx -16.5%
Table 4 shows the percent difference in vaccine coverage by race and ethnicity between SVI Q1 areas (high
vulnerability) and SVI Q4 areas (low vulnerability). The gap in coverage is smallest for white Minnesotans and
largest for Black/African American Minnesotans. Roughly 7% of race data and 30% of ethnicity data is missing or
unknown. Data from MIIC.
Figure 2. First Dose 16+ Vaccination Rates by Health Care Coalition Region and SVI ZIP
Code Quartile
Region Quartile First vaccination rate
Central Q1 SVI 0.51430 8
Central Q2 SVI 0.51572 1
Central Q3 SVI 0.54537 6
Central Q4 SVI 0.52827 2
Metro Q1 SVI 0.72156 5
Metro Q2 SVI 0.74219 1
Metro Q3 SVI 0.74979 3
Metro Q4 SVI 0.78509 6
North East Q1 SVI 0.62785 8
North East Q2 SVI 0.62804 4
North East Q3 SVI 0.67248
North East Q4 SVI 0.75625 7
North We st Q1 SVI 0.54896 4
North We st Q2 SVI 0.58441
North We st Q3 SVI 0.52618 7
North We st Q4 SVI 0.55535 8
South Ce ntral Q1 SVI 0.57968 4
South Ce ntral Q2 SVI 0.62083 5
South Ce ntral Q3 SVI 0.60601 7
South Ce ntral Q4 SVI 0.55504
South East Q1 SVI 0.67497 9
South East Q2 SVI 0.69412 1
South East Q3 SVI 0.71373 5
South East Q4 SVI 0.67679 1
South West Q1 SVI 0.59437 4
South West Q2 SVI 0.56289 1
South West Q3 SVI 0.55975 6
South West Q4 SVI 0.55776 7
West Central Q1 SVI 0.61522 1
West Central Q2 SVI 0.55954 8
West Central Q3 SVI 0.61189 9
West Central Q4 SVI 0.53687 5
8 of 10VACCINE EQUITY METRIC EVALUATION BRIEF
Figure 2 shows the first dose vaccine coverage across SVI quartiles by Health Care Coalition Region for residents
16 years and older. The horizontal line across the chart indicates the statewide first dose coverage. Data from
MIIC.
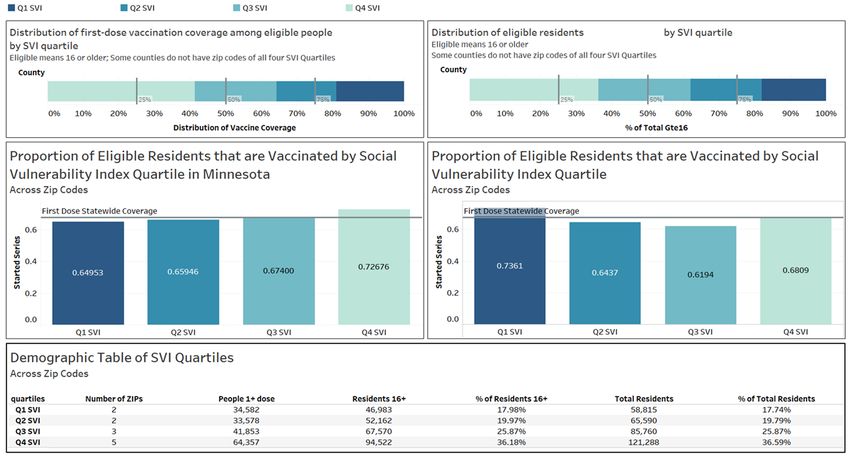
Figure 3. Local Public Health Dashboard – County-level View of Vaccination Data by SVI
The figure shows the distribution of first dose coverage by SVI quartile in a specific county (top left). 41% of individuals with a
first dose are in Quartile 4, 23% are in Quartile 3, 16% are in Quartile 2, and 19% are in Quartile 1. The top right chart shows
the distribution of the total population 16 and older in a specific county. 36% of individuals in this county live in Quartile 4,
26% of individuals live in Quartile 3, 20% of individuals live in Quartile 2, and 18% of individuals live in Quartile 1. In the
middle left chart, the proportion of residents age 16 and older who are vaccinated by quartile across the state. Here, 65% of
individuals in Quartile 1 have at least one dose, 66% in Quartile 2, 68% in Quartile 3, and 73% in quartile 4. The middle right
chart shows the proportion of residents age 16 and older who are vaccinated by quartile in a specific county. Here, 74% of
individuals in Quartile 1 have at least one dose, 65% of those in quartile 2, 62% of those in quartile 3, and 68% of those in
quartile 4. The horizontal lines across the middle charts indicate the statewide first dose coverage. Finally, at the bottom
there is a table with demographic characteristics of the vaccine doses. There are 2 zip codes in Quartile 1 that have 34892
people with at least one dose out of 46983 residents 16 and older and 58815 total residents. 18% of individuals 16 and older
and in total in this county live in this quartile. There are 2 zip codes in Quartile 2 that have 33877 people with at least one
dose out of 52162 residents 16 and older and 65590 total residents. 20% of individuals 16 and older and in total in this county
live in this quartile. There are 3 zip codes in Quartile 3 that have 42199 people with at least one dose out of 67570 residents
16 and older and 85760 total residents. 26% of individuals 16 and older and in total in this county live in this quartile. There
are 5 zip codes in Quartile 4 that have 64865 people with at least one dose out of 94522 residents 16 and older and 121288
total residents. 36% of individuals 16 and older and in total in this county live in this quartile.
ZIP Code Quartile
Figure 3 is an example of the distribution of first dose coverage by SVI quartile for a specific county (top left), the
distribution of the total population 16 and older in a specific county (top right), the proportion of residents age 16
and older who are vaccinated by quartile across the state (middle left), the proportion of residents age 16 and
older who are vaccinated by quartile in a specific county (middle right), and a table with demographic
characteristics of the vaccine doses (bottom). The horizontal lines across the middle charts indicate the statewide
first dose coverages. Data from MIIC.
9 of 10VACCINE EQUITY METRIC EVALUATION BRIEF
References
1. Persad, G., et al. (2020). "Fairly Prioritizing Groups for Access to COVID-19 Vaccines." JAMA 324(16): 1601.
2. Schmidt, H., et al. (2020). "Is It Lawful and Ethical to Prioritize Racial Minorities for COVID-19 Vaccines?" JAMA
324(20): 2023.
3. Schmidt, H., et al. (2020). "Covid-19: how to prioritize worse-off populations in allocating safe and effective
vaccines." BMJ: m3795.
4. Shen, A. K., et al. (2021). "Ensuring Equitable Access To COVID-19 Vaccines In The US: Current System
Challenges And Opportunities." Health Affairs 40(1): 62-69.
5. Centers for Disease Control and Prevention/ Agency for Toxic Substances and Disease Registry/ Geospatial
Research, Analysis, and Services Program. CDC Social Vulnerability Index, 2018 Database, Minnesota.
https://www.atsdr.cdc.gov/placeandhealth/svi/data_documentation_download.html. Accessed on March 31,
2021.
6. Association between social vulnerability and a COUNTY'S risk for becoming A COVID-19 hotspot - United
STATES, june 1–JULY 25, 2020. (2020, October 22). Retrieved February 20, 2021, from
https://www.cdc.gov/mmwr/volumes/69/wr/mm6942a3.htm
7. Barry V, Dasgupta S, Weller DL, et al. Patterns in COVID-19 Vaccination Coverage, by Social Vulnerability and
Urbanicity — United States, December 14, 2020–May 1, 2021. MMWR Morb Mortal Wkly Rep 2021;70:818–
824. DOI: http://dx.doi.org/10.15585/mmwr.mm7022e1
8. Ingraham, N.E., Purcell, L.N., Karam, B.S. et al. Racial and Ethnic Disparities in Hospital Admissions from
COVID-19: Determining the Impact of Neighborhood Deprivation and Primary Language. J GEN INTERN MED
(2021). https://doi.org/10.1007/s11606-021-06790-w
9. Santoli JM, Lindley MC, DeSilva MB, et al. Effects of the COVID-19 Pandemic on Routine Pediatric Vaccine
Ordering and Administration — United States, 2020. MMWR Morb Mortal Wkly Rep 2020;69:591–593. DOI:
http://dx.doi.org/10.15585/mmwr.mm6919e2
10. Patel B, Murthy , Zell E, et al. Impact of the COVID-19 Pandemic on Administration of Selected Routine
Childhood and Adolescent Vaccinations — 10 U.S. Jurisdictions, March–September 2020. MMWR Morb
Mortal Wkly Rep 2021;70:840–845. DOI: http://dx.doi.org/10.15585/mmwr.mm7023a2
Minnesota Department of Health | health.mn.gov | 651-201-5000
625 Robert Street North PO Box 64975, St. Paul, MN 55164-0975
Contact health.communications@state.mn.us to request an alternate format.
10 of 10You can also read