Galenica Group Investor Presentation - March 2018

Page created by Jim Pearson
 
CONTINUE READING
Galenica Group Investor Presentation - March 2018
Galenica Group
Investor Presentation

March 2018
Galenica Group Investor Presentation - March 2018
Agenda
                                    Page

  1        History                  3

  2        Galenica at a glance     6

  3        Business Sectors         11

  4        Financial track record   16

  5        Business Update 2017     18

  6        Regulatory projects      30

  7        Outlook                  33

March 2018 − © Galenica                    2
Galenica Group Investor Presentation - March 2018
1       Building the leading Swiss healthcare platform over 90 years

Foundation of                                                          Creation of
                                                                                                                       Acquisition of
                                                                     Amavita uniform                                                               Acquisition of
Galenica as a                                                                                                          Merfen® and
                                                                        brand in                                                                     Bahnhof
 wholesaler                                                                                                            Vita-Merfen®
                                                Organic and           Switzerland                                                                   Apotheke
                                               acquisition-led
                                                expansion of                                        Acquisition of
                  Expansion of                                                                                                        IPO of
                                                pharmacies                        Acquisition         Sun Store
                   distribution                                                                                                      Galenica
                                                  network                       of MediService       pharmacies
                    activities                                                                                                        Santé

1927         1995           1996     1999          2000     2002 / 2004     2005     2007      2008     2009         2013          2017            2018

        Strategy to                Partnership             Acquisition of               Opening of highly                                      Acquisition of
       engage in the               with Alliance           Anti-Brumm®                                          Acquisition
                                                                                             automated                                         care product
        entire Swiss                UniChem               and Perskindol®                                       of medifilm
                                                                                       distribution centre in
         healthcare                                                                          Niederbipp
        value chain
                                                                                                                              Acquisition of
                                                                                                                              Pharmapool

                                            Corporate     Services     Retail      Products & Brands

  March 2018 − © Galenica                                                                                                                                           3
Galenica Group Investor Presentation - March 2018
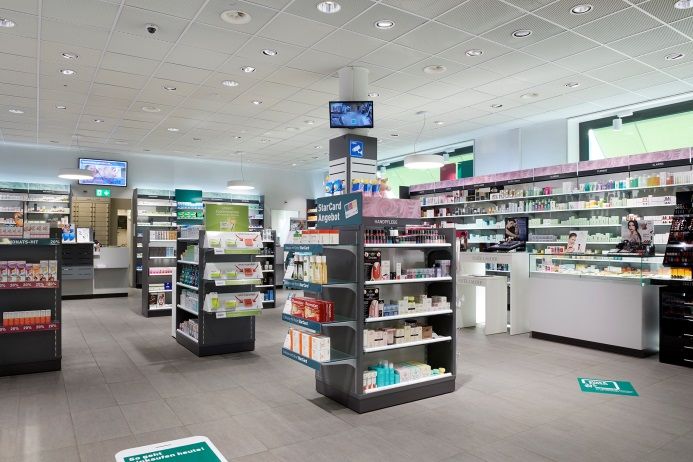
1     History of resilient growth and margin improvement
                                                                                 Logistics, HealthCare Information & Retail1,4                                                            Galenica

                                                                               2007–17 CAGRs
          2007-17
                                              4.2%                             Retail market sales2                                            2.1%
        sales CAGR                                                             Galenica net sales                                              4.2%
                                                                               Galenica EBIT3                                                 14.3%
          2007-17                                                                                                                                                                                                3'214
        EBIT CAGR3
                                             14.3%                                                                                                                                                                             5.0%
                                                                                                                                                                                       2'915        3'009
                                                                                                                                                             2'766        2'826
                                                                                                                      2'526        2'603        2'661
         2007-17 EBIT
                                                                                                         2'467
                                                                                            2'270
            margin                         +278bps                             2'129
        improvement3
                                                                                                                                                                                                                               2.5%
         2017 cash
        conversion5
                                               70%

          FTEs
          as of                             c.4’944                                                                                                                                                                            0.0%
    31 December 2017                                                            2007         2008         2009         2010         2011         2012         2013         2014         2015         2016         2017

                                                                                                                   Net sales (CHFm)                          EBIT margin %
Source:    Company information, Galenica Annual Reports, IQVIA (former IMS Health)
Notes:     The financial information presented with respect to the financial years ended 31 December 2007 through 2013 has been derived from the audited consolidated financial statements of Galenica AG (now renamed Vifor Pharma
           AG) and represent its Logistics, Retail and Other (Healthcare Information) businesses, excluding the Pharma business. The Company, a former wholly-owned subsidiary of Galenica AG (now renamed Vifor Pharma AG),
           prepared combined financial statements for the financial years ended 31 December 2014, 2015 and 2016. Accordingly, the financial information derived from the combined financial statements of the Company and from the
           consolidated financials of Galenica AG (now Vifor Pharma AG) for its Logistics, Retail and Other (Healthcare Information) businesses, excluding the Pharma business, for prior periods may not be fully comparable.
1          Not including Vifor Consumer Health
2          Retail market sales include direct and indirect pharmaceutical sales through pharmacies, self-dispensing doctors and drugstores
3          2014-16 EBIT from combined financial statements and 2017 EBIT, excludes IAS 19 expense
4          2013 financials as per 2014 financial statements due to changed segment structure (Galenica Santé is reported as a separate segment since 2014). Financials not adjusted to include Products & Brands
5          Calculated as (EBITDA-capex)/EBITDA. 2014-17 EBITDA excludes IAS 19 adjustment; capex includes investments in tangible and intangible assets

March 2018 − © Galenica                                                                                                                                                                                                               4
Galenica Group Investor Presentation - March 2018
1      7 April 2017: Outstanding IPO of Galenica Santé
 Largest IPO in Europe in H1 2017 and first sizeable 100% subsidiary IPO since
  years
 Multiple oversubscription with pricing at the top end of the price range at
  CHF 39.00                                        HF
                                                  13%                 RoW 15%
                                                                    PB
 Broadly diversified                                              30%
                                                                                                                                US
                                                                          48.75m                                               12%         48.75m
  allocation                                                              Shares1)                                                         Shares1)     CH
                                                                                                                                                       50%

 Today already about                                                        LO 57%
                                                                                                                                      UK
                                                                                                                                     23%

  14’000 shareholders
                                                                             Performance of Galenica share 2017
                                                          20%
                                                          18%
                                                          16%           GALENICA

                                                          14%
                                                                        SPI (Swiss Performance
                                                          12%           Index)

 Strong and stable                                       10%
                                                          8%
  trading after IPO                                       6%
                                                          4%
                                                          2%

 1) Allocation of the shares at the IPO on 7 April 2017
                                                          0%
                                                          7. Apr 17 Apr 17    May 17    Jun 17      Jul 17   Aug 17   Sep 17    Oct 17     Nov 17   Dec 17

                                                           First traded price CHF 43.00, 7.4.2017
March 2018 − © Galenica                                                                                                                                      5
Galenica Group Investor Presentation - March 2018
2       Galenica is the leading healthcare provider in Switzerland
                                                                                                                            2017 net sales                 CHF3’214m
                                                                                                                            2017 EBIT1                      CHF148m

                                                                 Health & Beauty
                                                                                                                                                                                             Services
                                 Retail                                                                Products & Brands
           Market position2                               #1                      Consumer Health market position2                                   #2                 Market position2                                  #1

                                                    2017 net sales                  2017 EBIT                                                                             2017 net sales                 2017 EBIT
                                                     (pre eliminations of intercompany positions)                                                                          (pre eliminations of intercompany positions)
                                                      CHF1’483m                     CHF100m                                                                                 CHF2’502m                      CHF51m
    −     Leading domestic network of own, joint                                    −    Broad range of own, exclusive and                                        −    Leading provider of specialised
          venture and independent partner                                                partner products for consumer health,                                         pre-wholesale and wholesale distribution
          pharmacies                                                                     beauty and well-being                                                         services
    −     Provision of health and beauty products,                                  −    Strong sales and marketing force in                                      −    Specialised databases and solutions for
          patient advice and new services                                                Switzerland                                                                   clinical decision support

    1            Excludes IAS 19 expense
    2            Services based on sales reported at ex-manufacturer price level as of MAT December 2017. Source: QuintilesIMS Market Prognosis 2017-2021, Switzerland; Retail based on number of pharmacies. Source: QuintilesIMS Market
                 Prognosis 2017-2021, Switzerland, pharmaSuisse 2017 and company websites; Products & Brands based on IQVIA MAT December 2017 sales value for OTC, Patient Care, Personal Care and Nutritionals products

March 2018 − © Galenica                                                                                                                                                                                                                     6
Galenica Group Investor Presentation - March 2018
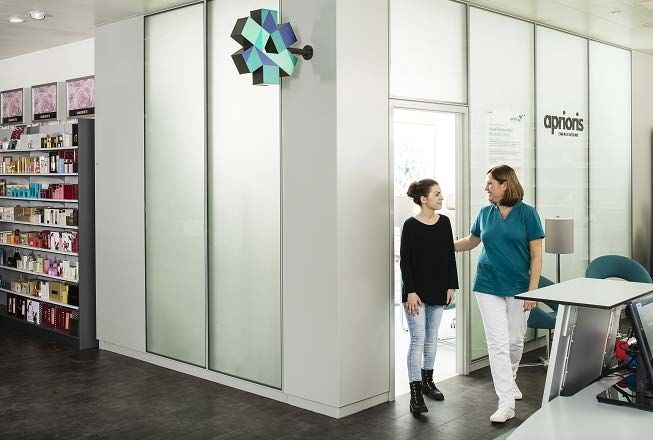
Operating in a stable and attractive Swiss healthcare market
         2               with favourable long-term fundamentals
    Resilient, stable Swiss healthcare retail sector2                                                                                      Pharmaceutical market in Switzerland (2017)1
    CHF bn (based on ex-manufacturer price)
                                                                                                       2017-21 CAGR 2.1%3                         By value−CHF5.8bn                  By volume−185 million packs
                                           2007-17 CAGR 2.1%3
5                                                                                                                                                                                              3.6%
                                                                                                                                                                1.1%                       9.1%
4
                                                                                                                                                        23.7%
3                                                                                                                                                                  50.4%                  22.3%
                                                                                                        4.5      4.6      4.7     4.8                    24.8%                                      65.0%
                                                                              4.1      4.3     4.4
2                3.8       3.9      3.8     3.9      3.9      3.9     3.9
     3.6

1
                                                                                                                                                 Pharmacies            Self-dispensing doctors    Hospitals   Drugstores
0   2007 2008 2009                 2010    2011 2012         2013    2014 2015 2016            2017 E2018 E2019 E2020 E2021

                                                                                                         2018E

                                                                                                                  2019E

                                                                                                                          2020E

                                                                                                                                   2021E
        2007

                  2008

                            2009

                                    2010

                                             2011

                                                      2012

                                                              2013

                                                                       2014

                                                                               2015

                                                                                        2016

                                                                                                2017
               Financial crisis                                                           Mandatory price cuts                             Pharmacists play a crucial role in the provision of medicines
               Unpegging of Swiss Franc by SNB                                            Proposed mandatory price cuts
                                                                                                                                           − Indispensable role in one of the world's highest quality health
                                                                                                                                             care systems, providing drugs, advice and services
        − Underlying healthcare sector growth drivers, including                                                                           − Continued efforts by government and health insurers to
          demographics, lifestyle and innovation                                                                                             make pharmacists the first point of contact
        − One of the highest life expectancy rates in the world                                                                            − Growing importance to meet consumer trends towards more
        − Non-discretionary nature of products and services                                                                                  personalized healthcare and self-medication

    Source:              IQVIA, Pharmamarkt Schweiz, YTD December 2017, QuintilesIMS Market Prognosis 2017-2021, Switzerland

    1                    Medicines Swissmedic list A, B, C, D sold from suppliers and wholesalers to hospitals, physicians, pharmacies and drugstores
    2                    Total market without hospitals
    3                    QuintilesIMS Market Prognosis 2017-2021, Switzerland; published September 2017

    March 2018 − © Galenica                                                                                                                                                                                                7
Galenica Group Investor Presentation - March 2018
2      Experienced management team with proven track record
                    Jean-Claude Clémençon        −   CEO since IPO
                    CEO                          −   Head of Business Sector Retail since 2015, 29 years industry experience of which 23 years at Galenica Group
                                                 −   Joined Galenica Group in 1995
                                                 −   Previously, Head of Logistics and HCI at Galenica Group, Head of Manufacturing at Rheintub, Rheinsulz and CEO of Raintec

                     Felix Burkhard              −   CFO since 2017
                     CFO                         −   27 years industry experience of which 23 years at Galenica
                                                 −   Joined Galenica in 1995
                                                 −   Previously, Head of Strategic Projects of Galenica Group and Head of Business Sector Retail

                     Daniele Madonna             −   Pharmacist
                     Head of Retail              −   16 years industry experience of which 14 years at Galenica
                     Business sector             −   Previously Store Manager, Regional Sales Manager and CEO of the joint venture Coop Vitality

                     Torvald de Coverly Veale    −   36 years industry experience of which 3 years at Galenica
                     Head of Products & Brands   −   Joined Galenica 2015
                     Business sector             −   Previously, responsible for international expansion at Walgreens Boots Alliance and Global Brand Director at Unilever

                     Christoph Amstutz           −   30 years industry experience of which 11 years at Galenica
                     Head of Services            −   Joined Globopharm in 2007 (led integration process into Galenica)
                     Business sector             −   Previously, Head of G-Pharma & Alloga and Business Unit Head at Bristol-Myers Squibb

March 2018 − © Galenica                                                                                                                                                         8
Galenica Group Investor Presentation - March 2018
2      Our ambition and self-perception

                                                    Galenica:
                                            The first choice for health,
                                              beauty and wellbeing.

March 2018 − © Galenica                                                    9
Galenica Group Investor Presentation - March 2018
2      Our Strategy - the power of 3 drives sustained value creation
                                                                              Products & Brands
 −     Leverage leading positions to promote
       higher margin and exclusive products                                                                  −    Develop and launch own and partner
                                                                                                                  brands and products for pharmacies

                                                               Leverage
 −     Further expand and optimise retail

                                                    Retail
                                                                                                                      2015                  2016
       network

 −     Drive efficiency through one single                                                                       P&G brands
       process for all three pharmacy formats

        Click & Collect         Loyalty cards
                                                                              Support
                                                                                                                                2017
                                                                              Services

                                                −       Leverage scale advantages to develop
                                                        new, value-added services                                                /

                                                −       Continue to drive synergies across the
                                                        entire organisation

                                                medifilm                  GDP-qualified fleet     e-health

March 2018 − © Galenica                                                                                                                                10
3         The largest pharmacy retailer in Switzerland                                                                                                                                                            Retail
Network of chains (# of pharmacies as of 31 December 2017) Webshop                                               Competitive positioning—#1 market position4
                                   −    Largest branded pharmacy network by                                      By number of pharmacies5                                              Total # of pharmacies as of 2016
                                        number of pharmacies in Switzerland
                                                                                                                                                                                                                 1’792
                       1641
                                                                                                                                      160
                                                                                                                                      9%
                                   −    The first Swiss pharmacy chain2                                                                                                         ~5.5x more pharmacies
                       97
                                                                                                                                                                                  than next competitor
                                   −    Joint venture (49:51) with Coop, the 2nd largest
                                        retail group in Switzerland
                                                                                                                                     337
                       75                                                                                                             19%                                   91
                                                                                                                                                                                                                58
                                   −    Service provider for independent pharmacies
                       1603             under Feelgood's brand
                                                                                                                                                                          No. 2                                No. 3
                                   −    Specialty pharmacy focused on home healthcare
                       1                for patients with chronic illnesses                                                  Own       Independent

Highlights                                                                                                       Net sales performance (CHFm)
                                                                                                                                                                    CAGR 3.6%
    −     Largest pharmacy network, including online presence
    −     Offers broad product range, including well-known own brands, as well as
          health services and tests                                                                                                                                                                                1'390
                                                                                                                                  1'251                      1'308                      1'349
    −     Built organically and through targeted acquisitions since 2000
    −     Including attractive, high customer traffic locations across Switzerland                                                2014                       2015                       2016                       2017
    −     Average sales per pharmacy of CHF4.2m > 1.4x Swiss market average6                                     Health & Beauty7
                                                                                                                 Sales       1’335                         1’393                      1’437                       1’483
                                                                                                                 EBIT margin 6.0%                          6.4%                       6.5%                        6.7%
1       Amavita figures include 7 majority and minority holdings in other pharmacies                              5   Own includes 75 pharmacies through joint venture with Coop; independent includes 8 Amavita partners
2       Based on 1976 Federal Court law permitting non-pharmacists to own a pharmacy for the first time           6   Retail pharmacy sales for GaleniCare on a like-for-like basis, including Amavita and Sun Store pharmacies only. Swiss
3       Includes 8 Amavita partners                                                                                   market average based on Pharmasuisse, Roka 2015
4       Based on number of pharmacies. Source: pharmaSuisse 2017, QuintilesIMS Market Prognosis 2017-2021,        7   H&B post-inter-segmental eliminations
        Switzerland; and company websites
March 2018 − © Galenica                                                                                                                                                                                                               11
3       Ongoing pharmacy network consolidation and optimisation                                                                             Retail
 Proven track record of delivering synergies                                                           Widely spread pharmacy network covers every
  through streamlining of business processes and                                                         Region in Switzerland
  creating value through acquisitions and network
  optimisation

                                                 Marketing

                                IT and
                              Processes                           Purchasing

    Demonstrated M&A track record with an average of 9 pharmacies acquired and 8 net pharmacies added per
     year over the last 6 years
                                                                                        2012    2013   2014     2015     2016      2017
                                       Pharmacies acquired                                10    20      5        2        13        6
                                      Net pharmacies added1                               11    12      6        0        11        8
                                       Total own Pharmacies                              300    312    318      318       329      337

   1   Includes the impact of acquisitions with concurrent mergers, new openings and closings

March 2018 − © Galenica                                                                                                                                12
3      Diversified product portfolio for health, beauty and wellbeing                                                                                 Retail

GaleniCare’s
retail product offering
in % of sales1

                                                                                                   12%

                                                                                                                  38%
                                                                                             19%
                                                                                                                          52%

                                                                                               17%
                                                                                                         4% 10%

                                      Beauty                  Nutrition, Personal                         OTC medicines     Prescription medicines
                                                              and Patient Care                                                  of which originals
                                                                                                                                of which generics
 1 Sales YTD December 2017, includes Amavita and SunStore pharmacies, without Mediservice,
   Winconcept and Coop Vitality                                                                                                 of which service fees
March 2018 − © Galenica                                                                                                                                      13
Leading role in Consumer Health
    3     with broad and innovative product portfolio                                                                                                                       Products & Brands
Portfolio                                                                                                                    Competitive position: #2 Consumer Health1 market position

    OTC consumer health brands                                                                                                                                                                      ORAL PAIN
                                                                                                                                                                                                    REMEDIES5

                                                                                                                             Market share2 (%)
                                                                                                                                                                                                       No. 1
                                                                                                                                                                                                  30% market share2
                                                                                                                                                 5.7      5.5      5.4
                                                                                                                                                                                                   TOPICAL PAIN
    Exclusive partner health                                                                                                                                                                        REMEDIES5
                                                                                                                                                                              3.4                      No. 3
    and beauty brands                                                                                                                                                                      2.6    14% market share2

                                                                                                                                                                                                   COUGH & COLD
    OTC retail own brands                                                                                                                                                                            REMEDIES5
                                                                                                                                                                                                       No. 2
                                                                                                                                                 No.1             No.3       No.4          No.5   12% market share2

Highlights
                                                                                                                                 Net sales performance (CHFm)3
    −   Preferred OTC partner for Swiss Pharmacists
                                                                                                                                                                       CAGR 5.8%
    −   Broad OTC Sales & Training force -> Distribution partner of choice
                                                                                                                                                                 844                 89               95
    −   Expanding portfolio of own and exclusive brands & products                                                                                  804

    −   Ability to leverage Galenicare Retail platform to distribute own brands

                                                                                                                                                   2014         2015                2016           2017
1       Includes OTC, Patient Care, Personal Care and Nutritionals products                                                                                     Growth on a comparable basis
2       Based on IQVIA Health MAT Dec 2017 gross sales value; IQVIA not including rebates, refunds or any sales deductions
3       2014-16 net sales on a comparable basis including 12 month Vifor Consumer Health sales and G-Pharma adjustment
4       Adjusted for disposal of Equazen® in November 2015
5       Market shares in categories are shown for Vifor Consumer Health, not including OTC retail own brands
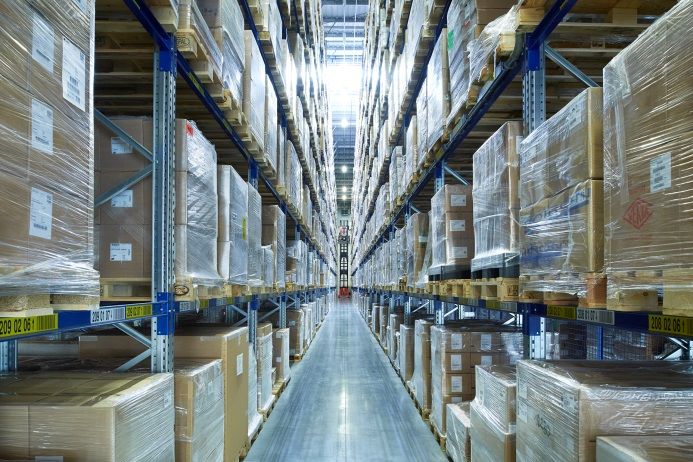
March 2018 − © Galenica                                                                                                                                                                                               14
Leader in pre-wholesale and wholesale distribution, supported
    3      by an innovative healthcare information business              Services

Services                                                                                               Competitive positioning - #1 market position1
                          − Pre-wholesale outsourced storage and distribution                          Pre-wholesale market share %              Wholesale market share %
                          − Logistics services to pharmaceutical and various healthcare clients                                                  (pharmacy)

                          − Wholesale distribution with three modern sites; main site at Niederbipp                            2.5x larger
                            operates at c.70% automation                                                                       than next                              2.0x larger
                          − Supplies to pharmacies, self-dispensing doctors' practices, drugstores,                            competitor                             than next
                            nursing homes and hospitals                                                                                                               competitor

                          − One-stop shop
                          − Prepared medication in blisters

                          − Product master data and scientific databases
                          − IT platforms relating to electronic medication process
                          − Software solutions and services for pharmacies                                             No. 2        No. 3                     No. 2        No. 3

Highlights                                                                                             Net sales performance (CHFm)
                      − 75 customers                          − Temperature zones:
                                                                                                                                          CAGR 4.8%
                      − >10,000 products                      − (i) -80⁰C, (ii) 2-8⁰C, (iii) 15-25⁰C

                      − 10,000 customers                      − Access to nearly all dispensers                                                       2'329              2'502
                                                                                                             2'171                2'245
                      − 100,000 products (c.9,000 Rx2) − Present in all three language regions
                      − >1,100 suppliers                      − GDP3-compliant services                                                                                   2.0
                                                                                                              1.7                  1.6                1.7
                      − Systemically relevant information and databases
                      − Solutions for safe and cost-effective provision and application
                        of medicines
                                                                                                             2014                 2015               2016                2017
                                                                                                                                          EBIT margin (%)
1       Based on market share. Source: IQVIA Dec 2017
2       Prescription products
3       Good Distribution Practice

March 2018 − © Galenica                                                                                                                                                             15
Long-term track record of sustainable growth and
    4                       attractive cash generation …
                                 Logistics, HealthCare Information & Retail1                                                               Galenica
                            2007–17 CAGRs
                            Retail market sales2 2.1%
                            Galenica net sales 4.2%
     Net sales (CHFm)

                                                                                                                                                              3'214
                            Galenica EBIT3      14.3%                                                                                            3'009
                                                                                               2'661        2'766       2'826           2'915                                                            Above market growth
                                                         2'467        2'526       2'603
                                2'129        2'270

                                                                                                                                                                                                 History of margin improvement
                                                                                                                                    4
                                2007         2008         2009        2010         2011        2012         2013         2014           2015      2016        2017
    Reported EBIT (CHFm)3

                              (40%)6        25%6          63%          70%          70%          78%         78%          74%           74%        80%          70%
                                                                                                                                                   134          148         5.0%                 Attractive cash flow generation
                                    % Cash conversion5                                                                    117           126
                                                                                                 93           99
                                    EBIT margin (%)3
                                                                       73           73
                                                 56
                                 39      39                                                                                                                                 2.5%

                                                                                                                                                                                                    Well-invested infrastructure
                                                                                                                                                                            0.0%
                               2007         2008         2009        2010         2011         2012         2013        2014            2015      2016         2017
Source:                     Company information, Galenica Annual Reports, IMS Health
Notes:                      The financial information presented with respect to the financial years ended 31 December 2007 through 2013 has been derived from the audited consolidated financial statements of Galenica AG and represent its Logistics, Retail
                            and Other (Healthcare Information) businesses, excluding the Pharma business (please refer to the footnote on page 4)
1                           Not including Vifor Consumer Health
2                           Retail market includes direct and indirect pharmaceutical sales through retail pharmacies, self-dispensing doctors and mail-order services
3                           2014-16 EBIT from combined financial statements and 2017 EBIT, excludes IAS 19 expense
4                           2013 financials as per 2014 financial statements due to changed segment structure (Galenica Santé is reported as a separate segment since 2014). Financials not adjusted to include Products & Brands
5                           Calculated as (EBITDA-capex)/EBITDA. 2014-17 EBITDA excludes IAS 19 adjustment; capex includes investments in tangible and intangible assets
6                           Cash conversion impacted by high Capex due to construction of Niederbipp logistic centre
March 2018 − © Galenica                                                                                                                                                                                                                                          16
4                  … demonstrating strong performance in both segments
                                                            Health & Beauty                                                                                                               Services

                                    Retail                                           Health & Beauty                                                   Logistics and HCI                                         Services
  Net sales (CHFm)

                                     19.5%                                                    3.6%                                                               1.2%                                               4.8%

                                                                                                                                                                                                                                             2'502
                                                                                                                                                                                                                              2'329
                                                                                                                                             2'011                           2'158           2'171           2'245

                                                                     1'335           1'393            1'437          1'483
                                                      1'246

                       429

                     2007A             …            2013AHealth & Beauty2015A
                                                              2014A                                 2016A           2017A                   2007A              …            2013AHealth & Beauty2015A
                                                                                                                                                                                      2014A                                 2016A            2017A

                                     25.3%                                                   7.7%                                                                10.3%                                            12.0%
                                                                                                                                                                                                                                                   9%
                                                                                                 93            100          9%
  EBIT (CHFm)

                                                                   80             89
                                                                                                                                                                                                                                                   6%
                                                    63                                                                      6%                                                                                                          51
                                                                                                              6.7%                                                                                                       40
                                                                                                                                                                             35            36             36
                                                                                                                                                                                                                                                   3%
                                                                                                                            3%                 20
                       16
                                                                                                                                                                                                                                      2.0%
                                                                                                                            0%                                                                                                                     0%
                                                                                                                                                              …
                     2007A           ……          2013A          2014A          2015A          2016A          2017A                          2007A                        2013A          2014A          2015A          2016A         2017A
                                                                                                             EBIT margin (%)                   CAGRs
Source:              Company information, Galenica Annual Reports
Note:                The financial information presented with respect to the financial years ended 31 December 2006 through 2013 has been derived from the audited consolidated financial statements of Galenica AG and represent its Logistics,
                     Retail and Other (Healthcare Information) businesses, excluding the Pharma business (please refer to the footnote on page 4)
March 2018 − © Galenica                                                                                                                                                                                                                              17
5        2017 in figures - Pleasing performance thanks to all Business sectors

 Galenica Group:
 in million CHF

 Sales:                     3,214.2             + 6.8%

 EBIT1):                    148.2               + 10.5%

 Net profit1):              124.4

 Dividend2):                CHF 1.65 per share

 1) Excluding the effects of IAS 19
 2) Proposal to the Annual General Meeting on 9 May 2018

March 2018 − © Galenica                                                            18
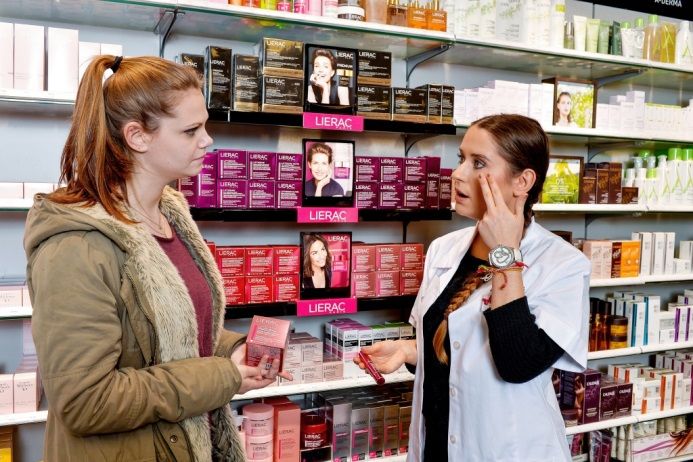
EXPANSION
  5      2017: expansion in all Business sectors

  Retail                          Products & Brands           Services
  8 new locations                 New products               Acquisitions
                                  and partnerships
  − Own pharmacies: 337           − Merfen® and Vita-Merfen® − Pharmapool
  − Total network:        ~ 500   − Beauty brands: Lierac,   − New exclusive
                                    Phyto                      partnerships
                                  − Partner brands: Excilor,   with Clarins and Coty
                                    Adler Schüssler mineral
                                    salts

March 2018 − © Galenica                                                          19
INNOVATION
  5      2017: new services for clients and partners

                          Retail - online   Services        Aprioris

                                                               b

     Uninterrupted cold chain                New products     Documedis
 (Deep freeze) cold chain (down to -80°C)

March 2018 − © Galenica                                                   20
EFFICIENCY
  5      2017: synergies developed and consistently utilised

  1. New ERP project
     (pre-wholesale and wholesale)

  2. Triapharm® introduced throughout the Group
     (incl. direct invoicing)                                  Synergies

  3. Back-office functions in Retail centralised
                                                                Healthcare
     and further process adjustments                           Information

March 2018 − © Galenica                                                      21
5       Swiss Pharmaceutical market − continuous value growth (YTD Dec 2017)

  Market1           Value CHFm Share                                           Change                                          Market1     Value CHFm   Share      Change

    Total:                5’824.6       100%                           -1.3%                                                   Retail2:      4’442.3    100%     -1.0%
                                                                                                   4.2%                                                                       3.0%

                                                              -4.0%                                                                                                -0.2%
   Hospitals:             1’382.3      23.7%                                                                                   RX3:          3’705.0    83.4%
                                                                                                               8.1%                                                            3.7%

                                                                         -0.5%                                                                                  -1.8%
   Physicians:            1’446.7      24.8%                                                                                   OTC4:           737.3    16.6%
                                                                                                     4.9%                                                           -0.4%

   Pharmacies:            2’933.8      50.4%                            -0.8%
                                                                                             2.3%                              Market development highlights:
                                                     -7.2%
                                                                                                                                Growth of high-priced special medications
   Drugstores:              61.8        1.1%
                                                        -5.4%                                                                   Growth in hospitals and specialist doctors
                                                                                                                                       channel
      Volume (sold packages)
      Value (at ex-factory prices)                                                                                              Declining volumes
                                                                                                                                Declining beauty and personal care market
Source: IQVIA, Pharmamarkt Schweiz, YTD December 2017
                                                                                                                                       (~ -3.5%5)
1 Medicines Swissmedic list A, B, C, D sold form suppliers and wholesalers to hospitals, physicians, pharmacies and drugstores
2 Medicines Swissmedic list A, B, C, D sold form suppliers and wholesalers to pharmacies, physicians and drugstores
3 Medicines Swissmedic list A, B
4 Medicines Swissmedic list C, D
5 IQVIA, PharmaTrend, YTD Dec, personal care, patient care and nutrition products sold in pharmacies and drugstores to street prices

March 2018 − © Galenica                                                                                                                                                               22
Galenica Group −
  5      Pleasing development in challenging market environment
                                Net sales (in million CHF)                                     EBIT adjusted1 (in million CHF)
                                                  +6.8%
                                                                                                                                +10.5%

                                               +6.8%         +6.9%                                                           +14.1%     +6.8%

                          49%       51%                49%           51%                                                              52%          48%
                                                                                            50%                 50%

                                                                                  4.5%              4.4%              4.5%    4.8%          4.4%         4.6%

                                                                           1   excluding the effects of IAS19                          EBIT Margin (ROS)

                            Highlights:
                             Strong growth thanks to:
                               - Acquisition of Pharmapool (about +4.9% impact on Group sales growth)
                               - Expanded pharmacy network (about +0.4% impact on Group sales growth)
                               - Growth of high-priced special medications mainly at Mediservice
                               - Launch of new products and partner brands
                             CHF 7.0 million positive one-off EBIT effects
                             5.3% EBIT growth without one-off effects
March 2018 − © Galenica                                                                                                                                         23
5      Health & Beauty segment − Solid growth and margin improvement
                                Net sales (in million CHF)                                    EBIT (in million CHF)
                                                  +3.2%
                                                   s                                                          +6.7%
                                                                                                               s

                                              +2.9%         +3.5%                                          +6.5%     +6.9%

                          49%      51%                49%           51%          50%          50%                  50%          50%

                                                                          6.6%                              6.8%         6.7%         6.7%
                                                                                       6.5%         6.5%

                                                                                                                     EBIT Margin (ROS)

   Highlights:
    1.1% Retail growth thanks to the expansion of the pharmacy network
    More than 20% growth of sales by mail order, mainly with high-priced special medications
    Like-for-like sales growth of generics in our pharmacies by about 6%
    Successful launch of Merfen® and partner brands Lierac, Phyto and Adler’s Schüssler mineral salts
    EBIT margin increase (+20 basis points) mainly thanks to strong growth of Products & Brands
March 2018 − © Galenica                                                                                                                      24
5      Net sales - Retail and Products & Brands

                                Retail (in million CHF)             Products & Brands (in million CHF)
                                                 +3.1%
                                                  s

                                                                                        +6.0%
                                                                                         s
                                            +2.5%     +3.6%
                                                                                     +6.8%      +5.2%

                          49%    51%                49%       51%
                                                                    54%                      54%
                                                                           46%                          46%

March 2018 − © Galenica                                                                                       25
5      Services segment − Expanded offering with Pharmapool
                                  Net sales (in million CHF)                                     EBIT (in million CHF)

                                                    +7.4%
                                                     s
                                                                                                                 +26.7%

                                                 +7.4%         +7.4%                                          +41.9%     +11.0%

                            49%      51%                 49%           51%                                             57%
                                                                                    51%          49%                                43%
                                                                                                               2.3%                       2.0%
                                                                             1.8%         1.7%         1.7%                  1.7%

                                                                                                                         EBIT Margin (ROS)

                          Highlights:
                           Successful integration of Pharmapool from day one on
                             (about +6.3% impact on sales growth of the Services segment)
                           Stable organic growth of about +1.1%
                           EBIT growth at 9.2% (resp. 7.5% H1) without one-off effects (CHF 7.0 million in H1)
                           ROS stable at 1.7% without one-off effects
March 2018 − © Galenica                                                                                                                          26
5      Net profit exceeds expectations
                                                                                of which one-off effects 2017
            (in million CHF)                                  2017     2016        disposals      deferred tax

            EBIT adj.1)                                      148.2    134.2         7 million
            (Effect of IAS 19)                                -6.4    -10.4

            EBIT                                             141.8    123.8         7 million

            Financial result                                   -1.9    -19.5

            EBT                                              139.9    104.3         7 million

            Taxes                                             -21.0    -20.9     -0.7 million      4.3 million
            Tax rates                                        15.0%    20.0%    +0.5% points     +3.1% points

            Net profit                                       118.9     83.4       6.3 million      4.3 million
            (Effect of IAS 19)                                -5.5     -8.7
            Net profit adj.1)                                124.4     92.1       6.3 million      4.3 million
March 2018 − © Galenica   1)   excluding effects of IAS 19                                                       27
5      Pleasing free cash flow

(in million CHF)

                                   Divestment of assets and disposal
                                   of subsidiaries

                                   Cash flow from operating
                                   activities

                                   Investments in assets
                                   Purchase of subsidiaries

March 2018 − © Galenica                                          28
5      Galenica Group − Robust balance sheet
                                 Investments in million CHF                                                                                          Net debt / Equity in million CHF
              % of sales               1.2%                                   1.7%
                                                                                                                               Debt coverage2                2.0x                                 1.6x
      Cash     conversion3             80%                                     70%
                                                                                                                                                                                            48%
                                                                                                                                                       45%

                                                                                                                                                                   21%                               17%

                                                                                                                                                                      1
                          Investments in intangible assets            Investments in tangible assets
                                                                                                                                                                   Equity        Net debt
                                                                                                                                                                % of Total liabilities and shareholders' equity

                          Highlights:
                           Without the acquisition of Merfen® and Vita-Merfen®,
                             capex at 1.3% of net sales and cash conversion at 78%
                           Net debt reduced to CHF 301 million
                                   1 shareholders’ equity and net debt of pro-forma balance sheet as of 1 January 2017
                                   2 calculated as net debt / EBITDA adjusted, excluding the effects of IAS 19
                                   3 calculated as (EBITDA-capex)/EBITDA, EBITDA excluding the effects of IAS 19, capex includes investments in tangible and intangible assets

March 2018 − © Galenica                                                                                                                                                                                           29
6      Swiss Pharmaceutical market – regulatory projects

          Reduction in drug
               prices               2018    2019      2020

   Change of category of
      OTC products1)
                                            2019

            LOA IV  LOA V                            2020

           Price of generics
            Amendment of Health                    from 2020   ….
            Insurance Act (KVG)

  1)   Swissmedic categories C, D
March 2018 − © Galenica                                             30
6                   Swiss Pharmaceutical market – regulatory matrix for products & channels
  Upcoming distribution changes expected to be largely favourable for pharmacies

                                                                        Hospital                   Doctor             Online pharmacies              Pharmacy                   Drugstore              Large retailers    Changes expected
                       Prescription

                                       Swissmedic A
                                                                                                                                                                                                                                                1
 Regulated4)

                                       Swissmedic B                                                                                                                                                                      Soft deregulation in
                                                      (1)                                                                                                                                                                drug categories        2
                                       Swissmedic C
                                                                                                                         Prohibited by law                                                                               towards the market
                         OTC

                                       Swissmedic D                                                                                                                                                                                             3
                                       Swissmedic E
Non-regulated4)

                                       Praxis-Lab-Utiltities

                                       Medtec

                                       Cosmetic and Body-Care

                                       House and Home

Regulatory changes in discussion have limited impact on Galenica

                  1   Prescription for select Cat. B drugs may no longer be required                                          Still, consumers likely to continue purchasing non-prescription Cat. B drugs in pharmacies

                  2   Drugstores could start to compete for Cat. C products(2)                                                Limited impact expected in light of market share drugstores already have in Cat. C drugs

                  3   Large retailers might compete strongly in Cat. D OTC products(3)                                        Impact likely strongest on drugstores

 Source:                    Swissmedic and company information
 Notes:                     FOPH stands for Federal Office of Public Health.
 1                          Category C medicinal products can only be sold through drugstores on an exceptional basis, i.e., if a canton concludes that a canton-wide dispensation cannot otherwise be achieved
 2                          Once Category C is integrated into Category D
 3                          Once these are re-classified into Category E
 4                          With respect to market access

March 2018 − © Galenica                                                                                                                                                                                                                             31
6      Swiss Pharmaceutical market – composition of drug prices
Fixed margin elements help to offset price reductions

Composition of the price of a prescription/ reimbursable drug: c.3/4 of the retail margin secured by fixed elements

        ~ 8 %(1) LOA – Retail                               ~ 8%          Per prescription / line
             service fees
                                                                                                                                           FOPH defines price and margin - Margin covers wholesale and retail
                          Reimbursed 

       ~ 28% - 30% Galenica                                                  ~ 24% Retail             ~ 2/3 Fixed            Ex-factory price
                                                           ~ 29%               +                                                                         + price-related surcharge        + surcharge per pack
        total margin; thereof                                                                                                (in CHF)
                                                                             ~ 5% Wholesale           ~ 1/3 Variable
       ~ 4% - 6% Wholesale                                                                                                   0.05-4.99                                12.0%                           4.00
                           Ex-factory                                                                                       5.00-10.99                               12.0%                           8.00
                                                                                                                             11.00-14.99                              12.0%                           12.00
                                                                                                                             15.00-879.99                             12.0%                           16.00
                                                                                                                             880.00-2,569.99                          7.0%                            60.00
 ~ 70% – 72% Supplier margin                                                                                                 From 2,570.00                             –                             240.00
                                                           ~ 71%

Market price structures and Galenica Santé's retail service fees limit impact of price cuts
 Ongoing ex-factory price declines                                          Pricing structure likely limits impact on Galenica Santé from margin squeeze

 Potential reduction in distribution margin                                 Potential reduction would be compensated with increase in service fee

 Potential new price model for generics                                     Would probably require change in legislation

Source: Swissmedic and company information                                                                                                                                               LOA: Service based compensation
Note:   FOPH stands for Federal Office of Public Health; sets prices based on basket of nine countries and quality aspects
1       Based on Company internal figures.

March 2018 − © Galenica                                                                                                                                                                                               32
7      Galenica Group − Outlook

  Dividends 2017

   CHF 1.65 dividend per share from capital contribution reserve1)

  Outlook for 2018

   Sales growth of 2% to 3%

   EBIT (excluding effect of IAS 19) similar to that in 2017

   2018 dividend at least at prior-year level
1) Proposal   to the Annual General Meeting on 9 May 2018

March 2018 − © Galenica                                               33
Galenica Group
Contact information

  Investor Relations             Media

  Felix Burkhard                 Christina Hertig
  CFO Galenica                   Head Corporate Communication
  Tel.: +41 58 852 85 29         Tel.: +41 58 852 85 17
  Mail: investors@galenica.com   Mail: media@galenica.com

March 2018 − © Galenica                                         34
Disclaimer

Certain statements, beliefs and opinions in this presentation are forward-looking, which reflect the Company’s or, as appropriate, the Company’s directors’ current
expectations and projections about future events. By their nature, forward-looking statements involve a number of risks, uncertainties and assumptions that could
cause actual results or events to differ materially from those expressed or implied by the forward-looking statements. These risks, uncertainties and assumptions
could adversely affect the outcome and financial effects of the plans and events described herein. A multitude of factors including, but not limited to, changes in
demand, competition and technology, can cause actual events, performance or results to differ significantly from any anticipated development. Forward-looking
statements contained in this presentation regarding past trends or activities should not be taken as a representation that such trends or activities will continue in the
future. As a result, the Company expressly disclaims any obligation or undertaking to release any update or revisions to any forward-looking statements in this
presentation as a result of any change in expectations or any change in events, conditions, assumptions or circumstances on which these forward-looking statements
are based. Neither the Company nor its advisers or representatives nor any of its of their parent or subsidiary undertakings or any such person’s officers or
employees guarantees that the assumptions underlying such forward-looking statements are free from errors nor does either accept any responsibility for the future
accuracy of the forward-looking statements contained in this presentation or the actual occurrence of the forecasted developments. You should not place undue
reliance on forward-looking statements, which speak only as of the date of this presentation.

March 2018 − © Galenica                                                                                                                                                     35
You can also read