Investor Day APRIL 21, 2021

 
CONTINUE READING
Investor Day APRIL 21, 2021
Investor Day
APRIL 21, 2021
Investor Day APRIL 21, 2021
Disclaimer
Cautionary Statements Concerning Forward-Looking Statements
This presentation contains forward-looking statements within the meaning of the Private Securities Litigation Reform Act of 1995, which involve substantial risks and/or
uncertainties, including those described in the MGM Resorts International public filings with the Securities and Exchange Commission. BetMGM has based forward-looking
statements on management’s current expectations, assumptions and projections about future events and trends. Examples of these statements include, but are not limited
to, BetMGM’s expectations regarding its financial outlook (including forecasted revenues and EBITDA margins), projected market share position and its expected growth in
new and existing jurisdictions. These forward-looking statements are not guarantees of future performance, conditions or results, and involve a number of known and
unknown risks, uncertainties, assumptions and other important factors, that could cause actual results or outcomes to differ materially from those discussed in the forward-
looking statements. Among the important factors that could cause actual results to differ materially from those indicated in such forward-looking statements include the
significant competition within the gaming and entertainment industry; the Company’s ability to execute on its business plan; changes in applicable laws or regulations,
particularly with respect to iGaming and online sports betting; the Company’s ability to manage growth and access the capital needed to support its growth plans; and the
Company’s ability to obtain the required licenses, permits and other approvals necessary to grow in existing and new jurisdictions. In providing forward-looking statements,
the Company is not undertaking any duty or obligation to update these statements publicly as a result of new information, future events or otherwise, except as required by
law. If the Company updates one or more forward-looking statements, no inference should be drawn that it will make additional updates with respect to those other forward-
looking statements.

Market and Industry Data
This presentation also contains estimates and information concerning BetMGM’s industry that are based on industry publications, reports and peer company public filings.
This information involves a number of assumptions and limitations and you are cautioned not to rely on or give undue weight to this information. The Company has not
independently verified the accuracy or completeness of the data contained in these industry publications, reports or filings. Third party logos and brands included in this
presentation are the property of their respective owners and are included for informational purposes only.

Important Note Regarding Non-GAAP Financial Measures
In this presentation we provide certain financial measures, including Net Revenue and Projected Net Revenue from operations, which have not been prepared in
accordance with GAAP. Management believes this presentation, which it uses for its own analysis of operations, is useful in that it reflects the true economic performance of
the business. If BetMGM presented these financial measures in accordance with GAAP, then BetMGM would present the revenues associated with its Nevada digital and
retail sports betting operations differently, until such time as BetMGM is directly licensed as a Nevada gaming operator. Currently under GAAP, its calculation of Net
Revenue would be on a basis net of operating costs, such that the GAAP reported Net Revenue would be lower than the Net Revenue reported herein, with Net Income
remaining the same.

                                                                                                                                                                           2
Investor Day APRIL 21, 2021
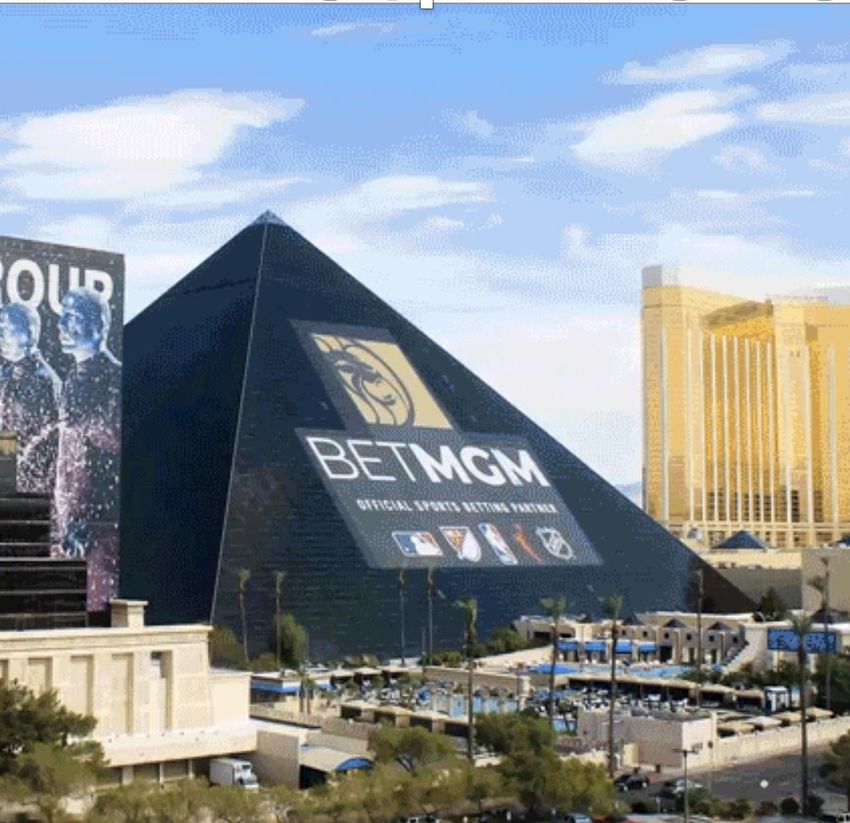
BetMGM is a winning combination of two industry leaders

                                                                                                                                                  Proprietary retail and
                                                                                                                                                  online technology
                                  35+ million                                                                                                     platform supported by
                             member database                                                                                                      2,000+ developers

      Iconic brands                                                                                                                                                  Leading global
       with 31 hotel                                                                                                                                                 online operator
        and gaming                                                                                                                                                   with over 50
       destinations                                                                                                                                                  licenses in 27
   across the globe                                                                                                                                                  jurisdictions

                                  Market access                                                                                                   Leading expertise in
                              in MGM operating                                                                                                    betting and online gaming,
                                    jurisdictions                                                                                                 with 600 dedicated traders
                                                                                                                                                  worldwide

                                                        $32B                               20% - 25%                                 $450M
                                                    Long-term total                            Long-term U.S.                      Investment this year
                                                  addressable market1                          market share1

           1 See   assumptions on page 9
           2 Total  market share by GGR for retail, Online Sports Betting (OSB) and iGaming across all active U.S. jurisdictions                                                       3
Investor Day APRIL 21, 2021
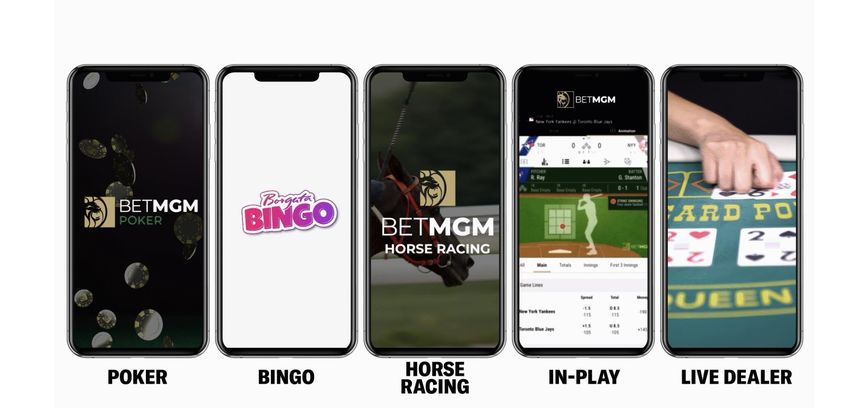
Agenda       Adam Greenblatt
                  Chief Executive Officer
   Business and
                  •
Market Overview
                      Deep experience in omni-channel gaming and
                      sports betting from both sides of the Atlantic

        Product   •   Previously Director of Corporate Development
                      and Strategy at Entain, Ladbrokes Coral and
      Marketing
                      Ladbrokes

                  •   Former mergers and acquisitions banker at
     Financials       Rothschild & Co

                  •
          Q&A
                      B.S. from the University of Cape Town

                                                                       5
Investor Day APRIL 21, 2021
Executive Summary

                           $163M                                                                 $1B+                                                                22%

                       Estimated Q1                                                       Forecasted 2022                                         February market share across
                     2021 net revenue1                                                      net revenue1                                             all active jurisdictions2

                             $32B                                                             20-25%                                                             30-35%

                     Long-term total                                                   Expected long-term                                                  Expected long-term
                addressable market (TAM)3                                              U.S. market share                                                    EBITDA margin1

      1 Netrevenues and profit margins from operations are based on how management analyzes the true economic performance of the business, which are not prepared in accordance with GAAP. Refer to page 2 for additional detail.
                                                                                                                                                                                                                                    6
      2 Totalmarket share by gross gaming revenue (GGR) for retail, online sports betting (OSB) and iGaming all U.S. jurisdictions where BetMGM is currently active
      3 See supporting assumptions on page 9
Investor Day APRIL 21, 2021
We have created a sustainable competitive advantage

National Market
Access
                                    Leading Product
•   Market access currently         and Technology
    secured or anticipated in                                      Efficient Player
    24 jurisdictions1
                                    •   Fully-featured
                                                                   Acquisition and Retention
•   Relationship with MGM               proprietary tech-stack                                    Responsible
                                                                                                  Gambling
                                                                                                                                Market leading
    Resorts minimizes cost
                                    •   Proven capability and      •   Omni-channel attracts
                                                                                                                                 position with
                                                                                                                                   superior
    of market access                                                   and retains players with
                                        superiority worldwide
                                                                       money-can’t-buy
•   Platform enables B2C
                                    •   Relationship with Entain       experiences                •   Longstanding history in
                                                                                                                                  economic
                                                                                                                                  structure
    and B2B entry                                                                                     responsible gambling
                                        provides structural cost                                      leadership
                                        advantage                  •   Award-winning rewards
                                                                       program builds loyalty
                                                                       and provides distinct      •   Committed to a
                                                                       competitive advantage          balanced approach to
                                                                                                      growth
                                                                   •   Strategic partnerships
                                                                       deliver players nationwide •   Our goal is to provide
                                                                       at attractive costs per        players with an
                                                                       acquisition (CPA)              entertaining and safe
                                                                                                      gambling experience

                      1 See   page 10 for additional detail
                                                                                                                                                 7
Investor Day APRIL 21, 2021
Built by a highly-experienced team

                        CRO
                        Matt Prevost

                        CFO
                        Gary Deutsch
                                                                500+
                                                                Employees
                                          VP Trading
                                          Jason Scott
                        COO
                        Ryan Spoon
                                          VP Gaming
                                          Matt Sunderland
      CEO               CTO
      Adam Greenblatt   Liron Snir                          Broad experience
                                          VP Strategy &      across gaming,
                                          Development        technology and
                                                                 media
                                          Witek Wacinski
                        CPO
                        Jarrod Schwarz
                                          VP Compliance
                                          Charles LaBoy
                        CHRO
                        Karen Baumwoll

                        CLO
                        Andrew Hagopian

                                                                               8
Investor Day APRIL 21, 2021
Massive long-term North American opportunity

              Total Long-Term
             Addressable Market                      U.S.     •   ~65% of the adult population
                                                     OSB
                                                              •   Average GGR per adult of ~$90

                    Canada
                     $4.4B

                                                      U.S.    •   ~35% of the adult population

                          $32B
                                                    iGaming
                                            U.S.              •   Average GGR per adult ~$160
                                            OSB
                      North American TAM   $14.1B

         U.S.
       iGaming
        $13.4B
                                                              •   ~65% of the adult population1
                                                    Canada
                                                              •   Average GGR per adult of ~$65 for
                                                                  OSB and ~$115 for iGaming

       1 Includes   OSB and iGaming
                                                                                                      9
Investor Day APRIL 21, 2021
Secured broad market access

        12                         20

         Active                 Expected live
     jurisdictions             jurisdictions in
                              next 12 months

      40%                          24

    Population with           Market access
  expected access in           secured or                             Live
   next 12 months1             anticipated2
                                                                      Market Access Secured or Anticipated2

                                                                      Current or Future Retail Location3

                 1 Approximate   U.S. adult population with access to OSB and / or iGaming in jurisdictions where BetMGM is expected to be active
                 2 Includes open license jurisdictions where BetMGM intends to apply for market access                                              10
                 3 Future locations at MGM properties subject to enabling legislation
Proven ability to win in different types of markets
                                                 Michigan                                             Colorado                                  New Jersey

        Market
      Position1
                                                      #1                                                   #1                                       #1
                                            OSB, iGaming, Retail                                         OSB (est.)                                 iGaming

      Products
                                        OSB         Gaming           Poker                                   OSB                              OSB   Gaming    Poker

         Day-1
        Launch

         Omni-
       channel

          Local
   Partnerships

            1 Based   on market share for products listed for last 3 month (L3M) period ended February 2021; CO based on internal estimates
                                                                                                                                                                      11
Poised to sustain rapid growth

   Monthly Gross Gaming Revenue (GGR)

                                                                                                                                           ✓ Proven ability to
                                                                                                                                             launch on day 1
                                                                                                       +400%
                                                                                                                     1

                                                                                                                                           ✓ Platform built to
                                                                                                                                             deliver rapid market
                                                                                                                                             rollout

                                                                                                                                           ✓ Top 3 in U.S. OSB2

Dec 2019             Mar 2020                        Jun 2020                     Sep 2020                      Dec 2020        Mar 2021   ✓ #1 in U.S. iGaming2

   State Launches

           WV   NV      MI                   CO                            OR                              TN     PA       IA
                IN                                                                                                         VA

                1 Represents  approximate increase in March 2021 GGR versus September 2020
                2 Measured   by GGR for the L3M period ended February 2021 across all U.S. jurisdictions                                                            12
Positioned to be a long-term market leader

Overall Estimated National Market Share1
35%

30%
                                                                                                                                                                               Competitor 1

25%

                                                                                                                                                                               BetMGM
20%

                                                                                                                                                                               Competitor 2
15%

10%
                                                                                                                                                                               Competitor 3

                                                                                                                                                                               Competitor 4
5%

0%
      Jan 2020   Feb 2020 Mar 2020 Apr 2020 May 2020 Jun 2020                   Jul 2020     Aug 2020 Sep 2020 Oct 2020 Nov 2020 Dec 2020 Jan 2021                  Feb 2021

                    1 Total
                          market share by GGR for retail, OSB and iGaming across all U.S., including jurisdictions where BetMGM is not currently active; internal
                    estimates used where operator-specific results are unavailable                                                                                                            13
Agenda       Ryan Spoon
                  Chief Operating Officer
   Business and
                  •
Market Overview
                      Deep product and technology experience across
                      the digital sports and media industries

        Product   •   Most recently served in various senior
                      leadership roles at ESPN, including SVP of
      Marketing
                      Social & Digital Content and SVP of Digital
                      Product and Design

     Financials   •   Former venture capitalist at Polaris Venture
                      Partners
          Q&A     •   B.A. from Duke University
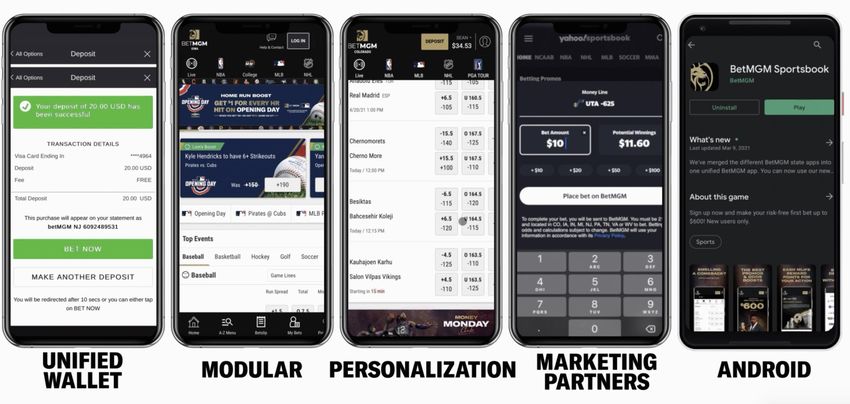
                                                                      14
Technology enables exceptional user experience

     Customer Channels                           Product Principles

        Sports Betting                               Simplicity

                             Enabled by our
           Casino                                      Speed
                              LEADING
                              GLOBAL &
                            PROPRIETARY
        Retail & Omni                                   Live
                            TECHNOLOGY

      Loyalty & Rewards                            Personalization

                                                                      15
Proprietary tech-stack provides competitive advantage

                       Multi-Brand
                                                     Competitive Advantages
                                                     ✓ Multi-brand capabilities
                      Omni-Channel

                                                     ✓ Seamless omni-channel offering

            Mobile    POS     Desktop    Kiosk
                                                     ✓ Best-in-class integrations
                       API Services
                                                     ✓ Robust player analytics

                                                     ✓ Superior operating flexibility
       Sportsbook    Casino      Poker       Bingo

                                                     ✓ Unmatched scalability
                Player Management System

                                                     ✓ Cost efficient
                Supporting Ecosystem Tools
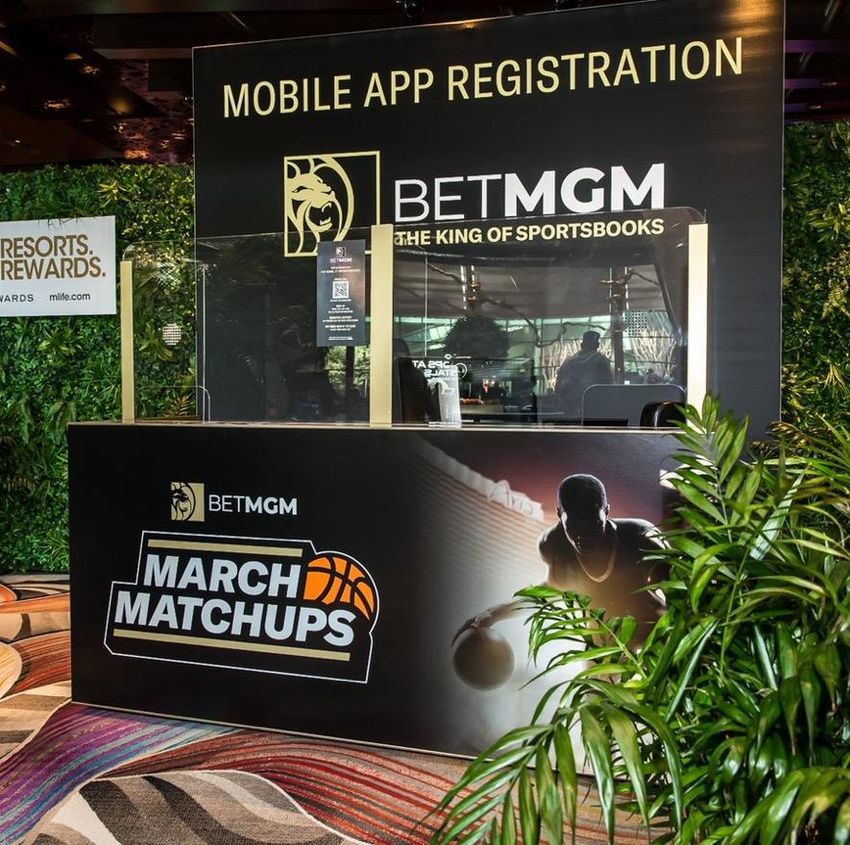
                                                                                        16
The King of Sportsbooks

    2M+
                      Sports bets per day made
                      through Entain platforms
                      worldwide

   43%                Of total handle comes from
                      in-play bets

  116%                Quarterly growth in parlay
                      bets

   33%                Of NV retail bets placed at
                      kiosks

        Player-centric
   platform optimizes the
      user experience

       All data for Q1 2021; quarterly growth versus Q4 2020
                                                               17
The market leader in iGaming

                                                                                                  #1    Market leader in U.S.
                                                                                                        iGaming market1

                                                                                                 674    Unique slot, table, and
                                                                                                        instant win games

                                                                                                 71%    Of iGaming players played
                                                                                                        in-house games2

                                                                                                 15%    iGaming GGR from Live
                                                                                                        Dealer games3

                                                                                                 Depth and exclusivity
                                                                                                 of content creates a
                                                                                                  competitive moat

       1 Measured  by GGR for the L3M period ended February 2021 across all U.S. jurisdictions
       2 March  2021 for all jurisdictions with active iGaming                                                                      18
       3 Last 12 month (LTM) period ended March 2021 for NJ only
More on the horizon

       1   Denotes ranking improvement in Eilers & Krejcik March 2021 U.S. Sports Betting App Rankings
                                                                                                         19
More on the horizon

                      20
More on the horizon

                      21
Agenda       Matt Prevost
                  Chief Revenue Officer
   Business and
                  •
Market Overview
                      Unique combination of brand leadership
                      experience and expertise in Europe’s most
                      competitive betting environment, with a deep
        Product       understanding of the U.S. and U.K. consumer
                      and media landscape
      Marketing   •   Previously served as the CMO of Coral
                      Interactive in Gibraltar
     Financials
                  •   Formerly an Operating Executive at Cerberus
          Q&A
                      Capital Management and consultant at
                      McKinsey

                  •   M.B.A. from the Kellogg School of Management
                      and B.S.E. from the University of Michigan

                                                                     22
Pillars of our marketing strategy

  1 Brand           2 Omni-Channel         3 Personalization        4 Integrated
                                                                      Partnerships

                                BI ENGINE

               Strategy leverages our competitive differentiation
                        and technological superiority to
            maximize ROI across all channels

                                                                                     23
1. The leading sports betting and gaming brand

                                                                                                                        84%     National MGM brand
                                                                                                                                awareness1

                                                                                                                        75%     75% of OSB players have
                                                                                                                                also engaged in iGaming2

                                                                                                                          15    Retail sportsbooks
                                                                                                                                nationwide, and growing

                                                                                                                        $250    Long-term CPA target

                                                                                                                         Our brand resonates
                                                                                                                         with both sports and
                                                                                                                           iGaming players

       1 Brand   awareness for MGM Resorts International; general U.S. population age 21+; 3 rd party market research
       2 For   MI only from launch through March 2021                                                                                                      24
2. Omni-channel starts with full loyalty integration

  35 million+                                                                                                                                                            24
                                                                                                                                                                 World class hotel and
                                               18%                                                                                            100%
    M life Rewards
       Members                                                                                                                                                   gaming destinations in
                                                                                                                                                                  the U.S. with loyalty
                                     Of FTDs in 2020 were                                                                                  of BetMGM players          integration
                                       active with MGM1                                    BEST LOYALTY PROGRAM                             enrolled in M life
                                                                                           Global Gaming Awards in 6 of the last 7 years

           1 First   time depositors (FTDs); includes M life players who were active in the 12 months prior to acquisition
                                                                                                                                                                                          25
2. Competitive differentiation through on-property experiences

                                                                            42.5M     Annual visitors to Las
                                                                                      Vegas1

                                                                            15.2M
                                                                                      Available room nights
                                                                                      annually at MGM U.S.
                                                                                      properties2,3

                                                                            9,000+
                                                                                      Publicly ticketed live
                                                                                      events held annually at
                                                                                      MGM properties2

                                                                            8,500+    On-property March
                                                                                      Madness registrations

                                                                            Brick-and-mortar presence
                                                                             feeds acquisition funnel
                                                                            and creates irreplaceable
                                                                                   experiences
        1 For 2019 per Las Vegas Convention and Visitors Authority Center
        2 For full year 2019                                                                                    26
        3 Includes CityCenter
2. The omni-channel advantage

         Non-MGM Sourced
         MGM Sourced1
         Est. Normalized Avg.
                                                                                                                   Marketing ROI is
                                                                                                                        5.4x
                                                                                                  157%

                                                                                                                   higher for MGM-
                                                                                                                   sourced players2
       100%                                                                      100%

                                                                                                                     Value of omni-
                                                                                                                      channel will
                                                                                                                  increase post-COVID
                        28%

                       CPA                                                                       GGR

       1 MGM    Sourced players include on-site registrations and other directly attributable marketing sources
       2 Marketing  ROI defined as GGR per month divided by cost per acquisition (CPA)                                                  27
       All information presented for Q1 2021
3. Utilizing customization to maximize player value
                                  Personalized marketing with dynamic elements
                                       results in 75% higher engagement1

                                             Dynamic item
                                             based on offer

                                              Personalized
                                              items based
                                              on behavior /
                                              value
                                                              Personalized
                                                              items based
                                                              on behavior /
                                                              value

        1 Measured   by click-through rate
                                                                                 28
3. Personalization enhances acquisition and retention

                                Acquisition

                                Retention

                 Right Offer. Right Segment. Right Time.
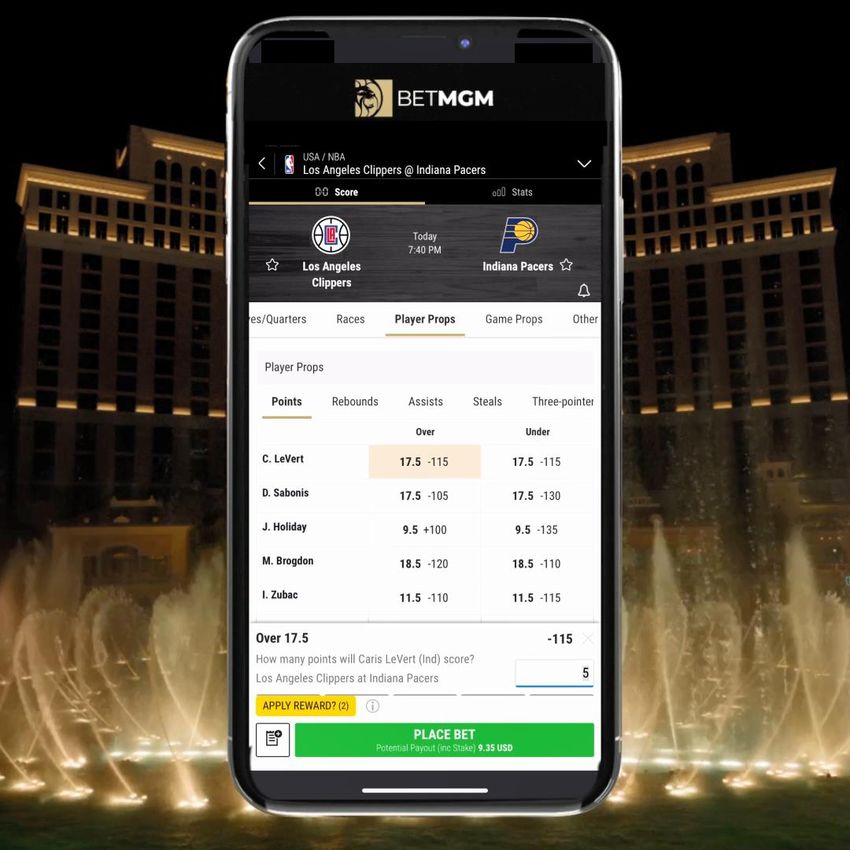
                                                           29
3. Personalization, a player experience
               Joe bet on the Yankees in                   Joe watched the game                    Joe is sent key game        Joe celebrates his team
                their last game. An hour                   live. The Yankees went                information throughout,       winning the game. 2 out
              before the game, he received                  ahead early and Joe’s               linking to in-play bets. He       of 3 bets paid out.
               an app notification with a                    parlay looked good.               shared the excitement with
                     pre-built parlay.                                                                  his friends.

  Meet Joe

   Baseball
     Parlay
    In-Play
   Yankees

                  He tapped the message and the                The Yankees recorded
                      app opened with a pre-                 another K, taking them to 6.
                    populated bet slip, making it            Joe received a push offering
                   easy to place the bet. Joe had            him current odds on 10+ Ks
                  more skin in the game and was                    for the Yankees.
                              excited.

                                               PLACE                                   PLACE
                                                BET                                     BET

              Pre-event                                In Play                                                                Event to Event

                                                                                                                                                     30
4. Integrated partnerships enhance and extend brand awareness

Media and
   Retail
                                                                                              28%

 National                                                                                 of all acquisition
                                                                                        from Partnerships &
                                                                                              Affiliates1

                                                                                            1,000+
 Regional

                                                                                          days of unique
                                                                                        player experiences

            1 Percentage   of total FTDs from partnerships and affiliates for Q1 2021
                                                                                                         31
4. Continually expanding Yahoo integration
                                                Seamless player journey   SSO Capabilities

           Yahoo       Betting-
           Sports      focused
          reaches       articles   #1 BetMGM
         ~70 million   received      referral
          fans per      ~220m        partner
           month       views in
                         2020

  Yahoo FTDs per Month

  2020                                 2021

                                                                                             32
4. Continually expanding Yahoo integration
                                                Integrated Content   Direct Link

           Yahoo       Betting-
           Sports      focused
          reaches       articles   #1 BetMGM
         ~70 million   received      referral
          fans per      ~220m        partner
           month       views in
                         2020

  Yahoo FTDs per Month

  2020                                 2021

                                                                                   33
BI engine enables rapid improvement in player metrics

                                              Acquisition                      Conversion                        Retention
     Business                         •     Predictive analysis pROI      • Pinpoint drop off within       • Personalization of
  Intelligence                              calculated within 7, 14, 21     conversion funnel                experience across player
     Enablers                               days
                                                                          • Reactive responses and
                                                                                                             lifecycle, value, and product
                                                                                                             preferences
                                      •     Optimization of offers by       proactive campaigns driven
                                            channel, product, state         by analytics and A/B testing   • Data-driven decision making
                                                                                                             around player segmentation
                                                                                                             and investment

                                                         FTDs                  Conversion Rate1             Active Days per Month2
         Key                                            +335%                       +31%                            +55%

 Performance
   Indicators

                                                Full            Q1’21
                                                Year            Actual
                                               Actual

                                               2020             2021E         Q1 2020        Q1 2021           Q1 2020        Q1 2021

         1 Defined   as FTDs divided by total registrations
         2 NJ   only across all products                                                                                                     34
Agenda       Gary Deutsch
                  Chief Financial Officer
   Business and
                  •
Market Overview
                      Strong understanding of early-stage venture
                      capital and private equity–backed startups

      Marketing   •   Most recently CFO and EVP Corporate
                      Development at New York–based marketing
        Product
                      services company, LiveIntent

                  •   Formerly served in various senior finance and
     Financials       strategy roles at Disney, Lucent Technologies,
                      M5 Networks and TagMan
          Q&A     •   M.B.A. from the Wharton School of Business
                      and B.S. from the University of Colorado,
                      Boulder

                                                                       35
Financial highlights

                         $163M                                                        $1B+                                                     $450M
                        Est. Q1 2021                                                 FY 2022                                                   Expected
                        Net Revenue1                                              Forecasted Net                                                Capital
                                                                                                                                              Consumed in
                                                                                    Revenue1                                                     20212

                Up 114% versus Q4’20 and                                 Driven by continued growth                                   2021 highest planned
                  nearly 90% of full year                                in current jurisdictions plus                              annual cash usage; $210M
                      2020 revenue                                            key new launches                                         drawn in prior years

                                                                                                                                              Committed
                        20-25%                                                     30-35%                                                      Investors

                   Expected long-term                                         Expected long-term                                 MGM and Entain committed to
                   U.S. market share                                           EBITDA margin1                                     continued efforts to increase
                                                                                                                                   market share and achieve
                                                                                                                                       profitability targets
        1 Net revenues and profit margins from operations are based on how management analyzes the true economic performance of the business, which are not prepared in accordance with GAAP.
        Refer to page 2 for additional detail.                                                                                                                                                  36
        2 Total expected capital consumed for opex and capex.
Path to state-level profitability

                                                                                                     4. Growing Annuity
                                                                                                      Steady base of real-money
                                                                     3. Cumulative                    players yields long-term cash
                                                                        Payback                       flow

                                                                      Cumulative profit from all
                                      2. Contribution                 cohorts exceeds upfront
                                         Breakeven                    market access and
                                                                      cumulative acquisition costs
                                       Cash flow from maturing        of all cohorts
                                       cohorts exceeds acquisition
    1. Acquisition                     cost of new cohorts

     Player acquisition costs drive
     upfront cash burn

           First 3 months                     10-24 months                     2-3 years                    Year 3 onward

                                                                                                                                      37
1. Acquisition

Key determinants of player acquisition cost:             Illustrative Cohort Analysis

•   Omni-presence                                        The majority of churn                                     Churn stabilizes while
                                                           happens quickly                                             player values
                                                                                                                     continue to grow
•   Entry at market launch
                                                                                                                        Player Value1
•   Multiple products for cross-sell

              Digital Sports Q1 2021 TN CPA was 41%
              lower than NJ
                                                                                                                       Retention Rate

              75% of digital sports players in MI have
              also engaged in iGaming                     1     2      3     4   5        6         7          8   9      10     11     12
                                                                                     Months from Acquisition

              1 Defined   as NGR per active player
                                                                                                                                        38
2. Contribution breakeven

Key determinants of contribution breakeven:             Illustrative State Breakeven

•   State Tax Rates
                                                                                                         Overall
•   Market Access Revenue Shares                                                                    Contribution

•   Market-specific Player Values
                                                                                                                   Individual
                                                                                                                     Cohorts

                                                        Profitability
             VA NGR per player already hit highest of                                                                   Time
             all digital states in March 2021                                                                           from
                                                                                                                      launch

             MI forecasted to be contribution
             breakeven by Q1 2022
                                                                        Average time to
                                                                                          OSB: 12-24 months
                                                                           Contribution
                                                                                          iGaming: 10-14 months
                                                                             Breakeven

                                                                                                                                39
3. Cumulative Payback

Key determinants of cumulative payback:                                                                 NJ NGR and Contribution1
                                                                                                                   2018/19 cohort     2020 cohort           2021 cohort              2022 cohort
•   Upfront Market Access or Licensing Costs

•   Player CPAs                                                                                                                                                $203

•   State-specific cost & player economics
                                                                                                                                    $114

                                                                                                                                                                          $60
                                                                                                             $41
             NJ expected to achieve full payback in
             Q3 2021                                                                                                                              $2
                                                                                                             NGR   Contribution
                                                                                                                   Contribution     NGR     Contribution       NGR    Contribution            NGR     Contribution

                                                                                                                     $(34)

                                                                                                                   2019                    2020                   2021E                            2022E
             With optimal conditions, MI is on track to
             payback in about 2 years
                                                                                                                     Average time to
                                                                                                                                                           OSB: 3 years mid-case
                                                                                                                         Cumulative
                                                                                                                                                           iGaming: 2 years mid-case
                                                                                                                           Payback
              1 NJ   data based on BetMGM tracking of the “true economics” of the operating business in NJ
                                                                                                                                                                                                                     40
4. Growing annuity

Key determinants of annuity value:
                                                                                    Player Value1
•   Loyalty & Retention Marketing
                                                                          NGR                         Player Retention
                                                                          +14%                              96%
•   Customer Service

•   Product Experience

                                                                  Q4'20            Q1'21              Q4'20       Q1'21

             NJ NGR per active for players active in
             Q1 2020 grew by 147% in Q1 2021 for that
             same group of players2
                                                                                         NGR per Active
                                                                                             +18%

                                                                                 Q4'20                    Q1'21

             1 Data  for June 2020 cohorts and earlier; NJ only
             2 Q1   excludes March due to COVID-impact                                                                    41
Long-term profit outlook

Long-term Margin Target1
                                                                                                                       Structural Cost
  100%                                                                                                                   Advantages

                                                                                                               ✓ Omni-channel reduces marketing
                                                                                                                 spend, increases retention and
                                                                       57-60%
                                                                                                                 increases player value

                                                                                                               ✓ In-house tech significantly cheaper
                                                                                                      30-35%
                                                                                                               ✓ Revenue share lower due to MGM
                                                                                                                 market access

                                                                                                               ✓ Scale supports national advertising
Net Gaming   Taxes           Operating Costs2     Direct Labor      Gross Margin        Marketing &   EBITDA
 Revenue                                                                                  SG&A

         The benefits from the support of MGM and Entain point to strong long-term
                 gross margins and long-term EBITDA margins of 30-35%

              1 Non-GAAP     performance indicators
              2 Includes   market access, payment processing, geolocation, KYC and datacenter costs                                                    42
Conclusion

                                                                                             $32B long-term North American market opportunity1

                                                                                                          Sustainable competitive advantage through proprietary
                                                                                                          technology, product, loyalty and omni-channel

                                                                                                             20-25% expected long-term U.S. market share

                                                                                                          Advantaged cost structure with 30-35% expected long-term
                                                                                                          EBITDA margin at scale2

                                                                                              $1B+ forecasted net revenue in 20222

       1 See    supporting assumptions on page 9
                                                                                                                                                                                                                                        43
       2 Net   revenues and profit margins from operations are based on how management analyzes the true economic performance of the business, which are not prepared in accordance with GAAP. Refer to page 2 for additional detail.
To ask a question, please connect via the live
      audio dial-in details below:
      US:               +1 (833) 562-0152

Q&A
      UK:               +44 (0) 20 3107 0289
      International:    +1 (661) 567-1234
      Conference ID: 3511619
You can also read