ASIA PACIFIC 2017 MARKET SNAPSHOT: HVS
←
→
Page content transcription
If your browser does not render page correctly, please read the page content below
OCTOBER 2017

          MARKET SNAPSHOT:
          ASIA PACIFIC 2017
          (EXCLUDING CHINA & INDIA)

                                                                       Jeremy Teo
                                                                       Analyst

                                                                       Kyu Baek Kim
                                                                       Analyst

                                                                       Victoria Chan
                                                                       Senior Analyst

                                                                       Chee Hok Yean
                                                                       Managing Partner

HVS.com             HVS Singapore | 137 Market Street, #04-02 Grace Global Raffles, Singapore 048943
SOUTH KOREA                   JAPAN

                          VIETNAM
           MYANMAR

               THAILAND
                          CAMBODIA          PHILIPPINES

              MALAYSIA
MALDIVES                  SINGAPORE

                            INDONESIA

                                                     AUSTRALIA

                                                          NEW ZEALAND

                                    MARKET SNAPSHOT: ASIA PACIFIC 2017 | PAGE 1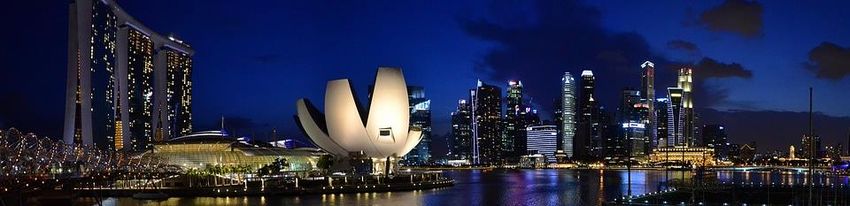
Transactions in Asia Pacific
Over the past twelve months from October 2016 to September 2017, HVS has noted close to 240 transactions
across Asia Pacific worth approximately US$12 billion. In comparison to the same period the previous year,
transaction volume in Asia Pacific has increased by almost 12% with China contributing to 40% of the hotel
transaction volume in the region. The largest transaction recorded was the portfolio of over 75 properties under
Dalian Wanda China.

Over the period from October 2016 to September 2017, Asia Pacific (excluding China and India) witnessed a total
hotel transaction volume of almost US$4.4 billion as compared to approximately US$8.6 billion in the previous
year. Reasons for slower transactional activity in the region include owners holding onto hospitality assets due to
future growth potential, lack of capital strength from buyers, desire to hold onto ownership of marquee hospitality
assets, amongst others.

                                Transaction History in Asia Pacific by Quarter (2013 - YTD SEP 2017)
                 10                                                                                                                                 190      200

                  9                                                                                                                                          180

                  8                                                                                                                                          160
                                                                                                                                                  144

                                                                                                                                                                   Number of Transactions
                  7                                                                                                                                          140
                                                                                                                                         120
                  6                                                                                                                                          120
                                                                  104
 USD (billion)

                  5                                 92                                         90                                                            100
                                               80           79                     77
                                75   72
                  4                                                                                                                                          80
                      61                                                   60                         62
                                          57                                                                                 53         41
                  3                                                                                           38                                             60
                                                                                                                     44
                  2        32                                                                                                      29                        40

                  1                                                                                                                                          20

                  0                                                                                                                                          0
                      2013 2013 2013 2013 2014 2014 2014 2014 2015 2015 2015 2015 2016 2016 2016 2016 2017 2017 2017                             YTD YTD
                       Q1   Q2   Q3   Q4   Q1   Q2   Q3   Q4   Q1   Q2   Q3   Q4   Q1   Q2   Q3   Q4   Q1   Q2   Q3                               Sep Sep
                                                                                                                                                 2016 2017

Source: RCA Analytics & HVS Research                     Australia & New Zealand        Asia        Total Number of Transactions

Regional Share of Hotel Transaction Volume
We note that the majority of hotel transaction volume
is still directed towards Australia, Japan and South
Korea, similar to the previous period of October 2016
to September 2017.

As compared to the previous period, hotel transaction
volumes in Indonesia, Malaysia and Thailand have
seen strong positive growths while Australia,
Cambodia, Maldives, South Korea and Singapore have
remained fairly stable. Markets such as Japan,
Myanmar, New Zealand, Philippines and Vietnam
were found to be less active.

                                                                                           Source: RCA Analytics & HVS Research

Investor Profile
With a share of approximately 24%, the “developer/owner” dominates the hotel transactions in Asia Pacific and the
“real estate operating companies” follows closely after at 23.5%.

The majority of the investors who invest heavily within the Asia Pacific region are located in more developed
countries such as Australia, Japan and Singapore.

                                                                                                                             MARKET SNAPSHOT: ASIA PACIFIC 2017 | PAGE 2
Australia

Key Points                              Demand
                                        In the first half of 2017, tourist arrivals displayed positive year-on-year (y-o-y)
         Tourism directly contributes   growth. Total arrivals of 4.2 million outperformed last year’s arrivals by 7%
         2.9% to GDP in 2016            and China overtook New Zealand as the top source market with a 16% market
                                        share. Arrivals from China recorded an 8% y-o-y growth, significantly higher
                                        than the 1% y-o-y growth for arrivals from New Zealand. Domestic visitors
         2.6% Real GDP growth           continue to play a major role as they account for 57% of total room nights
         expected in 2017               occupied in 2016.
                                        Supply
         7.6 million international                                                     June 2017
         tourist arrivals recorded in
                                                     June 2017                                                         June 2017
                                                     4,600                             264,700                         5% y-o-y
         2016
                                                     Establishments                    Rooms                           growth
                                        Source: HVS Research
Highlights
                                        HVS has noted that, going forward, there will be 140 additional hotels with
Infrastructure Projects                 approximately 26,000 keys in Australia by 2020, having 16 hotels opened in
• A$500 million expansion of Sydney     the first half of 2017.
    Airport by 2020

New Hotel Openings in Sydney and        Sydney and Melbourne Hotel Performance 2016 vs. 2017F
Melbourne
                                            Sydney             Melbourne
2017                                                                          Sydney
                                                                                         A$230 (2017F)
                                                                                                            Sydney     A$200 (2017F)
• Little Albion, 35 keys                                                                      vs.                           vs.
                                                                               ADR       A$220 (2016)       RevPAR     A$190 (2016)
• Felix Sydney Airport, 150 keys
• PARKROYAL Melbourne                       Occupancy           Occupancy                A$185 (2017F)                 A$155 (2017F)
   Docklands, 281 keys                     87% (2017F)         83% (2017F)   Melbourne        vs.          Melbourne        vs.
• Sofitel Sydney Darling Harbour,              vs.                 vs.         ADR       A$185 (2016)       RevPAR     A$155 (2016)
                                           85% (2016)          84% (2016)
   590 keys
                                        As of year-to-date (YTD) June 2017, hotel occupancy in Sydney increased by
2018-2020
                                        1%, while occupancy in Melbourne decreased by a marginal 0.2%. Sydney’s
• Luxury: 2 Hotels, 534 keys
                                        room rates increased significantly by 5.5% y-o-y, while Melbourne’s room
• Upper Upscale: 11 Hotels,
                                        rates remained constant.
• 1,739 keys
• Upscale: 7 Hotels, 1,425 keys         Transactions
• Upper Midscale: 6 Hotels,
                                        Although      total   volume    of
• 1,434 keys
                                        investment activity across both
• Midscale: 2 Hotels, 371 keys
• Independent: 7 Hotels, 1,297 keys     cities has been increasing y-o-y
                                        from 2012 to 2016, investment
Notable Transactions                    activity has been relatively muted
• 402-key W Sydney Hotel, slated to     even till YTD September 2017
   open in 2021, transacted at A$532    with two transactions recorded in
   million (A$1.3m/key) in June 2016    Melbourne. Over the last five
                                        years, Singaporean investors
                                        accounts for the bulk of
                                        investment volume with a 28%               Source: RCA Analytics
                                        share.

                                                                                  MARKET SNAPSHOT: ASIA PACIFIC 2017 | PAGE 3
Cambodia

Key Points                              Demand
                                        In the first four months of 2017, tourist arrivals displayed significant y-o-y
         Tourism directly contributes   growth. YTD April 2017 arrivals of 1.9 million surpassed last year’s arrivals by
         12.3% to GDP in 2016           12%, with China making up 19% of total arrivals and overtaking Vietnam as
                                        the top source market. In 2016, 2.8 million and 2.2 million international
                                        visitors visited Phnom Penh and Siem Reap, respectively. Total tourism
         7.0% Real GDP growth           receipts for 2016 recorded US$3,212 million, representing a 7% y-o-y
         expected in 2017               increase. Going forward, Cambodia is set to enter into a new Angkor-Bagan
                                        Tourism Cooperation campaign with Myanmar to jointly promote the two
                                        destinations.
         5.0 million international
         tourist arrivals recorded in   Supply
         2016
                                                    June 2017                   June 2017                      June 2017
                                                    159                         17,400                         4% y-o-y
Highlights                                          Establishments              Rooms                          growth
                                        Source: HVS Research
Infrastructure Projects                 HVS has noted that, going forward, there will be 14 additional hotels with
• Recent expansions of Phnom Penh       approximately 3,100 keys in Cambodia by 2020, having two hotels opened in
    International Airport and Siem      the first half of 2017. The addition of luxury brands such as Rosewood,
    Reap      International  Airport    Shangri-La, and Okura to Cambodia’s hotel portfolio will further solidify the
    expected to boost the annual        attractiveness of the destination.
    capacity to 5 million
• Yunnan Investment Holdings Ltd        Phnom Penh and Siem Reap Hotel Performance 2016 vs. 2017F
    (YIHL) to build and manage the
    US$880 million new Siem Reap         Phnom Penh            Siem Reap
                                                                             Phnom   US$160 (2017F)   Phnom    US$75 (2017F)
    Airport by 2025                                                           Penh        vs.          Penh         vs.
                                                                              ADR    US$155 (2016)    RevPAR   US$80 (2016)
New Hotel Openings in Cambodia                                  Occupancy
                                            Occupancy                        Siem                      Siem
2017                                       45% (2017F)         75% (2017F)           US$120 (2017F)            US$90 (2017F)
                                                                             Reap                      Reap         vs.
• Royal Sands Koh Rong Resort, 67              vs.                 vs.                    vs.
                                                                                                      RevPAR   US$85 (2016)
                                                                             ADR     US$120 (2016)
   keys                                    50% (2016)          68% (2016)
• Rosewood Phnom Penh, 175 keys
                                        Based on our analysis of a few luxury hotels in Phnom Penh and Siem Reap, we
• Naga2, 1,033 keys
                                        have estimated in 2016 an average occupancy of 50% and 68%, with an ADR of
2018-2020                               US$155 and US$120, respectively. HVS noted that, going forward, hotels in Phnom
• Luxury: 2 Hotels, 435 keys            Penh will improve in ADR performance, while hotels in Siem Reap are likely to
• Upper Upscale: 2 Hotels, 500 keys     improve in occupancy performance.
• Upscale: 2 Hotels, 388 keys           Transactions
• Upper Midscale: 1 Hotel, 105 keys
                                        There have been limited transactions in Cambodia, with only four
• Midscale: 1 Hotel, 112 keys
                                        transactions recorded in the last five years. According to the Council for the
                                        Development of Cambodia (CDC), investment from China accounted for 30%
Notable Transactions
• 88-key Lumiere Hotel in Phnom         of the total US$3.6 billion foreign direct investment (FDI) into Cambodia in
   Penh transacted at US$14.3 million   2016. Going forward, investment is expected to increase with the improving
   (US$162k/key) in May 2017            relationship between both nations. To date, a Chinese real estate developer
                                        and Indian hospitality firm have stated their intentions to invest in Cambodia.
                                        However, the main challenges that deter investments, such as the lack of
                                        infrastructural developments and regulatory weaknesses, remain.

                                                                               MARKET SNAPSHOT: ASIA PACIFIC 2017 | PAGE 4
Indonesia

Key Points                                Demand
                                          In the first half of 2017, tourist arrivals displayed a robust y-o-y growth. YTD
          Tourism directly contributes    June 2017 arrivals of 6.5 million outstripped last year’s arrivals by 22%. China
          1.8% to GDP in 2016             is the main source market for Indonesia as of YTD June 2017, followed by
                                          Singapore, Malaysia, Australia, and Japan. The top 5 source markets, though
                                          the number of Singapore tourists have overtaken Malaysian tourists, remain
          5.1% Real GDP growth            unchanged from 2016.
          expected in 2017
                                          Supply
          11.5 million international                   2016                                   2016                             2016
          tourist arrivals recorded in                 18,829                                 527,176                          4% y-o-y
          2016                                         Establishments                         Rooms                            growth
                                          Source: Badan Pusat Statistik Indonesia

Highlights                                HVS has noted that, going forward, there will be 240 additional hotels with
                                          approximately 44,600 keys in Indonesia by 2020, having 21 hotels opened in
Infrastructure Projects                   the first half of 2017.
• Infrastructure development budget
    of Rp388 trillion allocated in 2017   Jakarta and Bali Hotel Performance 2016 vs. 2017F
• Renovation of Soekarno-Hatta
                                             Jakarta               Bali
    International Airport by 2018                                                                                             Rp613,000 (2017F)
                                                                                    Jakarta Rp1,040,000 (2017F)      Jakarta
                                                                                                                                  vs.
                                                                                                    vs.
                                                                                      ADR                            RevPAR Rp620,000 (2016)
New Hotel Openings in Bali and                                                              Rp1,070,000 (2016)
Jakarta                                      Occupancy           Occupancy
                                                                                             Rp1,480,000 (2017F)              Rp1,050,000 (2017F)
2018-2020                                   59% (2017F)         71% (2017F)          Bali                              Bali
                                                                                                                                      vs.
                                                                                                     vs.
• Luxury: 25 Hotels, 4,278 keys                 vs.                 vs.              ADR     Rp1,470,000 (2016)
                                                                                                                     RevPAR    Rp970,000 (2016)
                                            58% (2016)          66% (2016)
• Upper Upscale: 8 Hotels, 1,897
   keys                                   While Jakarta recorded a drop of 1.4% in occupancy as of YTD June 2017,
• Upscale: 17 Hotels, 3,788 keys          Bali’s occupancy increased by 6.1% over the same period. Bali’s room rates
• Upper Midscale: 17 Hotels, 4,541        remain competitive, while downward pressure can be observed on Jakarta’s
   keys                                   room rates.
• Midscale: 12 Hotels, 2,362 keys
• Economy: 1 Hotel, 105 keys
• Independent: 1 Hotel, 180 keys          Transactions
                                          Recently, it was observed that
Notable Transactions                      Singaporean investors, historically the
• 317-key Pullman Jakarta Central         most active in the market, slowed
   Park and 415-key Sofitel Bali Nusa     down their investments in Indonesia.
   Dua Beach Resort was sold for          Notable investments in 2017 have
   Rp1.3 trillion (Rp4.1bn/key) and       been made by Strategic Hospitality
   Rp1.7 trillion (Rp4.0bn/key),          F&L REIT of Thailand in both Jakarta
   respectively in August 2017 to         and Bali. The most recent transaction
   Strategic Hospitality F&L REIT         in Indonesia was the 192-key Ascott
                                          Sudirman Jakarta, which sold for
                                          Rp730 billion (Rp3.8bn/key).
                                                                                                   Source: RCA Analytics

                                                                                            MARKET SNAPSHOT: ASIA PACIFIC 2017 | PAGE 5
Japan

Key Points                               Demand
                                         In the first half of 2017, tourist arrivals displayed positive y-o-y growth. YTD
                                         June 2017 arrivals of 13.8 million exceeded last year’s arrivals by 17%. Since
          Tourism directly contributes   2015, China has outpaced South Korea as the top source market, making up
          2.3% to GDP in 2016
                                         27% of total tourist arrivals as of YTD June 2017. Both China and South Korea
                                         continue to show significant y-o-y growth of 28% and 27%, respectively.
                                         Domestic passengers, accounting for 45% of all passenger movements across
         1.5% Real GDP growth
                                         all four airports in Tokyo and Osaka, increased by 8% y-o-y.
         expected in 2017
                                         Supply
          24.0 million international                  June 2017                   June 2017                            June 2017
          tourist arrivals recorded in                                            580,000
                                                      3,400                                                            3% y-o-y
          2016
                                                      Establishments              Rooms                                growth
                                         Source: HVS Research
Highlights
                                         HVS has noted that, going forward, there will be 57 additional hotels with
Infrastructure Projects                  approximately 16,200 keys in Japan by 2020, having 23 hotels opened in the
• First phase of the Maglev line by      first half of 2017.
    2027
• ¥160 billion expansion of Narita       Tokyo and Osaka Hotel Performance 2016 vs. 2017F
    International Airport by 2020             Tokyo              Osaka
• Expansion of Haneda International                                           Tokyo     ¥19,235 (2017F)        Tokyo
                                                                                                                       ¥16,570 (2017F)
    Airport by 2020                                                            ADR            vs.             RevPAR
                                                                                                                             vs.
                                                                                        ¥19,185 (2016)                 ¥16,385 (2016)

New Hotel Openings in Tokyo &                Occupancy           Occupancy
                                                                                        ¥15,790 (2017F)                ¥14,345 (2017F)
Osaka                                       86% (2017F)         91% (2017F)   Osaka                            Osaka
                                                                                                                             vs.
                                                vs.                 vs.                       vs.             RevPAR
2017                                                                           ADR
                                                                                        ¥16,275 (2016)                 ¥14,620 (2016)
                                            85% (2016)          90% (2016)
• Sotetsu Fresa Inn Ginza-Sanchome,
   147 keys                              As of YTD June 2017, Tokyo and Osaka hotel markets recorded a y-o-y
• Sotetsu Fresa Inn Ueno                 increase in occupancy of 1.2% and 1.4%, respectively. Tokyo’s room rates
   Okachimachi, 155 keys                 remain competitive, while downward pressure can be observed on Osaka’s
• MOXY Osaka Honmochi, 155 keys          room rates.
• Sotetsu Fresa Inn Tokyo Roppongi,
   201 keys                              Transactions
• MOXY Tokyo Kinshicho, 205 keys
                                         With the exception of Tokyo, the
• Sotetsu Fresa Inn Tokyo-Kinshicho,
                                         transaction volume in Japan has been
   281 keys
                                         fairly evenly distributed across
2018-2020                                several markets. Investment interest
• Luxury: 3 Hotels, 597 keys             in Chubu and Hiroshima have
• Upper Upscale: 5 Hotels, 1,380         outpaced popular tourist markets like
   keys                                  Kyoto and Okinawa. From the time
• Upscale: 1 Hotel, 1,000 keys           that investments peaked in 2015 with
• Upper Midscale: 1 Hotel, 205 keys      196 transactions, activity has steadily
• Independent: 7 Hotels, 2,137 keys
                                         decreased. Only 36 transactions have
                                         been recorded as of YTD September
Notable Transactions
                                         2017, compared to 90 in YTD
• 884-key Hotel Grand Pacific
   Meridien sold for ¥65.6 billion
                                         September 2016.                              Source: RCA Analytics

   (¥74m/key) in May 2016                                                       MARKET SNAPSHOT: ASIA PACIFIC 2017 | PAGE 6
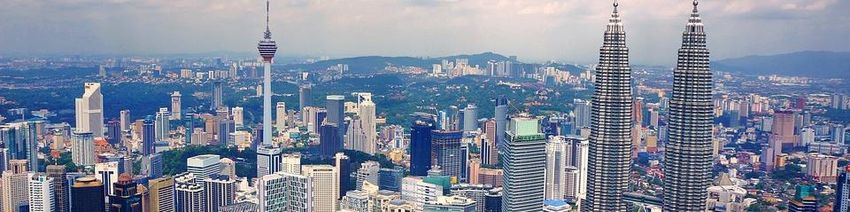
Malaysia

Key Points                              Demand
                                        Tourist arrivals in Malaysia have rebounded since the low of 2015.
                                        However, international tourist arrivals during the first half of 2017 were
         Tourism directly contributes
         4.7% to GDP in 2016            marginally lower than that of 2016 by 1%. Singapore remains the top
                                        source market (50%) while arrivals from Thailand exhibit the most
                                        significant growth of 33% y-o-y. Domestic guests continue to make up the
          5.2% Real GDP growth          majority of the market with a 65% share.
          expected in 2017
                                        Supply
                                                    2016                          2016                                   2016
         26.8 million international
                                                    4,961                         321,972                                6% y-o-y
         tourist arrivals recorded in
         2016                                       Establishments                Rooms                                  growth
                                        Source: Tourism Malaysia

Highlights                              HVS has noted that, going forward, there will be 85 additional hotels with
                                        approximately 21,600 keys in Malaysia by 2020, having nine hotels opened in
Infrastructure Projects                 the first half of 2017.
• Upgrade of Swettenham Pier
    Cruise Terminal in Penang by 2017
• RM4.4 billion expansions and          Kuala Lumpur and Kota Kinabalu Hotel Performance 2016 vs. 2017F
    upgrades of airports (Kuala         Kuala Lumpur       Kota Kinabalu
    Lumpur, Johor, Penang, Kedah,                                           Kuala     RM360 (2017F)            Kuala     RM250 (2017F)
    Sabah, and Selangor) by 2021                                           Lumpur         vs.                 Lumpur         vs.
                                                                             ADR      RM360 (2016)            RevPAR     RM240 (2016)
• RM55 billion East Coast Rail Link
    by 2022                                Occupancy          Occupancy      Kota                               Kota
                                                                                      RM505 (2017F)                      RM355 (2017F)
• RM65 billion High Speed Railway         69% (2017F)        70% (2017F)
                                                                           Kinabalu       vs.                 Kinabalu       vs.
                                              vs.                vs.
    (Singapore – Kuala Lumpur) by                            67% (2016)      ADR      RM485 (2016)            RevPAR     RM325 (2016)
                                          67% (2016)
    2026
                                        As of YTD June 2017, Kuala Lumpur and Kota Kinabalu hotel markets
New Hotel Openings in Kuala             recorded a y-o-y increase in occupancy of approximately 5% and 3%,
Lumpur and Kota Kinabalu                respectively. Kuala Lumpur’s room rates remain competitive, while Kota
2017                                    Kinabalu’s room rates is likely to increase in the near future.
• Hyatt House Kuala Lumpur, 298
   keys                                 Transactions
2018-2020                               Malaysia’s hotel transactions reached
• Luxury: 6 Hotels, 1,138 keys          approximately RM1.4 billion as of YTD
• Upper Upscale: 4 Hotels, 1,199        September 2017. This is possibly due
   keys                                 to positive sentiments on the hotel
• Upscale: 3 Hotels, 1,035 keys         market across the country as tourism
• Upper Midscale: 2 Hotels, 663         recovers from the uncertainty of
   keys                                 Malaysia’s economy in 2015 and
• Midscale: 4 Hotels, 1,149 keys        2016. HVS would expect 2017 to
• Independent: 1 Hotel, 263 keys        surpass 2014’s record high of over
                                        RM1.5 billion worth of hotel
Notable Transactions                    transactions. Over the last five years,
• 91-key Four Seasons Resort            almost half of the transactions have          Source: RCA Analytics
   Langkawi sold for RM384.4 million    been in Kuala Lumpur.
   (RM4.2m/key) in September 2017
                                                                                MARKET SNAPSHOT: ASIA PACIFIC 2017 | PAGE 7
Maldives

Key Points                              Demand
                                        In the first half of 2017, tourist arrivals displayed a positive y-o-y growth
         Tourism directly contributes   despite a slow uptake in January. YTD June 2017 arrivals of 658,000
         40.9% to GDP in 2016           outstripped last year’s arrivals by 6%. China remains a key source market
                                        despite the decline in Chinese visitors by 10% in 2016. We note that recently,
                                        India, USA, and the UK have emerged as fast growing source markets for the
         4.1% Real GDP growth           Maldives.
         expected in 2017
                                        Supply
         1.28 million international                  June 2017               June 2017                     June 2017
         tourist arrivals recorded in                723                     30,105 Beds                   14% y-o-y
         2016                                        Establishments                                        growth
                                        Source: Ministry of Tourism

Highlights                              HVS has noted that, going forward, there will be 16 additional establishments
                                        with approximately 2,300 keys in Maldives by 2020, having 13 resorts opened
Infrastructure Projects                 in the first half of 2017.
• Beijing      Urban     Construction
    Group’s US$800 million upgrade of   Maldives Resort Performance 2016 vs. 2017F
    Velana International Airport with
    new runway by mid-2018
                                                                              US$675 (2017F)                US$410 (2017F)
New Resort Openings in Maldives
2018-2020
                                                                      ADR          vs.
                                                                              US$650 (2016)
                                                                                                RevPAR           vs.
                                                                                                            US$400 (2016)
                                                Occupancy
• Luxury: 5 Resorts, 493 keys                  61% (2017F)
• Upper Upscale: 5 Resorts, 1,000                  vs.
                                               62% (2016)
   keys
• Upscale: 2 Resorts, 422 keys          As of YTD June 2017, Maldives recorded a decline of 0.7% in occupancy and an
                                        increase of 4.7% in ADR y-o-y, with an average occupancy of 63% and an ADR
Notable Transactions                    of almost US$700.
• 108-key Kodhipparu Island Resort
   transacted at US$65 million
   (US$602k/key) in December 2016       Transactions
                                        Investment activity has been declining
                                        since the high period from 2011 to
                                        2013. Over the last five years,
                                        investments in Maldives have mainly
                                        been made by Singaporean investors.
                                        In 2016, four transactions were
                                        recorded in the Maldives, a significant
                                        increase from one transaction in 2015.
                                        Sales prices of those four transactions
                                        indicate that value per key ranges
                                        from approximately US$450,000 to
                                        US$620,000. No sales transaction have
                                        been recorded as of YTD September          Source: RCA Analytics
                                        2017.
                                                                            MARKET SNAPSHOT: ASIA PACIFIC 2017 | PAGE 8
Myanmar

Key Points                               Demand
                                         In 2016, tourist arrivals displayed negative y-o-y growth. 2016 arrivals of 2.9
          Tourism directly contributes   million was significantly lower than 2015’s arrivals by 38%. Neighbouring
          3.0% to GDP in 2016            Thailand is Myanmar’s top source market, making up 19% of total tourist
                                         arrivals, closely followed by China at 14%. We note that recently, China is a
                                         key source market for Myanmar with the number of Chinese visitors growing
          7.2% Real GDP growth           fast at 24% over 2015.
          expected in 2017               Supply

                                                      2016                             2016                      2016
          2.9 million international
          tourist arrivals achieved in                1,432                            56,429                    13% y-o-y
          2016                                        Establishments                   Rooms                     growth
                                         Source: Ministry of Hotels & Tourism

Highlights                               HVS has noted that, going forward, there will be 20 additional hotels with
                                         5,400 keys in Myanmar by 2020, having three hotels opened in the first half of
Infrastructure Projects                  2017.
• Opening of the Hanthawaddy
    International Airport, with an       Yangon Hotel Performance 2016 vs. 2017F
    initial annual capacity of 12
    million, by 2022
                                                                                       US$145 (2017F)             US$70 (2017F)
New Hotel Openings in Yangon
2017
                                                                                ADR         vs.
                                                                                       US$155 (2016)
                                                                                                        RevPAR         vs.
                                                                                                                  US$85 (2016)
                                                 Occupancy
• Pan Pacific Yangon, 348 keys                  50% (2017F)
                                                    vs.
2018-2020                                       54% (2016)
• Luxury: 1 Hotel, 239 keys              Based on our analysis of a few upper upscale and luxury hotels in Yangon,
• Upper Upscale: 4 Hotels, 1,354
                                         we have estimated in 2016 an average occupancy of 54% and an ADR of
   keys
• Upscale: 3 Hotels, 635 keys            US$140. HVS has noted that, going forward, there will be continuous
• Upper Midscale: 2 Hotels, 653          downward pressure on rates, while occupancy will remain competitive.
   keys

Notable Transactions                     Transactions
• 183-key Micasa Hotel Apartments        There is limited information on hotel transactions in Myanmar. According to
   was transacted at US$46million        the Directorate of Investment and Company Administration (DICA), it was
   (US$251k/key) in July 2016            observed that prior to the 2015 presidential elections, investor cautions
                                         discouraged FDI. However in 2016, after the elections, investor interest
                                         returned and a total of US$403.7 million was approved April 2016 to March
                                         2017. From April 2017 to September 2017, a total of US$154.4 million has
                                         been approved, but not expected to surpass previous period’s numbers due
                                         to the political instability in the country. According to the Ministry of Hotels
                                         and Tourism, Singapore is leading the way as one of the biggest investors for
                                         Myanmar’s hotels and commercial complexes with approximately US$1.8
                                         billion invested into 26 hotels, an 18% increase from 2015.

                                                                                      MARKET SNAPSHOT: ASIA PACIFIC 2017 | PAGE 9
New Zealand
Key Points Demand
In the first half of 2017, tourist arrivals amount to approximately 1.9 million
surpassing last year’s arrivals by 9%. Given its close proximity, tourists from
Tourism directly contributes
5.2% to GDP in 2016 Australia make up about 40% of total arrivals to New Zealand. Visitation of
tourists from the USA and the UK have seen healthy y-o-y growths with an
increase in their share in total tourist arrivals. Growing Asian source markets
2.8% Real GDP growth to New Zealand are Malaysia, India, Hong Kong, and Indonesia.
expected in 2017
Auckland Airport continues to receive the majority of tourist arrivals into New
Zealand. However, as reported by Stats NZ and Tourism New Zealand, arrivals
3.5 million international via seaports have increased by 18% as of YTD June 2017.
tourist arrivals recorded in
2016 Supply
2016 2016 2016
Highlights 3,089 138,593 2% y-o-y
Establishments Rooms decline
Infrastructure Projects
Source: Stats NZ and Tourism New Zealand
• NZ$32 million expansion of Nelson
Airport HVS has noted that, going forward, there will be around 25 additional
establishments with approximately 3,500 keys by 2020. HVS expects that the
• NZ$102 million Tourism
number of tourists will surpass the number of hotel beds available.
Infrastructure Fund set up by the
government with additional NZ$76
million to upgrade tourism Auckland Hotel Performance 2016 vs. 2017F
infrastructure
New Hotel Openings in Auckland NZ$175 (2017F) NZ$135 (2017F)
2018-2020 ADR vs.
NZ$155 (2016)
RevPAR vs.
NZ$115 (2016)
• Luxury: 3 Hotels, 624 keys Occupancy
• Upper Upscale: 1 Hotel, 300 keys 77% (2017F)
vs.
• Upscale: 1 Hotel, 250 keys 75% (2016)
• Midscale: 1 Hotel, 120 keys
• Independent: 1 Hotel, 250 keys As of YTD June 2017, Auckland recorded a decline of 1.9% in occupancy and
an increase of 18% in ADR y-o-y, with an average occupancy of 76.7% and an
Notable Transactions ADR of almost NZ$180.
• 111-key Mercure Wellington Hotel
sold for NZ$11.5 million Transactions
(NZ$103k/key) in November 2016 2015 and 2016 have been active years
• 155-key Ibis Christchurch and 154 for hotel transactions in New Zealand
Novotel Christchurch Cathedral as more investors are recognising the
Square for NZ$12 million country’s surge in tourism demand. In
(NZ$77k/key) and NZ$19 million 2017, HVS notes that transaction
(NZ$123k/key), respectively in activity has slowed down as compared
November 2016 as part of the Host to the previous year. This is possibly
Hotel Sale due to hotel owners holding onto
• 90-key Double Tree by Hilton Hotel
assets in expectation that the strong
Queenstown sold for NZ$52.2
tourism market will continue.
million (NZ$532k/key) in
Source: RCA Analytics
February 2016
MARKET SNAPSHOT: ASIA PACIFIC 2017 | PAGE 10Philippines
Key Points Demand
In the first half of 2017, tourist arrivals displayed positive y-o-y growth. YTD
Tourism directly contributes June 2017 arrivals of 3.4 million surpassed last year’s arrivals by 13%. South
8.2% to GDP in 2016 Koreans continue to be the top source market and Taiwanese visitors have
highest per capita expenditure of approximately ₱116,450. Chinese tourist
arrivals have recorded the most significant growth of about 33% as of YTD
6.5% Real GDP growth June 2017. Domestic travellers contribute significantly to the country’s
expected in 2017 tourism and they make up over 80% of total tourists in the Philippines. The
Department of Tourism of the Philippines highlights that there were four
domestic travellers to every one international traveller in 2015.
5.97 million international
tourist arrivals achieved in Supply
2016
2016 2016 2016
160 61,500 6% y-o-y
Highlights Establishments Rooms growth
Source: HVs Research
Infrastructure Projects
• The nation’s biggest infrastructure HVS has noted that, going forward, there will be 49 additional hotels of
plan: ₱355.6 billion Metro Manila approximately 13,600 keys in Manila by 2020.
Subway Project, backed by Japan,
to begin construction in 2018 Manila Hotel Performance 2016 vs. 2017F
• Total of 35 infrastructure projects
worth ₱1.2 trillion approved
₱5,115 (2017F) ₱3,425 (2017F)
New Hotel Openings in Manila ADR vs. RevPAR vs.
2017 Occupancy ₱5,300 (2016) ₱3,580 (2016)
• Red Planet Hotel Manila Bay, 150 67% (2017F)
vs.
keys 68% (2016)
• Red Planet Hotel Binondo Manila,
171 keys As of YTD June 2017, Manila recorded an increase of 0.5% in occupancy and an
increase of 1.6% in ADR y-o-y, with an average occupancy of 70% and an ADR
2018-2020 of ₱5,345.
• Luxury: 1 Hotel, 170 keys
• Upper Upscale: 4 Hotels, 1,370 Transactions
keys 2014 had one major transaction
• Upscale: 1 Hotel, 310 keys
which was the sale of the 674-key
• Upper Midscale: 2 Hotels, 1,488
Shangri-La at the Fort. As of YTD
keys
June 2017, we noted that only the
• Midscale: 1 Hotel, 320 keys
• Economy: 2 Hotels, 535 keys Hotel 101 Manila was transacted in
• Independent: 1 Hotel, 325 keys March 2017, with an undisclosed
price. Over the last five years, it has
been seen that the price per hotel
key has ranged widely, from ₱3.4
million to ₱13.4 million. All
transactions recorded were made by Source: RCA Analytics
local real estate operating companies
such as Ayala Land, Shang Properties
Inc, etc.
MARKET SNAPSHOT: ASIA PACIFIC 2017 | PAGE 11Singapore
Key Points Demand
In the first half of 2017, tourist arrivals recorded positive y-o-y growth. YTD
Tourism directly contributes June 2017 arrivals of 8.5 million surpassed last year’s arrivals by 5%. China
4.3% to GDP in 2016 continues to be the top source market, making up 18% of total tourist arrivals,
with Indonesia a close second at 17%. A tourism campaign, “Passion made
Possible”, has been launched to specifically target second tier cities in Asia,
2.9% Real GDP growth long-haul destinations in Europe and United States.
expected in 2017
Supply
16.4 million international
tourist arrivals recorded in 2016 2016 2016
2016 413 Hotels 63,850 rooms 5% y-o-y
growth
Source: Singapore Tourism Board
Highlights HVS has noted that, going forward, there will be 15 additional hotels with
4,000 keys in Singapore by 2020, having three hotels opened in the first half of
Infrastructure Projects 2017.
• Inauguration of Changi Airport
Terminal 4 in October 2017
• Expansion of Terminal 1 (Project Singapore Hotel Performance 2016 vs. 2017F
Jewel) by 2018
• Addition of Changi Airport
Terminal 5 by 2020 S$270 (2017F) S$220 (2017F)
• Completion of Singapore – KL ADR vs.
S$280 (2016)
RevPAR vs.
S$230 (2016)
High-Speed Rail Link by 2026 Occupancy
80.6% (2017F)
vs.
New Hotel Openings in Singapore 81.0% (2016)
2017
As of YTD June 2017, Singapore recorded an increase of 1.2% in occupancy
• InterContinental Singapore
Robertson Quay, 225 keys and a decrease of 1.1% in ADR y-o-y, with an average occupancy of 85% and
• Courtyard Singapore Novena, 250 an ADR of almost S$230.
keys
• Yotel Singapore, 305 out of 610
keys Transactions
• Andaz Singapore, 342 keys Volume of investment activity has
• Novotel Singapore On Stevens and been declining since the high period
Mercure Singapore On Stevens, in 2013. While no transactions were
772 keys recorded in 2016, transaction
2018-2020 volume has picked up in 2017,
• Luxury: 2 Hotels, 378 keys hinting at a sense of market
• Upper Upscale: 1 Hotel, 200 keys recovery. Since June 2017, five hotels
• Upper Midscale: 1 Hotel, 130 keys were transacted within the short
• Independent: 3 Hotels, 996 keys span of three months. Singapore’s
hotel investment market has been
Notable Transactions dominated by local investors.
• 79-key Naumi Loria Hotel sold for
S$75.5 million (S$955k/key) in Source: RCA Analytics
June 2017
MARKET SNAPSHOT: ASIA PACIFIC 2017 | PAGE 12South Korea
Key Points Demand
In the first half of 2017, tourist arrivals dropped by 17% largely due to a
Tourism directly contributes decline in Chinese tourist arrivals from a dispute over the THAAD missile
5.0% to GDP in 2016 system. Despite a decrease of 41% as of YTD June 2017, China remains the
largest source market for South Korea, with twice as many arrivals than
neighbouring Japan, the second largest source market. With the exception of
the Chinese, tourist arrivals from the remaining top five source markets have
2.9% Real GDP growth
displayed positive y-o-y growth.
expected in 2017
Supply
17.2 million international
tourist arrivals recorded in 2016 2016 2016
2016 1,523 129,916 10% y-o-y
Establishments Rooms growth
Source: Ministry of Culture, Sports, and Tourism
Highlights
HVS has noted that, going forward, there will be 40 additional hotels with
Infrastructure Projects approximately 13,300 keys in South Korea by 2020, having 10 hotels opened
• Incheon International Airport’s in the first half of 2017.
Terminal 2 to open in January
2018, in time for the PyeongChang Seoul Hotel Performance 2016 vs. 2017F
2018 Olympic Winter Games in
February
₩170,000 (2017F) ₩117,000 (2017F)
New Hotel Openings in Seoul
2018 – 2020 ADR vs.
₩ 180,000 (2016)
RevPAR vs.
₩135,000 (2016)
Occupancy
• Luxury: 2 Hotels, 576 keys 68% (2017F)
• Upper Upscale: 3 Hotels, 1,066 vs.
keys 75% (2016)
• Upscale: 7 Hotels, 1,959 keys As of YTD June 2017, Seoul recorded an average occupancy of 67.9% and an
• Upper Midscale: 1 Hotel, 553 keys ADR of ₩164,000, a y-o-y decline of 4.4% and 5.6%, respectively.
• Economy: 1 Hotel, 121 keys
• Independent: 1 Hotel, 176 keys
Transactions
Notable Transactions Since 2015, investment activity
• 434-key Conrad Seoul was has gained momentum in South
transacted at ₩124.6 billion Korea. Hotel transaction volume
(₩287m/key) in November 2016 reached their highest-ever figure
of approximately ₩1.2 trillion in
2016, as a result of the 493-key
Belle-Essence Hotel being sold
for approximately ₩683.1 billion
(₩1.4 bn/key) in May 2016.
Although 2016 was an outlier,
hotel transaction volume as of Source: RCA Analytics
YTD September 2017 reached
₩498.0 billion, which is higher
than the volumes of each year
between 2012 and 2015.
MARKET SNAPSHOT: ASIA PACIFIC 2017 | PAGE 13Thailand
Key Points Demand
YTD June 2017 arrivals of 17.3 million outstripped last year’s arrivals by 4%.
Tourism directly contributes
China remains the number one source market for Thailand despite a slight
9.2% to GDP in 2016 decline of 4% in tourist arrivals in the first half of 2017. Russia, the sixth
biggest source market for Thailand, has seen a 30% growth y-o-y. Thailand’s
domestic tourism is much stronger in comparison to its international arrivals.
3.3% Real GDP growth In the first half of 2017, 99.6 million domestic travellers were recorded, which
expected in 2017 was almost six times more than the number of international tourists.
Supply
32.59 million international
tourist arrivals recorded in June 2017 June 2016 2016
2016 1,280 191,400 5.8% y-o-y
Establishments Rooms growth
Source: HVS Research
Highlights
HVS has noted that, going forward, there will be 95 additional hotels with
Infrastructure Projects approximately 21,100 keys by 2020.
• 36 infrastructure projects worth
895.8฿ billion in the pipeline
including Thai-Chinese high-speed Bangkok and Phuket Hotel Performance 2016 vs. 2017F
train project and Bangkok-Rayong Bangkok Phuket
high-speed train project Bangkok 3,420฿ (2017F) Bangkok
2,670฿ (2017F)
vs. vs.
ADR RevPAR 2,595฿ (2016)
3,355฿ (2016)
New Hotel Openings in Bangkok and
Phuket Occupancy Occupancy
3,730฿ (2017F) 2,935฿ (2017F)
2017 78% (2017F) 79% (2017F) Phuket Phuket
vs. vs.
vs. vs. ADR RevPAR
• SAVANT Vela Hotel Bangkok, 72 77% (2016) 76% (2016) 3,805฿ (2016) 2,900฿ (2016)
keys
• Rosewood Phuket, 87 keys While Bangkok recorded a drop of 1.1% in occupancy as of YTD June 2017,
• Hyatt Place Bangkok Sukhumvit, Phuket’s occupancy increased by 0.2% over the same period. Phuket’s room
222 keys rates remain competitive, while Bangkok has seen slightly higher average
• The Lancaster Bangkok, 231 keys rates with strong tourism demand.
2018-2020
• Luxury: 4 Hotels, 833 keys Transactions
• Upper Upscale: 11 Hotels, 2,660 With four transactions recorded as of
keys YTD June 2017, investment activity
• Upscale: 6 Hotels, 1,809 keys in Thailand has slowed slightly from
• Upper Midscale: 6 Hotels, 1,184 nine transactions recorded in 2016.
keys Sales prices of those four
• Midscale: 7 Hotels, 1,570 keys transactions indicate that value per
• Economy: 1 Hotel, 162 keys key ranges from approximately 2.7฿
• Independent: 3 Hotels, 507 keys million to 40.4฿ million. Over the last
five years, Thai investors have
Notable Transactions recorded the highest hotel
• 325-key Swissotel Nai Lert Park in transaction volume of 47%, followed
Bangkok was sold at 4.1 ฿ billion by Singaporean investors.
(12.5 ฿ m/key) in February 2017 Source: RCA Analytics
MARKET SNAPSHOT: ASIA PACIFIC 2017 | PAGE 14Vietnam
Key Points Demand
In the first half of 2017, tourist arrivals displayed robust y-o-y growth. YTD
June 2017 arrivals of 6.2 million outstripped last year’s arrivals by an
Tourism directly contributes
4.6% to GDP in 2016 astonishing 32%. China is Vietnam’s number one source market, accounting
for 30% of total international tourist arrivals. Although South Korea is a far
second at 17%, there has been a surge of South Korean tourists in 2017.
6.3% Real GDP growth
expected in 2017 Supply
2016 2016 2016
10 million international 629 68,118 12% y-o-y
tourist arrivals recorded in Establishments Rooms growth
2016 Source: HVS Research
HVS has noted that, going forward, there will be 80 additional hotels with
Highlights approximately 23,500 keys by 2020, having three hotels opened in the first
half of 2017.
Infrastructure Projects
• Opening of Metro Line 1 of HCMC, Hanoi and Ho Chi Minh City (HCMC) Hotel Performance 2016 vs.
the city’s first and biggest 2017F
transportation project, by 2020 Hanoi HCMC
• Opening of Metro Lines 2 and 2A of Hanoi 2,530,000₫ (2017F) Hanoi 2,190,000₫ (2017F)
Hanoi by 2018 and 2023 ADR vs. vs.
RevPAR 1,880,000₫ (2016)
2,370,000₫ (2016)
respectively
• Opening of Van Don International Occupancy Occupancy
1,960,000₫ (2017F)
Airport by 2018 87% (2017F) 76% (2017F) HCMC 2,590,000₫ (2017F) HCMC
vs. vs.
vs. vs. ADR RevPAR 1,810,000₫ (2016)
79% (2016) 71% (2016) 2,560,000₫ (2016)
New Hotel Openings in Hanoi and
HCMC As of YTD June 2017, the Hanoi and HCMC hotel markets recorded a y-o-y
2018-2020 increase in occupancy of 8.5% and 4.8%, respectively. Hanoi’s room rates have
• Luxury: 3 Hotels, 791 keys been boosted by the surge in tourist arrivals, while less growth is observed for
• Upper Upscale: 6 Hotels, 1,582 HCMC’s room rates.
keys
• Upscale: 3 Hotels, 970 keys
• Upper Midscale: 5 Hotels, 1,263 Transactions
keys It was observed that the majority of
• Independent: 2 Hotels, 544 keys recorded transactions in the last
five years have been in HCMC, with
Notable Transactions the 305-key InterContinental Asiana
• Partial interest (50%) of the 365- Saigon, transacted at ₫1.7 trillion
key Sofitel Legend Metropole Hanoi (₫5.5 bn/key), being the most
Hotel was transacted at recent transaction in HCMC. As of
approximately ₫2.3 trillion (₫6.2 2017, Vietnamese investors are the
bn/key) in December 2016 most active in the market,
accounting for approximately 45%
of the total hotel transactions. No
sales transaction has been recorded
as of YTD September 2017. Source: RCA Analytics
MARKET SNAPSHOT: ASIA PACIFIC 2017 | PAGE 15About HVS About the Authors
HVS, the world’s leading consulting and services organization Jeremy Teo is an Analyst with HVS
Singapore. He has recently graduated
focused on the hotel, mixed-use, shared ownership, gaming,
with a Bachelor of Science degree in Real
and leisure industries, celebrated its 35th anniversary in Estate from National University of
2015. Established in 1980, the company performs 4,500+ Singapore. Since joining, he has assisted
assignments each year for hotel and real estate owners, in numerous valuation and feasibility
assignments across regional markets that
operators, and developers worldwide. HVS principals are
include Malaysia, Indonesia, Vietnam,
regarded as the leading experts in their respective regions of Papua New Guinea, Japan and Singapore. jteo@hvs.com
the globe. Through a network of more than 40 offices and
Kyu Baek Kim is an Analyst with HVS
more than 350 professionals, HVS provides an unparalleled
Singapore. He has recently graduated
range of complementary services for the hospitality industry. with a Master of Science degree in Global
HVS.com Hospitality Business from École hôtelière
de Lausanne. Since joining, he has
assisted in numerous valuation and
Superior Results through Unrivalled Hospitality feasibility assignments across regional
Intelligence. Everywhere. markets that include Malaysia, Indonesia
and Singapore. kbkim@hvs.com
HVS ASIA PACIFIC is represented by eight offices in Victoria Chan is a Senior Analyst with
Singapore, Bangkok, Beijing, Hong Kong, Mumbai, New Delhi, HVS Singapore. She graduated with a
Bachelor of Science degree in
Shanghai and Shenzhen. HVS also hosts four of the main
International Hospitality Management
annual industry events in the region, namely the China Hotel from École hôtelière de Lausanne. She has
Investment Conference (CHIC), Hotel Investment Conference covered a wide variety of assignments
- South Asia (HICSA), Tourism, Hotel Investment & across regional markets that include
Australia, Cambodia, Indonesia, Malaysia,
Networking Conference (THINC) Indonesia and THINC Sri
Maldives, New Zealand, Papua New Guinea, Thailand,
Lanka. Additionally, HVS publishes a wide range of leading South Korea and Singapore. vchan@hvs.com
research reports, articles and surveys, which can be
Hok Yean Chee is the Managing Partner
downloaded from our online library (HVS.com/Library). of HVS Singapore. She has 30 years of
experience in more than 30 markets
HVS SINGAPORE has worked on a broad array of projects across 19 countries in Asia Pacific,
that include economic studies, valuations, feasibility studies, providing real estate investment advisory
services for a wide spectrum of property
operator search and management contract negotiation, assets. Her forte lies in providing
development strategies for new brands, asset management, investment advisory on hotels and
research reports and investment advisory for hotels, resorts, serviced apartments including brokerage, strategic
serviced residences and branded residential development analyses, operator search, market feasibility studies,
valuations and litigation support. hychee@hvs.com
projects.
The article was edited by Deepika Thadani.
HVS.com HVS Singapore | 137 Market Street, #04-02 Grace Global Raffles, Singapore 048943You can also read