The Benjamins Furqan Asad Suhail;Bader Buhamad;Swati Tehlan - Economist Case Study Competition 2016
←
→
Page content transcription
If your browser does not render page correctly, please read the page content below
Walmart vs Amazon: Which Stock Would You Choose to Invest in if You Couldn’t Sell it
                              for a Decade, and Why?

                    Economist Case Study Competition 2016

                       Real Vision Investment Case Study

           Furqan Asad Suhail;Bader Buhamad;Swati Tehlan
                          The Benjamins
Table of Contents

1. Abstract ....................................................................................................................................... 2

2. Investment Thesis ....................................................................................................................... 3

3. Walmart Has Strong Cash Generating Ability, Which Makes the Difference ........................... 4

4. Amazon Show Me Earnings and Cash Flow! ............................................................................. 8

5. Valuation and Conclusion ......................................................................................................... 15

6. Appendix ................................................................................................................................... 22

References ..................................................................................................................................... 24

                                                                                                                                                   1
1. Abstract
Our analysis confirms that Walmart’s long-term potential based on its past and foreseeable future
performance outweighs Amazon’s glamor and hopes of future profits. We contend that
Walmart’s greatest strength, which has also allowed it to expand to its current scale, is it strong
cash flow generating ability. We can easily milk Walmart for cash and tilts the balance in
Walmart’s favor. This edge over Amazon would allow Walmart to generate superior returns for
investors as it engages in generous share buybacks and steady dividends. While Amazon is a
glamorous revenue growth story, we believe that the market has been too lenient and it’s about
time the online retail starts translating those startling topline figures into reassuring bottom line
numbers. While Amazon continues to bleed cash to fund its outreach into various businesses,
Walmart can leverage its existing position and deep pockets to weather the storms ahead. Current
valuations price in phenomenal growth rates for Amazon and gloom for Walmart, creating
opportunities for the rational investor.
22. Investment thesis
We would invest in Walmart, as opposed to Amazon, if we could not sell it for a decade, and that
is because Walmart generates strong cash flows, and only cash has real value. Based on our cash
flow projections and present valuation calculation, Walmart is an attractive stock, whereas,
Amazon is overvalued. Walmart may not grow at impressive rates in comparison to Amazon, but
Walmart has ability and will distribute cash to its shareholders, in form of dividends and share
buyback, that will make the difference – milking Walmart for cash. Walmart is not another Sears
in making because there is difference in business models of Walmart and Sears; Sears was more
focused clothing (fashion), as compared to Walmart which is a consumer staples company with a
more diverse product portfolio. Also, Walmart offers a yield of 3.4% and Amazon pays no
dividends, which makes a difference. And Walmart is making aggressive share buybacks which
will support EPS growth in the future; the company recently announced a new share buyback
plan of $20 billion for the next two years. Also, in the future, the company can push more for
productivity improvement, which will result in cost savings, margin expansion and cash flow
growth. Real money in the next ten years will be made even Walmart grow slow; we have
projected perpetuity (long-term) growth rate of 1% for Walmart.
On the other side, Amazon has robust revenue growth, but the problem is the company is not
able to translate revenue growth into earnings and healthy cash flows, which are more important
for shareholders. Amazon is making large capital expenditures to grow its business, but the
problem is that there are other companies like Google, Apple and Microsoft with deep pockets,
which could enter the online-retail and cloud market, creating more competition, which will limit
profit margin expansion and keep earnings growth weak. That could be ‘Dream Over’ for
3Amazon. As Amazon will fail to deliver investors’ earnings and cash flows expectation,
shareholders will put pressure on the company’s management to distribute more cash, which will
mean Amazon will have to reduce its capital expenditures, and its revenue growth will slow
down and it will lose its appeal for customers and its ability to remain ahead of its competitors.
3. Walmart Has Strong Cash Generating Ability, Which Makes the Difference
With topline figures larger than most economies and weekly customer visits equaling Brazil’s
population, grasping Walmart’s true potential as an investment requires a little more ingenuity
than back of the envelop valuations based on quarterly earnings. Lately, Walmart has fallen out
of Wall Street’s and investors good books. Both groups have begun to doubt the growth potential
and see the behemoth struggling under pressures ranging from macroeconomic to structural.
Does short-term weakness considerably alter Walmart’s long-term story and is the market
overreacting?
Indeed, as investors offloaded Walmart shares after its profit warning in October 2015 and its
share price fell by some 10% on the day, CEO Carl Douglas remarked that the targeted dollar
sales growth of $45 to $60 billion over the next three years equals last year’s combined revenues
of Netflix, Ebay, Starbucks, and Whole Foods. Expansion on such a scale in a competitive
environment is no mean feat. Encouraged by the size of Walmart’s economic prowess, Walmart
has increased dividends for the past 41 years with compound annual growth rate of 12.3% just
over the last decade. (ICRA Online, 2015) Compare this with Amazon’s zero dividends over its
history of some years. And therein probably lies Walmart’s greatest strength and advantage over
Amazon: cash generation. Of course we can build a nice growth story for Amazon and possible
avenues for it to expand still further, but for investors we would prefer visibility over dreams.
4Amazon has generated breathtaking revenue growth rates, yet meaningful profitability remains
elusive. The online retailer has managed to churn out likeable products and services and ventured
into other businesses such as cloud data but the bottom line has remained stubbornly south
bound. Yet, the assumptions on which investors have placed their bets are worth noting. Like
most growth stories, the investment horizon is very-long-term, bordering on blurriness. Amazon
generates revenues by offering its services and products at extremely cheap rates, below costs
even, eventually hoping to ingratiate themselves in the lives of its consumers to a point where
departure from its offering will be impossible. Ecosystem is the buzzword here and companies
that have successfully nurtured this way of life, such as Apple, demand premium valuations. But
Apple sells its iPads at massive margins while Amazon sells its tablet Kindle at a loss or at cost
at best depending on which source you believe – Amazon doesn’t disclose its internal cost
structure. (Reuters, 2012) So the belief is that with revenues continuing to soar, bottom line will
eventually head north.
Now let’s turn our attention back to Walmart. The company’s EPS growth rate over the last 5
fiscal years is 5.87%. As the company invests in its employees and raises their wages, profit
forecasts have however been trimmed somewhat. However, this is not at all gloom and doom for
the giant. These are necessary pains on the path of transformation as Walmart adjusts to a
changing industry. The Street has been unforgiving and as mentioned earlier, Walmart’s stock
has suffered lately. But, as is often the case, overreaction by the Street creates attractive
opportunities for many investors. It has implemented generous stock repurchase programs and
has steadily paid dividends for a very long time. The confidence in paying out dividends stems
from its strong cash generating abilities. Its cash conversion cycle, the time Walmart takes to
convert its investment in inventory into cash, is the lowest in the industry, just 13 days.
5Furthermore, it has a relatively low payout ratio of ~40%, leaving much room for further
expansion.
But Walmart must change and given its size, the change would not be easy. Instead of pushing
products to customers, online retailing thrives and survives by pulling customers towards their
products. Online retailing is placing the power in the hands of consumers as the internet
increases transparency and availability of services. This translates into heightened competition
amongst the retailers and shrunken margins. Consumers have always loved value but now they
also desire convenience. In response to the changing tastes, Walmart has been cutting back on its
traditional supercenter model and expansions through such similar modes is minimal. Instead, it
is investing is smaller stores such as Walmart Express and looks towards increasing the share of
e-commerce. And the company’s attempts to grow its e-commerce sales are paying off, as e-
commerce sales for Walmart increased by 22% in fiscal year 2015. (Mark Brohan, 2015)
Walmart has tried to mold itself to better serve the gradually changing consumer trends with
tools such as popular mobile apps with attractive features of the like of Savings Catcher (it is
now the third most popular retailer app behind only Amazon and Ebay). (Forbes, 2015)
This leads us to the most important consideration in our discussion about e-commerce. Probably
the most important battle for the top spot in the online retailing space is being fought in the
sphere of convenience. For example, Amazon can ship items free of cost (for an annual fee of
$99), Walmart would charge $25.90 on a $33.78 shirt for delivery between 2-6 days. Can
Walmart keep impatient online shoppers satisfied? Walmart has one potent option under its
sleeve to counter Amazon’s low cost superior convenience. Walmart’s brick and mortar network
allows it enviable geographic reach. This efficient distribution network of stores can be used to
6compliment and streamline its online retailing business. Having said that, its revenue figures do
not spell doom.
So what Walmart has to offer is not just dreams, but real tangible returns for its investors. This
analysis is based not on the future only but by carefully extrapolating past performance into the
foreseeable future. It’s moto of “everyday low prices” has served it well over the past and we
have yet to see potent forces that threaten Walmart’s long-term profitability under “serious”
pressure. In the choice between Walmart and Amazon the question boils down to visibility and
dreams. While Walmart would surely face problems in expanding its online footprint, can
Amazon one day erase the red on its books?
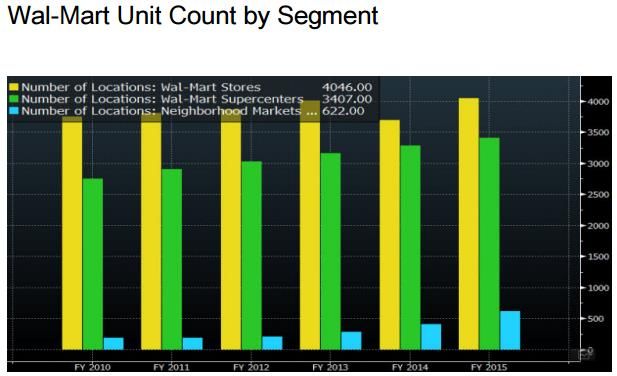
Walmart’s strategy to expand its small format stores is correct and will help it to better reach its
customers and address competition. To gain market share, the company has been working
consistently to expand its 42,000 square foot Neighborhood market stores, in comparison to
175,000 square feet supercenters.
7Source: Bloomberg
Dividends Make Walmart’s Stock Attractive
Walmart offers a dividend yield of 3.4%, in comparison to no dividends offered by Amazon.
Walmart’s dividend yield should limit downside to the stock price, which remains a key
attraction for investors. In the retail industry, historically, companies like Target Corp. and other
big retail companies which offer significant dividend yields have experienced support in their
stock price once yield touches the 3% mark.
4. Amazon – Show Me Earnings and Cash Flows
Amazon has done a great job in the past years to grow its revenues and customer base, but the
key concern stays will the company be able to translate revenue growth into earnings growth?
Amazon has been making hefty investments that explain its very thin profit margins. The
8company’s management has a very clear policy of developing and expanding the business further
rather than increasing shareholders wealth. The company can translate revenue growth into
profits but for that it needs to reduce its investments. And we think the company does not have
many options to reduce its investments as its competitive position in industry will be challenged
by large companies like Google, AliBaba, and Mircosoft, if it lowers its investments.
The company will continue to grow its revenue and customer base, with its focus on customer
satisfaction, but its earnings growth will remain weak, mainly due to its low retail business
margins and growth investments. The following chart highlights the key concern for the
company, that is, revenue growth without earnings growth.
Source: gurufocus.com (Guru Focus, A, 2015)
9In 2014, the company’s retail segment contributed 93% to the company’s total revenues, but only
earned operating margin of 0.9%.This which has been the reason for the weak bottom-line
numbers. The following charts show revenues and operating margin for three segments of
Amazon.
90,000
80,000
70,000
60,000
50,000
Segment Revenues (in
40,000 $million)
30,000
20,000
10,000
0
Retail AWS Others
45.00%
40.00%
35.00%
30.00%
25.00%
Segment Operating
20.00% Margin %
15.00%
10.00%
5.00%
0.00%
Retail AWS Others
Source: Annual Report 2014 (Amazon, 2015)
10Amazon is a brilliant construction, which entices everyone, but the problem is the company is
not making money. And in the future, profit margins for the company will continue to stay weak
as competition in industry has been increasing. Amazon faces competition not only from
traditional retailers like Walmart and Target, but also from Google, Apple, FlipKart, Alibaba and
others.
Amazon is growing, so will others – Dream over for Amazon!
Amazon has been making strides to develop and expand its AWS business and making huge
growth investment into the segment. AWS experienced growth in revenue and margins after it
announced significant price cuts in 2Q2014. Also, the company is optimistic that AWS segment
will help the company to expand its profit margin. We agree that AWS will continue to grow in
the future but its profit margins will be challenged by increase in competition. Also, increasing
fulfillment and technology & content spending will limit the company’s profit margin expansion.
Technology and Content Costs as % of Revenues
14.00%
12.00%
10.00%
8.00%
6.00%
4.00%
2.00%
0.00%
Source: Company’s Reports (Yahoo Finnace, A, 2015)
AWS is a sizeable and growing business, which requires huge capital expenditures. But the long-
11term profitability of AWS has yet to be proven. Amazon has first mover advantage in AWS, but
in the future its AWS business segment will remain exposed to competition from Rackspace,
Microsoft and Google, with Microsoft and Google both having larger research and development
budgets and deeper pockets.
The following table shows the cash flows strength of competitors in comparison to Amazon.
Microsoft Apple Google Amazon
Free Cash flows 20% 25% 15% 2%
as % of total
revenues
Source: Yahoo Finance (Yahoo Finance, B, 2015)
Amazon has been making large capital expenditures into its AWS business segment to keep its
strong position in the market. Amazon made significant AWS capital expenditure of $2,215
million and $4,295 million in 2013 and 2014, respectively. As the competition in the AWS
market will increase, Amazon’s AWS revenue growth and profit margin will weaken, which will
weigh on the company’s consolidated margins and earnings growth, due to large AWS
depreciation expense. The following table shows AWS actual depreciation expense for 2013 and
2014, and for 2015 and 2016, based on estimates.
122014 2015* 2016*
AWS 1,673 2,500 3,800
Depreciation
Expense ($-
millions)
Depreciation as 36% 36% 35%
% of AWS
revenues
Source: Company Financial Reports (Yahoo Finnace, C, 2015)
According to some market reports Amazon plans to launch its own shipping network, in efforts
to cut its costs by depending less on 3rd party shippers like FedEx and UPS. This will help the
company to lower its shipping costs, as shipping costs for Amazon have been increasing;
shipping costs as % of total revenues increased from 8.3% in 2011 to 9.8% in 2014. However,
we think, this will limit the company’s earnings growth as large growth investments will be
made in this direction. Therefore, the problem of low earnings growth despite large revenue
growth will persist, and cash flows for the company will stay weak.
The following graph shows gross and adjusted EBITDA margin trend for Amazon’s until 2025
(figures from 2015 through 2025 are based on estimates).
1340.00%
35.00%
30.00%
25.00% Amazon's Gross Margin
20.00%
15.00%
Amazon's Adjusted EBITDA
10.00%
Margin
5.00%
0.00%
Source: Reports and Estimates (Yahoo Finnace, D, 2015)
Only Cash Has Real Value – But Amazon doesn’t have Cash!
We think the initiatives the company has been taking in the recent times will help it to expand
the business size and grow revenues, but the revenue growth will not be translated into earnings
growth and its cash flows will remain weak.
And, in the coming years, if the company fails to translate its revenue growth into earnings and
cash flow growth, its valuation will contract. Amazon’s investors, which in the past has been
tolerating low-margin businesses and high capital expenditures, will put pressure on the
company management’s to distribute more cash in form of dividends and share buybacks, which
will result in slower revenue growth and the company will lose customer appeal and competitive
advantage.
Also, the real value of the company can be measured by cash it generates for its shareholders.
Amazon operating cash flows has been increasing in the recent years, but its free cash flows
which are more important to both, shareholders and the stock price, do not display a healthy
picture.
14Source: gurufocus.com (Guru Focus, B, 2015)
5. Valuation and Conclusion
Our team calculated fair value of Walmart and Amazon, using discounted cash flow valuation
model.
Walmart
We calculated Walmart stock’s fair value of $62.79, in comparison with the current market stock
price of $57. Based on the fair value calculation of $62.79, the stock offers a potential upside of
almost 10%, and a total return of 13.5%, including dividend yield of 3.45%. Also, Walmart has a
compelling forward P/E of 13.91x, (Yahoo Finance, F, 2015) as compared to Target’s forward
P/E of 14.73x. (Yahoo Finance, G, 2015) As valuation for Walmart stays attractive, we will buy
the stock. We used assumptions, based on our analysis regarding revenues, margins and capital
expenditures.
15US $ 2015 2016 2017 2018 2019
Million -
Walmart
Total
Revenues 485,651 502,125 518,568 535,698 553,085
Unlevered
Free Cash 12,070 15,310 16,300 16,816 17,013
Flow
16Walmart
Perpetuity Value at the end of 2019 ($mm) 261,738
WACC 7.5%
Perpetuity Growth Rate 1%
PV of Total Unlevered Cash Flows ($mm) 54,622
PV of Perpetuity ($mm) 195,985
Total Enterprise Value ($mm) 250,607
Less Total Debt ($mm) 49,690
Total Value of Equity ($mm) 200,917
Shares Outstanding (mm) 3,200
17Fair Value Per Share $62.79
Potential Upside 10%
Amazon
For Amazon’s revenues and margins estimates, we used assumptions, based on our industry and
company analysis. Revenue figures for Amazon from 2011 through 2014 are based on actual
reported numbers. Revenues from 2015 through 2018, are taken from Thompson Reuters Eikon,
which reflects average analysts’ estimates. And revenues from 2019 through 2025, are projected
by our team, which reflects revenue growth for the company will slow, based on our analysis that
competition in the industry will increase. Our projections for margins are supported by analysis
above. We believe, Amazon will be able to expand its margins in the near-term, mainly driven
by high AWS business; however, in the long-term, margins for Amazon will contract because of
competition, as other companies, like Google, Apple and others, will make market more
competitive for Amazon.
According to our estimates, Amazon stock is mispriced, and stock valuations are too high. The
market has priced in high growth estimates, and if the company fails to meet market growth
estimates, its stock valuation will contract. We calculated fair value of $359 for an Amazon
stock, in comparison to current market price of $635. Based on our fair value estimate of $359,
the stock has a potential stock price downside of 43.5%. The stock is trading at an expensive
forward P/E of almost 340x (based on 2015 EPS estimate), reflecting market’s high growth
18expectation. (Yahoo Finance, E, 2015) We think, the stock does not warrant such a high forward
P/E multiple, as its margins and earnings growth will be challenged in the long-term; hence, the
stock valuation will contract.
US $ 2016 2017 2018 2019 2020 2021 2022 2023 2024 2025
Million -
Amazon
Revenue
129,602 154,840 178,884 203,928 231,050 254,155 273,217 286,878 295,484 304,348
Unlevered
Free Cash 9,269 14,753 21,093 23,178 24,019 23,991 23,529 23,372 21,965 22,416
Flow
19Amazon
Perpetuity Value at the end of 2025 ($mm) 235,958
WACC 12%
Perpetuity Growth Rate 2.5%
PV of Total Unlevered Cash Flows ($mm) 110,809
PV of Perpetuity ($mm) 75,973
Total Enterprise Value ($mm) 186,782
Less Total Debt ($mm) 18,590
Total Value of Equity ($mm) 168,192
Shares Outstanding (mm) 468.76
20Fair Value Per Share $358.80
Potential Upside/(Downside) (43.50%)
216. Appendix
A) Discounted Cash Flow Model Assumption and Details for Walmart
22B) Discounted Cash Flow Model Assumption and Details for Amazon
23References
Amazon, 2015. Annual Reports and Proxies. [Online]
Available at: http://phx.corporate-ir.net/phoenix.zhtml?c=97664&p=irol-reportsAnnual
[Accessed 9 November 2015].
Forbes, 2015. Top Stories. [Online]
Available at: http://www.forbes.com/
[Accessed 9 November 2015].
Guru Focus, A, 2015. Amazon.com Inc. [Online]
Available at:
http://www.gurufocus.com/chart/AMZN#&serie=,,id:Revenue_2,s:AMZN,,id:Net_Income_2,s:
AMZN&log=0&per=0
[Accessed 9 November 2015].
Guru Focus, B, 2015. Amazon.com Inc. [Online]
Available at:
http://www.gurufocus.com/chart/AMZN#&serie=,,id:total_freecashflow,s:AMZN,,id:Cash_Flow
_from_Operations,s:AMZN&log=0&per=0
[Accessed 9 November 2015].
ICRA Online, 2015. Why Walmart Stores, Inc. Is a Good Choice for Dividend Investors.
[Online]
Available at: http://www.fool.com/investing/general/2015/01/13/why-Walmart-is-a-good-choice-
for-dividend-investo.aspx
[Accessed 9 November 2015].
24Mark Brohan, 2015. Global e-commerce sales climb 22% for Walmart. [Online]
Available at: https://www.internetretailer.com/2015/02/19/global-e-commerce-sales-climb-22-
Walmart
[Accessed 9 November 2015].
Reuters, 2012. Amazon Kindle Sold 'At Cost,' CEO Jeff Bezos Confirms. [Online]
Available at: http://www.huffingtonpost.com/2012/10/11/amazon-kindle-lost-leader-
bezos_n_1959919.html
[Accessed 9 November 2015].
Yahoo Finance, B, 2015. Key Statistics. [Online]
Available at: http://finance.yahoo.com/q/ks?s=AMZN+Key+Statistics
[Accessed 9 November 2015].
Yahoo Finance, E, 2015. Analyst Estimates. [Online]
Available at: https://uk.finance.yahoo.com/q/ae?s=AMZN
[Accessed 9 November 2015].
Yahoo Finance, F, 2015. Key Statistics. [Online]
Available at: https://finance.yahoo.com/q/ks?s=WMT
[Accessed 9 November 2015].
Yahoo Finance, G, 2015. Key Statistics. [Online]
Available at: https://finance.yahoo.com/q/ks?s=TGT&ql=1
[Accessed 9 November 2015].
25Yahoo Finnace, A, 2015. Amazon.com, Inc. (AMZN). [Online]
Available at: https://uk.finance.yahoo.com/q/sec?s=AMZN
[Accessed 9 November 2015].
Yahoo Finnace, C, 2015. SEC Filings. [Online]
Available at: https://uk.finance.yahoo.com/q/sec?s=AMZN
[Accessed 9 November 2015].
Yahoo Finnace, D, 2015. SEC Filings. [Online]
Available at: https://uk.finance.yahoo.com/q/sec?s=AMZN
[Accessed 9 November 2015].
26You can also read


