FY 2019 RESULTS 2019 TARGETS ACHIEVED IN A TOUGH ENVIRONMENT - Valeo
←
→
Page content transcription
If your browser does not render page correctly, please read the page content below

FY 2019 RESULTS 2019 TARGETS ACHIEVED IN A TOUGH ENVIRONMENT

AGENDA

    2019 HIGHLIGHTS
    ACCELERATION OF OUTPERFORMANCE AND CASH GENERATION IN H2

    H2 2019 & FY 2019 RESULTS
    FOCUS ON PROFIT & CASH GENERATION

    2020 OUTLOOK
    IN LINE WITH OUR INVESTOR DAY TARGETS

2                                               February 20, 2020
UPDATE ON COVID-19 & CHINA SITUATION

It is still too early to assess the impact of the COVID-19 outbreak in China on the automotive industry
and on Valeo specifically.

Valeo has taken every step to protect its employees and their families.

All our 32 plants outside Hubei province have restarted, representing 90% China sales in nominal conditions.

Valeo’s supply chain is gradually getting back in order.

China represents 12% of our reported OEM sales by destination.

3                                                                                        February 20, 2020

AGENDA

    2019 HIGHLIGHTS
    ACCELERATION OF OUTPERFORMANCE AND CASH GENERATION IN H2

    H2 2019 & FY 2019 RESULTS
    FOCUS ON PROFIT & CASH GENERATION

    2020 OUTLOOK
    IN LINE WITH OUR INVESTOR DAY TARGETS

4                                               February 20, 2020
2019 HIGHLIGHTS: RESULTS IN LINE WITH THE GUIDANCE
                           WITH A STRONG ACCELERATION IN H2

                     Valeo’s 2019 results in line with the guidance as presented in October 2019

                     Strong and accelerating outperformance of the market at +8 points in H2 & +4 points in H1

                     High level of cash flow generation with €519M in 2019

                     Costs reduction by €107M and investments reduction by €204M in 2019

                     Profitability recovery accelerating in H2:
                                  EBITDA* at 13.7% of sales in H2 & 13.2% in 2019
                                  Operating margin** at 6.1% of sales in H2 & 5.8% in 2019

    * excl. impact of GM strike & TCM
    ** excl. JV & Associates, impact of GM strike & TCM
5                                                                                                  February 20, 2020
WE ARE IN LINE
                                                            WITH OUR INVESTOR DAY TRAJECTORY

                             #1 in EV & ADAS                                   >€30bn backlog at end of 2019
                                                                                                                            2019 RESULTS
                             ~5 points OEM sales outperformance                8 points outperformance in H2
BENEFITING FROM A SUCCESSFUL TRANSFORMATION
                                  AND OUR TECHNOLOGICAL PLATFORMS

                                                                                                                          SILVERADO           208           e208                 FIT
                                                                                                                                   SOP 2019                    SOP 2019                 SOP 2019

                                                                                                                                                                                       New
                                                                                                                            X1.6              X1.3             X2.9                    gains

                                                                                                                          GOLF 8                 ID.3**
                                                                                                                                   SOP 2019                    SOP 2019

    We have invested in 12 new key technological platforms to
    create a unique product portfolio.
                                                                                                                            X3.4                     X4.5
    Reinforcing our #1 position in fast growing electrification and
    ADAS markets.
                                                                                                                   Expanding our competitive edge through high barriers to entry
                                                                                                                   leading to a strong increase of our content per car.*
      *Ratio : Valeo + VSeA (average content per car new vehicle )/(average content per car previous generation)
      **Ratio : Valeo + VSeA (average content per car ID.3)/(average content per car Golf 7)
7                                                                                                                                                            February 20, 2020
OUTPERFORMANCE IS BACK ON TRACK
    THANKS TO START OF PRODUCTION ON NEW CONTRACTS AND
            TECHNOLOGICAL PLATFORMS STRATEGY

    OEM SALES OUTPERFORMANCE (LIKE FOR LIKE)
              IN PERCENTAGE POINTS

                 +9pts
                                                                                    +8pts

                                       +6pts
                            +5pts
                                                                       +4pts
                                               +3pts
                                                               +2pts

                                                       0pts

                 H1 16       H2 16     H1 17   H2 17   H1 18   H2 18   H1 19         H2 19

8                                                                              February 20, 2020
STRICT CONTROL OF COST AND CAPEX IN 2019

     €107M           COST REDUCTION

     €204M           IN CAPEX (5.9% OF SALES)

9                                        February 20, 2020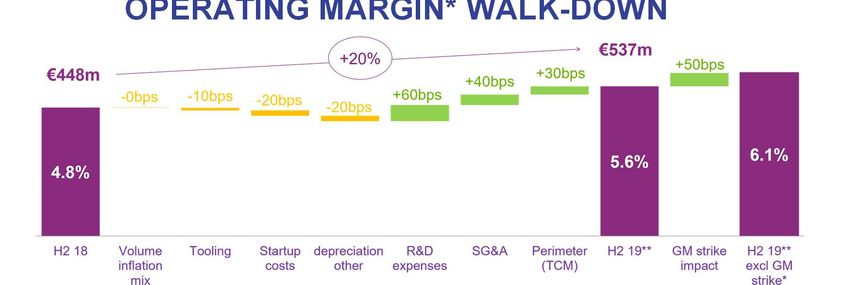
PROFITABILITY RECOVERY SINCE H2 18
                  IN LINE WITH EXPECTATIONS
     DESPITE A 6% DROP IN AUTOMOTIVE PRODUCTION IN 2019

        EBITDA
     AS A % OF SALES

                                                                                 13.7%
                       13.6%
                                                             12.6%
                                                                                           +2.2pts
                                           11.5%

                       H1 18               H2 18             H1 19*               H2 19*

                               12.6% in 2018       +0.6pts            13.2% in 2019
10                                                                                         February 20, 2020
PROFITABILITY RECOVERY SINCE H2 18
IN LINE WITH EXPECTATIONS
DESPITE A 6% DROP IN AUTOMOTIVE PRODUCTION IN 2019
OPERATING MARGIN*
AS A % OF SALES
7.7%
6.1%
5.5%
4.8%
+1.3pts
H1 18 H2 18 H1 19** H2 19**
* Excl. JV & associates
11 February 20, 2020VALEO SIEMENS eAUTOMOTIVE
THE EMERGENCE OF A LEADER
VSeA SALES
(€BN) >2.0
‣ Peak of Valeo Siemens eAutomotive’s losses in 2019
‣ Strong decrease of R&D as of 2021
>1.4
‣ 8% EBITDA in 2022 & 12% EBITDA in 2024
‣ Free cash flow breakeven in 2022
0.3 ‣ Ongoing negotiation on new projects and renewals
2019 2022 2024
12 February 20, 2020€519M
FREE CASH FLOW
STRONG FOCUS ON CASH GENERATION
FREE CASH FLOW
IN €M
282
237
125
36
H1 18 H2 18 H1 19 H2 19
13 €161M in 2018 €519M in 2019 February 20, 2020EARNING PER SHARE
EARNING PER SHARE
EXCLUDING NON-RECURRING ITEMS
€1.86
14 February 20, 2020STRONG FREE CASH FLOW GENERATION
SUPPORTING DIVIDEND POLICY
DIVIDEND OF
€1.25 PER SHARE
TO BE PROPOSED
AT THE NEXT AGM IN MAY 2020
15 February 20, 2020SUSTAINABILITY AT THE HEART OF OUR STRATEGY
GREENER & SAFER MOBILITY
*
AT THE HEART OF OUR
STRATEGY #1 IN 2020 :
‣ NEW MID TERM SUSTAINABLE
GREENER
(57%)
2019
SAFER
#1 TARGETS
OEM ‣ LONG TERM CARBON NEUTRALITY
(36%)
Sales**
#1 PROGRAM
#1*
* excl. Tyre companies
** incl. VSeA
16 February 20, 2020AGENDA
2019 HIGHLIGHTS
ACCELERATION OF OUTPERFORMANCE AND CASH GENERATION IN H2
H2 2019 & FY 2019 RESULTS
FOCUS ON PROFIT & CASH GENERATION
2020 OUTLOOK
IN LINE WITH OUR INVESTOR DAY TARGETS
17 February 20, 20208PTS OUTPERFORMANCE
STRONG ACCELERATION IN H2
H2
2019
H2 SALES
TOTAL SALES* OF €9.6bn: UP 4% AS REPORTED
UP 3% LIKE FOR LIKE
OEM SALES: 8PTS OUTPERFORMANCE
UP 3% AS REPORTED AND LIKE FOR LIKE
AFTERMARKET SALES: UP 1% AS REPORTED
STABLE LIKE FOR LIKE
* excl. TCM
18 February 20, 20208PTS OUTPERFORMANCE
STRONG ACCELERATION IN H2
H2
2019
8 pts
outperformance 579
976
€m 9 588
8,033
OEM* Aftermarket* Miscellaneous* Sales*
Reported +3% +1% +11% +4%
Like for like +3% 0% +9% +3%
Exchange rates +1.7% Exchange rates +1.7% Exchange rates +1.3% Exchange rates +1.6%
* excl. TCM
Scope -1.3% Scope -1.0% Scope +0.4% Scope -1.2%
19 February 20, 2020ACCELERATION OF OEM SALES OUTPERFORMANCE
ACROSS ALL REGIONS
H2
Like for like
OEM
OEM 2019
45% of Valeo sales(2) sales(2)
sales(2)
+3%
OEM +5%
20% of Valeo sales(2) sales(2) Europe (1)
World
+5%
North
NorthAmerica
America
OEM sales** +6% Outperformance
Production*** +4% +9pts vs IHS(3) Outperformance
Outperformance +8pts vs IHS(3)
+10pts vs IHS(3)
OEM
19% of Valeo sales(2) sales(2)
-7%
OEM Asia excl. China
(1)
2% of Valeo sales(2) sales(2)
+10% Outperformance
South America 0pts vs IHS(3) OEM
14% of Valeo sales(2) sales(2)
+8%
Outperformance
+16pts vs IHS(3) China
Outperformance
(1) Europe including Africa, Asia including Middle East
(2) Valeo OEM sales by destination
+11pts vs CPCA(3)
20 (3) IHS estimates – China Passenger Car Association (CPCA) estimates for China February 20, 2020ACCELERATION OF OUTPERFORMANCE
IN EVERY BUSINESS IN H2
H2
2019
Outperformance +9pts +9pts +4pts +10pts
CDA
VIS 19%
31%
Group
3,000 €9.6bn*
H2 total sales 2,556 PTS
In €m
1,843 2,252 27%
THS
23%
% of H2 19 sales
Comfort & Driving Powertrain Thermal Visibility
Assistance*
Total reported sales -1% +3% +1% +9%
OEM sales
* excl. TCM
Like for like
+4% +4% -1% +5%
21 February 20, 2020ORDER INTAKE / OEM SALES RATIO AT 1.34
FY
2019
VALEO ORDER INTAKE
OF €22bn WITH AN INNOVATION* RATIO OF 47%
VALEO SIEMENS EAUTOMOTIVE
OF €0.8bn
* Products and technologies sold by less than 3 years incl. Valeo Siemens eAutomotive
22 February 20, 2020ORDER INTAKE / OEM SALES RATIO AT 1.34
FY
Order intake of €22bn 2019
OEM sales of €16.4bn
SA 18% SA
2%
20% Order 4%
Asia intake/OEM Asia
NA excl. NA
€3.2bn China
Asia sales ratio excl.
19% 32%
Asia 1.5x
€4bn China
€5.3bn Of which China 1.6x 19% Asia
China 31% Europe 1.3x 35%
13% with local
North America 1.2x €7.8bn
Europe Chinese
€7.5bn OEMs
South America 2.1x Europe
China
Group 1.34x €9.5bn 16% 26%
46%
with local
Chinese
OEMs
43%
% of 2019 OEM sales*
* OEM sales and order intake by destination incl. joint ventures but excluding Valeo Siemens eAutomotive, excl. TCM % of 2019 order intake*
23 February 20, 20206PTS OUTPERFORMANCE
STRONG ACCELERATION IN 2019
FY
2019
2019 SALES
TOTAL SALES* OF €19.2bn: UP 1% AS REPORTED
STABLE LIKE FOR LIKE
OEM SALES: 6PTS OUTPERFORMANCE
STABLE AS REPORTED AND LIKE FOR LIKE
AFTERMARKET SALES: DOWN 2% AS REPORTED
DOWN 2% LIKE FOR LIKE
* excl. TCM
24 February 20, 20206PTS OUTPERFORMANCE
IN A DIFFICULT ENVIRONMENT WITH PRODUCTION DOWN 6%
FY
2019
20 000 6 pts 1,150
outperformance
18 000
1,972
16 000
14 000
12 000
€m10 000 19 244
8 000 16,122
6 000
4 000
2 000
0
OEM* Aftermarket* Miscellaneous* Sales*
Reported 0% -2% +19% +1%
Like for like 0% -2% +15% 0%
Exchange rates +1.8% Exchange rates +1.0% Exchange rates +1.8% Exchange rates +1.7%
* excl. TCM
Scope -1.6% Scope -1.0% Scope +2.0% Scope -1.4%
25 February 20, 20206PTS OEM SALES OUTPERFORMANCE
FY
Like for like
OEM
2019
47% of Valeo sales(2) sales(2) OEM
OEM +1% sales(2)
20% of Valeo sales(2) sales(2) Europe (1) 0%
+5%
North
NorthAmerica
America World
OEM sales** +6% Outperformance
Production*** +4% +5pts vs IHS(3)
Outperformance Outperformance
+9pts vs IHS(3) +6pts vs IHS(3)
OEM
19% of Valeo sales(2) sales(2)
-6%
OEM Asia excl. China
(1)
2% of Valeo sales(2) sales(2)
+6% Outperformance
South America 0pts vs IHS(3) OEM
12% of Valeo sales(2) sales(2)
-5%
Outperformance
+10pts vs IHS(3) China
Outperformance
(1) Europe including Africa, Asia including Middle East
(2) Valeo OEM sales by destination
+5pts vs CPCA(3)
26 (3) IHS estimates – China Passenger Car Association (CPCA) February 20, 2020
estimates for ChinaBALANCED GEOGRAPHIC POSITIONING
FY
OEM sales by production region 2019
% of OEM sales
Eastern Eastern
Europe & Europe &
Africa Africa
16% 15%
Western Western
Europe Europe
Asia excl. 32% Asia excl. 32%
China China
59% in Asia 18% 58% in Asia 18%
& emerging & emerging
countries countries
US
China US
China 9%
12% 10%
13%
Mexico
Mexico
11%
10%
SA SA
2% 2%
27
2018 2019 February 20, 2020BALANCED CUSTOMER PORTFOLIO
FY
2019
% of OEM sales
Other Other
6% 6%
French French
13% German 13% German
30% 30%
American American
18% 18%
A
Asian
sian** Asian
sian**
A
26%33% 26%33%
2018 2019
28 February 20, 2020EVERY BUSINESS GROUP IS OUTPERFORMING THE MARKET
FY
2019
Outperformance +8pts +6pts +3pts +6pts
CDA
VIS 19%
31%
6,014 Group
2019 total sales 5,121 €19.2bn*
3,649 4,582 PTS
In €m 26%
THS
24%
Comfort & Driving Powertrain Thermal Visibility % of 2019 sales
Assistance*
Total reported sales -3% 0% 0% +4%
OEM sales
Like for like
+2% 0% -3% 0%
29 February 20, 2020
* Excl. TCMSTRICT CONTROL OF R&D, SG&A AND CAPEX
FY
2019
€107M COST REDUCTION
€204M IN CAPEX (5.9% OF SALES)
30 February 20, 2020DECREASE IN R&D EXPENSES
THANKS TO LEVERAGING OF OUR TECHNOLOGICAL PLATFORMS
TO 7.8% OF SALES, DOWN 0.7PTS
H2
2019
Capitalized development
In €m and as a % of sales expenditure
In €m and as a % of sales Gap between
369 362 capitalized R&D and
amortization
786 -5% down 0.7 points
750
from 2.2% to 1.5%
4.0% 3.8%
H2 18 H2 19*
Amortization and impairment
of capitalized development expenditure (net of subsidies)
In €m and as a % of sales
217
171
-70bps
8.5% 7.8% 1.8% 2.3%
* Excl. TCM
H2 18 H2 19* H2 18 H2 19*
31 February 20, 2020DECREASE IN R&D EXPENSES
THANKS TO LEVERAGING OF OUR TECHNOLOGICAL PLATFORMS
TO 7.9% OF SALES, DOWN 0.3PTS
FY
2019
Capitalized development
In €m and as a % of sales expenditure
In €m and as a % of sales
Gap between
716 753 capitalized R&D and
amortization
1,560 -2% 1,526 down 0.3 points
3.7% 3.9% from 2.1% to 1.8%
2018 2019*
Amortization and impairment
of capitalized development expenditure (net of subsidies)
In €m and as a % of sales
398
308
-30bps
8.2% 7.9% 1.6% 2.1%
* Excl. TCM
2018 2019* 2018 2019*
32 February 20, 2020DECREASE IN SG&A
DOWN 0.5PTS TO 4.3% OF SALES
H2
In €m and as a % of sales 2019
442 410
-7%
Selling
Selling
expenses
4.8% €158m
expenses
€147m
-50bps
4.3%
Selling
expenses Selling
Admin. Admin.
1.7% expenses expenses expenses
1.5% €284m €263m
H2 18 H2 19*
Admin. Admin.
expenses -30bps expenses
3.1% 2.8%
H2 18 H2 19*
* Excl. TCM
33 February 20, 2020DECREASE IN SG&A
DOWN 0.5PTS TO 4.3% OF SALES
FY
In €m and as a % of sales 2019
911 -6% 860
Selling
Selling
expenses
expenses
€316m
4.8% -30bps
€301m
4.5%
Selling Selling
expenses expenses Admin. Admin.
1.7% 1.6% expenses expenses
€595m €559m
2018 2019*
Admin. Admin.
expenses -20bps expenses
3.1% 2.9%
2018 2019*
* Excl. TCM
34 February 20, 2020CAPEX* DOWN €160M
THANKS TO TECHNOLOGICAL PLATFORMS
H2
In €m and as a % of sales 2019
€(160)m
-190bps
7.5% 5.6%
H2 18 H2 19
-23%
696 536
H2 18 H2 19
* Excl. capitalized R&D
35 February 20, 2020CAPEX* DOWN €204M
THANKS TO TECHNOLOGICAL PLATFORMS
FY
In €m and as a % of sales 2019
€(204)m
-110bps
7.0% 5.9%
2018 2019
-15%
1,337 1,133
2018 2019
* Excl. capitalized R&D
36 February 20, 2020IN A CHALLENGING ENVIRONMENT, GUIDANCE ACHIEVED
THANKS TO COST REDUCTION PLAN AND
TECHNOLOGICAL PLATFORMS
FY
2019
EBITDA* IN LINE WITH GUIDANCE
AT €2,551M OR 13.2% OF SALES
OPERATING MARGIN* (EXCL. JV & ASSOCIATES) IN LINE WITH GUIDANCE
AT €1,114M OR 5.8% OF SALES
JV & ASSOCIATES
OF €(237)M
NET INCOME
OF €313M OR 1.6% OF SALES
* Excl. Impact of GM strike and TCM
37 February 20, 2020EBITDA* OF 2,551M
13.2% OF SALES, UP 0.6PTS
FY
2019
EBITDA
AS A % OF SALES
13.7%
13.6%
12.6%
+2.2pts
11.5%
H1 18 H2 18 H1 19* H2 19*
12.6% in 2018 +0.6pts 13.2% in 2019
38 February 20, 2020OPERATING MARGIN* WALK-DOWN
H2
2019
FY
2019
* Excl. JV & associates
** Excl. TCM
NB: rounded figures
39
GUIDANCE ACHIEVED DESPITE SHARPER DECLINE IN AUTOMOTIVE PRODUCTION
February 20, 20202019 OPERATING MARGIN* AT 5.5% OF SALES
5.8% OF SALES EXCL. GM STRIKE
H2 18 H2 19** 2018 2019**
Total sales (€m) 9,261 9,588 +4% 19,124 19,244 +1%
Gross margin 1,676 1,697 +1% 3,674 3,450 -6%
As a % of sales 18.1% 17.7% -40bps 19.2% 17.9% -130bps
R&D expenditure (786) (750) -5% (1,560) (1,526) -2%
As a % of sales (8.5)% (7.8)% +70bps (8.2)% (7.9)% +30bps
SG&A (442) (410) -7% (911) (860) -6%
As a % of sales (4.8)% (4.3)% +50bps (4.8)% (4.5)% +30bps
Operating margin excl. JV & associates 448 537 +20% 1,203 1,064 -12%
As a % of sales 4.8% 5.6% +80bps 6.3% 5.5% -80bps
JV & Associates (83) (130) na (111) (237)*** na
As a % of sales (0.9)% (1.4)% -50bps (0.6)% (1.2)% -60bps
Operating margin incl. JV & associates 365 407 +12% 1,092 827 -24%
As a % of sales 3.9% 4.2% +30bps 5.7% 4.3% -140bps
* Excl. JV & associates
** Excl. TCM
***Of which:
40 Valeo Siemens eAutomotive = €(260)m
February 20, 2020
Chinese and Indian joint ventures negatively impacted by local market conditions2019 NET INCOME OF €313M OR 1.6% OF SALES
H2 18 H2 19 2018 2019
Total sales (€m) 9,261 9,701 +5% 19,124 19,477 +2%
Operating margin incl. JV & associates 365 390 +7% 1,092 797 -27%
As a % of sales 3.9% 4.0% +10bps 5.7% 4.1% -160bps
Other income & expenses (38) (35) -8% (56) (65) +16%
As a % of sales (0.4)% (0.4)% 0bps (0.3)% (0.3)% 0bps
Operating income 327 355 +9% 1,036 732 -29%
As a % of sales 3.5% 3.7% +20bps 5.4% 3.8% -160bps
Cost of net debt (34) (36) +6% (66) (73) +11%
Other financial income & expenses (7) 2 -129% (25) (2) -92%
Income before taxes 286 321 +12% 945 657 -31%
Income taxes (149) (133) -11% (303) (263) -13%
Effective tax rate 40.4% 29.5% -11pts 28.7% 29.4% +0.7pts
Non-controlling interests and other (44) (37) -16% (96) (81) -16%
Net income 93 151 +62% 546 313 -43%
As a % of sales 1.0% 1.6% +60bps 2.9% 1.6% -130bps
EPS (€) N/A N/A N/A 2.3 1.3 -43%
41 February 20, 2020EXCLUDING NON-RECURRING ITEMS
EPS OF €1.86
FY
2019
2019
Net income* (€m) 313
EPS* €1.31
Net income* (€m) (excluding non-recurring items) 444
EPS* (excluding non-recurring items) €1.86
* Excl. Impact of GM strike and TCM
42 February 20, 2020IN A CHALLENGING ENVIRONMENT,
THANKS TO COST REDUCTION AND
TECHNOLOGICAL PLATFORMS LEVERAGE
FY
2019
€519M FREE CASH FLOW
43 February 20, 2020€519M IN FREE CASH FLOW
2018 2019
EBITDA (€m) 2,410 2,496 Decrease in tooling inventories
Change in operating working capital* (22) 301 Decrease in customers overdues
Restructuring & social costs (31) (37)
Other operating items (incl. taxes) (280) (475)
Of which: Taxes (267) (292)
Pensions (35) (33)
IFRS 16 leases N/A (84)
Cash from operating activities** (€m) 2,077 2,285
CAPEX (incl. capitalized R&D) outflow (1,916) (1,766) €(150)m / -8%
Free cash flow** (€m) 161 519 X3
Interest (58) (71)
Other financial items (701) (658)
Net cash flow (€m) (598) (210) Incl. €343m in dividends paid
Net debt (€m) before IFRS 16 N/A 2,376
IFRS 16 impact on net debt N/A 441
* Restated of R&D cash contribution reclassified in CAPEX
44 **Excl. sale of trade receivables February 20, 2020
Net debt (€m) 2,248 2,817THANKS TO FREE CASH FLOW OF €519M,
BALANCE SHEET REMAINS STRONG
NET DEBT
OF €2,817M AFTER IFRS 16 OF +€441M
45 February 20, 2020THANKS TO FREE CASH FLOW OF €519M,
BALANCE SHEET REMAINS STRONG
Net debt to EBITDA Shareholders’ equity and net debt
2,877 2,817
IFRS 16
IFRS 16
2,877 2,817
IFRS IFRS
2,248 4,571 2,435 4,475 2,376 4,629
Dec 31, June 30, Dec 31,
2018 2019 2019
Gearing Gearing Gearing Gearing Gearing
49% 64% 51% 61%
2,248 2,410 2,435 2,287 2,376 2,496 54%
Dec 31, 2018 0 June 30, 0 Dec 31, 2019
2019
Shareholders’ equity (€m)
Leverage Leverage Leverage Leverage Leverage Net debt (€m)
excluding non-controlling interests
0.93x 1.06x 1.26x 0.95x 1.13x
LT Outlook ST
Net debt/EBITDA covenant of 3.5
Moody’s Baa3 Stable Prime-3
46 Net debt (€m) 12-month rolling EBITDA (€m) After IFRS 16 S&P BBB- February 20, 2020
Stable A-3VALEO’S DEBT MATURITY PROFILE
COMFORTABLY SPREAD OVER THE PERIOD 2021/2026
3500 Outstanding
Maturity Coupon
amount
Non-dilutive USD 575m
June 2021 0%
3000 Convertible bond (€470m)
EMTN Sept. 2022 €600m 0.375%
EMTN January 2023 €500m 0.625%
2500 Undrawn
credit lines Schuldschein April 2023 € 336m Eurib 6M (floor) + 0,95% - 0.95%
3.0 year EMTN January 2024 € 700m 3.25%
2000 maturity
Schuldschein April 2025 € 212m Eurib 6M (floor) + 1.15% - 1.291%
EMTN June 2025 € 600m 1,5%
1500 EMTN March 2026 € 600m 1,625%
1000 Average maturity: 4.0 years
Cash &
Cash
500 equivalent
0
31/12/2019 2020 2021 2022 2023 2024 2025 2026
47 February 20, 2020
Cash and cash equivalents EMTN non-dilutive convertible bond Schuldschein2019 DIVIDEND 48 February 20, 2020
STRONG FREE CASH FLOW GENERATION
                     SUPPORTING OUR DIVIDEND POLICY

                                                       1,25    1,25   1,25       1,25
     Dividend (€/share)
                                               1,00

                                        0,73
                                 0,57
                  0,47    0,50
       0,40

       2010       2011    2012   2013   2014   2015    2016    2017   2018        2019

              €1.25/SHARE DIVIDEND TO BE PROPOSED AT THE NEXT AGM IN MAY 2020

49                                                                              February 20, 2020
AGENDA
2019 HIGHLIGHTS
ACCELERATION OF OUTPERFORMANCE AND CASH GENERATION IN H2
H2 2019 & FY 2019 RESULTS
FOCUS ON PROFIT & CASH GENERATION
2020 OUTLOOK
IN LINE WITH OUR INVESTOR DAY TARGETS
50 February 20, 20202020 OUTLOOK
Valeo expects automotive production to be down by 2% in 2020.
Excluding the possible impact of the coronavirus in China, the Group has set the following objectives for
2020 in line with the objectives presented at the Investor Day on December 10, 2019:
outperformance of more than 5 percentage points;
strict control over costs and capital expenditure;
further increase in EBITDA and improvement in operating margin excluding share in net
earnings of equity-accounted companies (as a % of sales);
reduction in the impact of the Valeo Siemens eAutomotive joint venture on “Share in net
earnings of equity-accounted companies”;
significant free cash flow generation.
51 February 20, 2020IN LINE WITH OUR INVESTOR DAY TARGETS
2019 2022
SALES (€bn) 19.2 >21.5
EBITDA 13.2% >15%
OPERATING MARGIN BEFORE JV 5.8%** ~ 7%
CASH CONVERSION RATE (% EBITDA) 21% >15%
FREE CASH FLOW €519M €1.3-1.5bn
over 2020/2022
* estimated 2019
** after one off effect linked to october 2019 GM strike in North America
52 February 20, 2020BACK-UP
BACK-UP AGENDA

     Q4 SALES
     7 POINTS OEM SALES OUTPERFORMANCE

     2019 RESULTS RECONCILIATION
     TOP COLUMN MODULE BUSINESS & GM STRIKE IMPACT

     BUSINESS GROUP INFORMATION
     EVERY BUSINESS GROUP IS OUTPERFORMING THE MARKET

55                                                   February 20, 2020
BACK-UP AGENDA
Q4 SALES
7 POINTS OEM SALES OUTPERFORMANCE
2019 RESULTS RECONCILIATION
TOP COLUMN MODULE BUSINESS & GM STRIKE IMPACT
BUSINESS GROUP INFORMATION
EVERY BUSINESS GROUP IS OUTPERFORMING THE MARKET
56 February 20, 20207 POINTS OEM SALES OUTPERFORMANCE
Q4
7 pts 2019
outperformance 316
504
4 860
€m 4,040
OEM* Aftermarket* Miscellaneous* Sales*
Reported +1% +4% -10% +1%
Like for like +1% +3% -7% +1%
Exchange rates +1.3% Exchange rates +1.3% Exchange rates +1.3% Exchange rates +1.3%
* Excl. TCM
Scope -1.2% Scope -0.6% Scope -4.1% Scope -1.4%
57 February 20, 20207 POINTS OEM SALES OUTPERFORMANCE
Q4
OEM
Like for like sales(2) 2019
OEM +1%
46% of Valeo sales(2) sales(2)
OEM +4% World
18% of Valeo sales(2) sales(2) Europe (1)
-4%
North
NorthAmerica
America
OEM sales** +6% Outperformance Outperformance
Production*** +4% +11pts vs IHS(3) +7pts vs IHS(3)
Outperformance
+5pts vs IHS(3)
OEM
19% of Valeo sales(2) sales(2)
-9%
OEM Asia excl. China
(1)
2% of Valeo sales(2) sales(2)
+10% Outperformance
South America 0pts vs IHS(3) OEM
14% of Valeo sales(2) sales(2)
+12%
Outperformance
+18pts vs IHS(3) China
(1) Europe including Africa;
Outperformance
Asia including Middle East
(2) Valeo OEM sales by destination
+12pts vs CPCA(3)
58 (3) IHS estimates – China Passenger Car Association (CPCA) estimates for China
February 20, 2020IN Q4, EVERY BUSINESS GROUP IS OUTPERFORMING THE MARKET
Q4
2019
Outperformance +9pts +9pts +3pts +8pts
CDA
VIS 19%
32%
Group
€4.9bn*
1,542
Q4 total sales 1,307 PTS
In €m 1,122 27%
908 THS
23%
Comfort & Driving Powertrain Thermal Visibility % of Q4 19 sales
Assistance*
Total reported sales -6% +2% -3% +6%
OEM sales
* Excl. TCM
Like for like
+3% +3% -3% +2%
59 February 20, 2020BACK-UP AGENDA
Q4 SALES
7 POINTS OEM SALES OUTPERFORMANCE
2019 RESULTS RECONCILIATION
TOP COLUMN MODULE BUSINESS & GM STRIKE IMPACT
BUSINESS GROUP INFORMATION
EVERY BUSINESS GROUP IS OUTPERFORMING THE MARKET
60 February 20, 2020RECONCILIATION
OF VALEO AND TOP COLUMN MODULE (TCM) BUSINESS DATA
AND IMPACT OF THE GENERAL MOTORS STRIKE FY
2019
The Group decided to withdraw from the TCM segment and is no longer taking orders for this product line.
The table below reconciles reported data for 2019 with data excluding the TCM business and excluding the impact of the General
Motors strike:
61 February 20, 2020BACK-UP AGENDA
Q4 SALES
7 POINTS OEM SALES OUTPERFORMANCE
2019 RESULTS RECONCILIATION
TOP COLUMN MODULE BUSINESS & GM STRIKE IMPACT
BUSINESS GROUP INFORMATION
EVERY BUSINESS GROUP IS OUTPERFORMING THE MARKET
62 February 20, 2020COMFORT & DRIVING ASSISTANCE
Outperformance
+6pts +9pts +8pts
OEM sales growth
Market share* and competitors: 2019 key figures:
Like for like -1% +4% +2%
- Comfort & Driving Assistance: • Sales: €3.6bn (19% of Group sales)
Valeo no. 2 • 22,100 employees
1,843 Continental + Valeo + Bosch + Kostal ~ 43%* • 31 plants
• 9 development centers
3,649 • 7 research centers
Total sales
(€m) 1,806
* 2019 Valeo estimate
H1 19 H2 19 2019
Reported -5% -1% -3%
Key growth drivers:
3 main macro-economic trends confirmed with cars more autonomous, more connected and more intuitive
˜Supported by increasingly stringent regulatory and certification environment (Euro NCAP in Europe and NTHSA in the US)
˜Leading to further increase in take-up of existing innovative products (including cameras, displays, sensors, etc.)
Latest business developments:
Another record order intake with orders for active safety products representing over 7x sales, orders for camera viewing & systems representing over 2x sales
63 February 20, 2020
˜Safety activity order intake covering laser scanner, front camera and radarPOWERTRAIN SYSTEMS
Outperformance
+3pts +9pts +6pts
OEM sales growth 2019 key figures:
Like for like -4% +4% 0% Market share* and competitors:
• Sales: €5.1bn (26% of Group sales)
- Powertrain Systems: Valeo no. 1
2,556 Valeo & VSeA + BlueNexus & Denso + Luk ~40%* • 23,500 employees
Total sales • 57 plants
(€m) 5,121 • 18 development centers
2,565 • 7 research centers
H1 19 H2 19 2019 * 2018 Valeo estimate
Reported -4% +3% 0%
Key growth drivers: Objective of reducing CO2 emissions and fossil fuel consumption through 3 priorities for engines:
Cleaner engines
Gearbox automation
Powertrain electrification and development of low (12V, 48V) and high voltage
Latest business developments:
New contracts in the 48V in Europe and in Asia (South Korea and China)
Additional contracts for the Istar product for Europe and India
New contracts for dual mass flywheels (for 2 and pedals transmissions) in Europe and Asia
New contracts for torque converters in Asia and North America
New contracts in air management (sensors) in Asia and Europe, and active actuation in Europe
February 20, 2020
Start of production of 1 major contract at Valeo Siemens eAutomotive in Europe (VW ID3)THERMAL SYSTEMS
Outperformance
+4pts +4pts +3pts
Market share* and competitors: 2019 key figures:
OEM sales growth
Like for like -3% -1% -3%
Thermal Systems: Valeo no. 2 • Sales: €4.6bn (24% of Group sales)
Denso + Valeo + Hanon + Mahle ~ 59%*
• 25,100 employees
• 68 plants
2,252
• 10 development centers
Total sales 4,582 • 3 research centers
(€m)
2,330 ,282
1 *2019 Valeo estimate
H1 19 H2 19 2019
Reported -1% +1% 0%
Key growth drivers:
Thermal solutions for Electrified vehicles
Latest business developments:
Almost all PGs achieved the desired level of order intake, with particular good results for TCC
Best order Intake results with Renault-Nissan and Toyota, but also strong achievement with PSA Group and FCA Group
Key awards are : HVAC in Russia, Electrified HVAC and High Voltage Heaters In China
February 20, 2020VISIBILITY SYSTEMS
Outperformance
+4pts +10pts +6pts
OEM sales growth Market share* and competitors: 2019 key figures:
Like for like -4% +5% 0%
- Lighting Systems: Valeo no. 1 • Sales: €6.0bn (31% of Group sales)
Valeo + Koito + AL Magnetti Marelli ~ 53%* • 38,900 employees
3,000 • 51 plants
6,014
- Wiper Systems: Valeo no. 1 • 16 development centers
Total sales Valeo + Denso + Bosch ~ 69%* • 5 research centers
(€m) 3,014 1,495
*2019 Valeo estimate
H1 19 H2 19 2019
Reported -1% +9% +4%
Key growth drivers:
Pixel 32 launched on Passat B8 PA, Pixel 22 on Golf A8, Matrix Beam launched on BMW X1 facelift & New Opel Corsa (first B-seg mainstream car with Matrix), life extension on several programs
100% LED lighting becoming the standard on all segments: Renault Megane, VW Golf, ...
Increasing content in Interior Lighting & Welcome light with premium customers
Latest business developments:
Pixel 48 awarded on C-segment mainstream car
Monolithic HD Lighting: On-going RFQs with mainstream OEM
Growth on new decorative lamps with German, Japanese customers: Logo & Grille lamps, Carpet light gen 2, etc
Well positioned to provide integrated sensor cleaning solutions: First businesses awarded.
Increasing interest in Centricam, RFQ expected in 2020
February 20, 2020
OEMS becoming more interested in brushless motor concept for weight reductionSEGMENT INFORMATION
2019 Comfort &
Driving
Assistance Powertrain Thermal Visibility
(€m) Systems Systems Systems Systems Others Total
Sales:
● segment (excluding Group) 3,877 4,998 4,516 5,923 167 19,477
● intersegment (Group) 28 123 66 91 (308)
EBITDA 594 685 502 660 55 2,496
Research & Development expenditure, net (603) (293) (274) (360) (20) (1,550)
Investments in property, plant & equipment & intangible asset 566 418 460 522 20 1,986
Segment assets 2,940 3,561 2,861 3,124 173 12,659
2018 Comfort &
Driving
Assistance Powertrain Thermal Visibility
(€m) Systems Systems Systems Systems Others Total
Sales:
● segment (excluding Group) 3,741 5,036 4,517 5,699 131 19,124
● intersegment (Group) 25 105 52 84 (266)
EBITDA 528 674 495 642 71 2,410
Research & Development expenditure, net (556) (319) (285) (377) (23) (1,560)
Investments in property, plant & equipment & intangible asset 582 458 454 538 21 2,053
Segment assets 2,683 3,495 2,526 2,838 141 11,683
67 February 20, 2020GLOSSARY
Order intake corresponds to business awarded by automakers during the period to Valeo, and to joint ventures and associates based on Valeo’s share in
net equity, (except Valeo Siemens eAutomotive, for which 100% of orders are taken into account), less any cancellations, based on Valeo’s best reasonable
estimates in terms of volumes, selling prices and project lifespans. Unaudited indicator.
Like for like (or LFL): the currency impact is calculated by multiplying sales for the current period by the exchange rate for the previous period. The Group
structure impact is calculated by (i) eliminating, for the current period, sales of companies acquired during the period, (ii) adding to the previous period full-
year sales of companies acquired in the previous period, and (iii) eliminating, for the current period and for the comparable period, sales of companies sold
during the current or comparable period.
Operating margin including share in net earnings of equity-accounted companies corresponds to operating income before other income and
expenses.
Net attributable income excluding non-recurring items corresponds to net attributable income adjusted for “other income and expenses” net of tax and
non-recurring income and expenses net of tax shown in operating margin including share in net earnings of equity-accounted companies.
ROCE, or return on capital employed, corresponds to operating margin (including share in net earnings of equity-accounted companies) divided by capital
employed (including investments in equity-accounted companies), excluding goodwill.
ROA, or return on assets, corresponds to operating income divided by capital employed (including investments in equity-accounted companies) including
goodwill.
EBITDA corresponds to (i) operating margin before depreciation, amortization and impairment losses (included in the operating margin) and the impact of
government subsidies and grants on non-current assets, and (ii) net dividends from equity-accounted companies.
Free cash flow corresponds to net cash from operating activities (excluding changes in non-recurring sales of receivables and payments for the principal
portion of lease liabilities) after taking into account acquisitions and disposals of property, plant and equipment and intangible assets.
Net cash flow corresponds to free cash flow less (i) cash flows in respect of investing activities, relating to acquisitions and disposals of investments and to
changes in certain items shown in non-current financial assets, (ii) cash flows in respect of financing activities, relating to dividends paid, treasury share
purchases and sales, interest paid and received, and acquisitions of equity interests without a change in control, and (iii) changes in non-recurring sales of
receivables.
Net debt comprises all long-term debt, liabilities associated with put options granted to holders of non-controlling interests, short-term debt and bank
overdrafts, less loans and other long-term financial assets, cash and cash equivalents and the fair value of derivative instruments hedging the foreign
68 currency and interest rate risks associated with these items. February 20, 2020INVESTOR RELATIONS
VALEO
43, rue Bayen
F-75848 Paris Cedex 17
France
Thierry Lacorre
E-mail: valeo.corporateaccess.mailbox@valeo.com
Website: www.valeo.com
CONTACTSSHARE INFORMATION
Share Data
• Bloomberg Ticker FR FP
• Reuters Ticker VLOF.PA
• ISIN Number FR 0013176526
• Shares outstanding as of December 31, 2019 241,036,743
ADR Data
• Ticker/trading symbol VLEEY
• CUSIP Number 919134304
• Exchange OTC
• Ratio (ADR: ord) 1:2
• Depositary Bank J.P. Morgan
• Contact at J.P. Morgan – ADR Jim Reeves
• broker relationship desk +1 212-622-2710
70 February 20, 2020SAFE HARBOR STATEMENT Statements contained in this document, which are not historical fact, constitute “forward-looking statements”. These statements include projections and estimates and their underlying assumptions, statements regarding projects, objectives, intentions and expectations with respect to future financial results, events, operations, services, product development and potential, and statements regarding future performance. Even though Valeo’s Management feels that the forward-looking statements are reasonable as at the date of this document, investors are put on notice that the forward-looking statements are subject to numerous factors, risks and uncertainties that are difficult to predict and generally beyond Valeo’s control, which could cause actual results and events to differ materially from those expressed or projected in the forward-looking statements. Such factors include, among others, the Company’s ability to generate cost savings or manufacturing efficiencies to offset or exceed contractually or competitively required price reductions. The risks and uncertainties to which Valeo is exposed mainly comprise the risks resulting from the investigations currently being carried out by the antitrust authorities as identified in the Registration Document, risks which relate to being a supplier in the automotive industry and to the development of new products and risks due to certain global and regional economic conditions. Also included are environmental and industrial risks as well as risks and uncertainties described or identified in the public documents submitted by Valeo to the French financial markets authority (Autorité des marchés financiers – AMF), including those set out in the “Risk Factors” section of the 2018 Registration Document registered with the AMF on March 29, 2019 (under number D.19-0224). The Company assumes no responsibility for any analyses issued by analysts and any other information prepared by third parties which may be used in this document. Valeo does not intend or assume any obligation to review or to confirm the estimates of analysts or to update any forward-looking statements to reflect events or circumstances which occur subsequent to the date of this document. 71 February 20, 2020
You can also read