VISA POLICY AND CHINESE TRAVEL TO EUROPE - ETC REPORT - European Travel ...
←
→
Page content transcription
If your browser does not render page correctly, please read the page content below

ETC REPORT

VISA POLICY AND CHINESE TRAVEL
TO EUROPE
ION

      Brussels, November 2018
      Copyright © 2018 European Travel Commission

      All rights reserved. The contents of this report may be quoted, provided the source is given accurately and
      clearly. Distribution or reproduction in full is permitted for own or internal use only. While we encourage
      distribution via publicly accessible websites, this should be done via a link to ETC corporate website:
      www.etc-corporate.org

      The designations employed and the presentation of material in this publication do not imply the expression of
      any opinions whatsoever on the part of the Executive Unit of the European Travel Commission.

      Published and printed by the European Travel Commission
      Rue du Marché aux Herbes, 61, 1000 Brussels, Belgium
      Website: www.etc-corporate.org
      Email: info@visiteurope.com

      This document was compiled by: Tourism Economics (an Oxford Economics Company)
      Cover: © leungchopan/Shutterstock.com

      ISBN: 978-92-95107-21-2

      2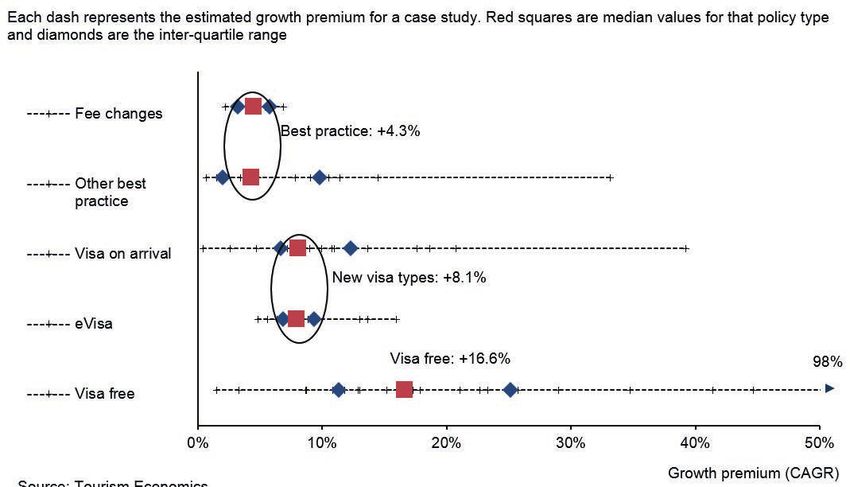
OURISM AND CLIMATE CHANGE MITIGATION
MBRACING THE PARIS AGREEMENT

     TABLE OF CONTENTS

     1. Background ................................................................................................................................................. 4

        1.1 The importance of visa facilitation .......................................................................................................... 4

        1.2 Benefits of visa facilitation ...................................................................................................................... 4

        1.3 Challenges facing facilitation .................................................................................................................. 5

     2. Case studies & methodology ..................................................................................................................... 5

        2.1 Case studies .......................................................................................................................................... 5

        2.2 Policy impact calculations ...................................................................................................................... 8

     3. Visa policy for China ................................................................................................................................... 8

        3.1 European visa constraints ..................................................................................................................... 8

        3.2 China: a constrained source market....................................................................................................... 9

        3.3 Alternative scenarios .............................................................................................................................. 9

     4. Annex ......................................................................................................................................................... 15

        Comparison to prior analysis ....................................................................................................................... 15

                                                                                                                                                                       3
1. BACKGROUND

1.1 The importance of visa facilitation
International tourism is an important driver of European economies in terms of its size and growth potential.
International tourism arrivals in European countries accounted for over half of arrivals worldwide in 2017, and
the region includes seven of the World’s top ten destinations ranked by visitor volume. Travel to the region has
grown at an average rate of around 5% in each year since 2010.

However, travel restrictions limit the growth potential of international travel, especially from key emerging
markets which are taking a growing share of global tourism demand and will continue to rise in prominence.
According to UNWTO research 61% of the global population would have required a visa for international travel
in 2015. The same research also suggests that European destinations are less open than the global average.
European nations, as defined by UNWTO, required 74% of the global population to obtain a visa for travel in
2015, and the proportion for EU 28 was even higher at 77%.

Liberalisation of travel has been observed to generate substantial increases in travel spending and job creation.
Benefits have been identified in previous research published by UNWTO and WTTC (carried out in conjunction
with Tourism Economics (TE)) for G20 countries as well as for APEC and ASEAN countries.

Other studies have also identified visa policy benefits including the analysis carried out by TE on behalf of the
Organisation of Islamic Countries as well as the European Commission study focussing on the Schengen area.
All studies noted a clear benefit in terms of travel demand and economic impact from visa facilitation measures.

Similar methodology is followed in this report to identify the potential benefits of visa facilitation policy for
European nations. The main benefits and types of visa facilitation policy are described below. The purpose of
this report is to quantify the potential impacts of such visa facilitation should it be aimed at Chinese travellers.

1.2 Benefits of visa facilitation
Numerous case studies clearly demonstrate the benefits to travel demand from visa facilitation policies. Visas
are viewed as a formal constraint by travellers, involving additional trip costs in terms of either monetary cost
or indirect costs in the form of time spent waiting or completing complex application procedures. If these costs
exceed a threshold, the process can act as a deterrent to potential travellers to that destination, or a deterrent
to a trip taking place altogether.

Visa facilitation policy has clear benefits to destinations of promoting ease of travel and raising visitor volumes.
The relative attractiveness of a destination is raised allowing greater competition in global travel markets
and gain of market share as well as potentially raising total international travel demand for source markets,
depending on the existing level of constraints. Greater visitor volumes result in higher spending within a
destination and subsequent impacts on GDP and employment.

These findings are not new; 87 delegates at the 1963 United Nations Conference on International Travel &
Tourism in Rome agreed that “Governments should extend to the maximum number of countries the practice of
abolishing, through bilateral agreements or by unilateral decision, the requirement of entry visas for temporary
visitors.”

However, sovereign states retain the right to control access of foreign nationals, with no international agreement
to open borders beyond granting the right to citizens to exit and re-enter their home countries.

4
1.3 Challenges facing facilitation
It has to be acknowledged that visas do serve vital roles for states beyond tourism, as listed below.
Any facilitation of visa policy has to be balanced against these valid functions:
• Security is often listed at the top priority in establishing or retaining a visa requirement to limit flows of
undesirable visitors.
• Immigration can also be controlled by visas to protect national labour force amidst concerns that visitors will
overstay to seek work.
• Limitations on length of stay and activities undertaken by visitors can be imposed through visas.
• Revenue generation is also a function of visas. There is often substantial offset from the costs of administering
visa programs, but these are typically dwarfed by revenue streams.
• Reciprocity of policy often occurs as countries feel compelled to impose a visa on another because that
country requires a visa for travel. Visas are also used as political tools to retaliate against other policies or
actions taken by other countries; visas are also sometimes relaxed in support of other policies.
• Capacity limits can be managed by the imposition of visas to limit demand in order to protect local industry
or the environment.
2.CASE STUDIES & METHODOLOGY
2.1 Case studies
Past case studies of visa facilitation give a guide to the likely impact of future similar policy changes and form
the basis of the economic model in this study. Grouping case studies by type of visa policy change does not
give a definitive figure for the impact of that change but suggests a likely range of benefits which could be
realised by European destinations with more facilitative policy.
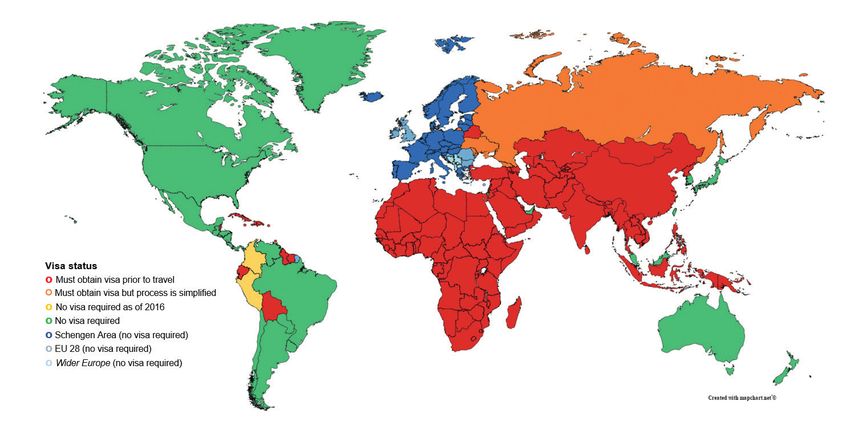
Case study impacts by policy type
Source: Tourism Economics
5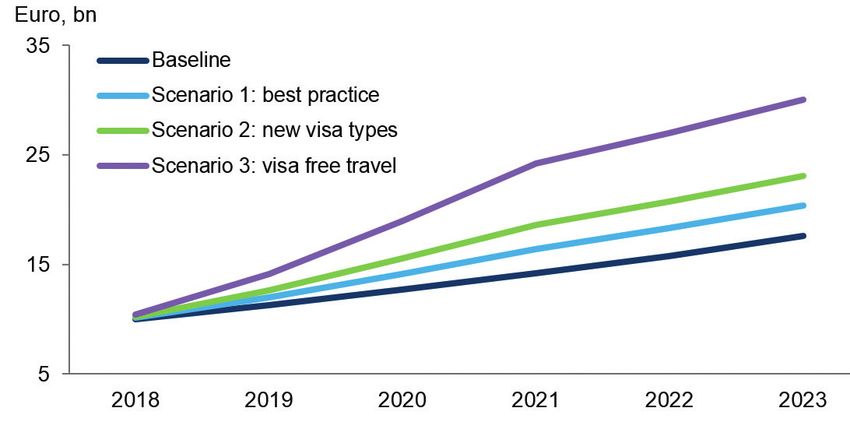
Each of the case studies and bilateral flows were identified as belonging to groups of similar policy changes,
with similar attributes and impacts. These case studies also included some more restrictive policy changes
whereby lower travel to destinations has been observed in response to the increased barriers to entry. These
negative cases are still instructive of the impact of visa policy on travel demand and the inverse impact is
taken. For example, the inverse of higher visa fees is grouped with the impact of reduced visa application fees
to understand an overall effect of cost changes.

Three broad groups have been defined according to comparable observed policy impacts. These three
aggregated average policy impacts form the basis of the scenario analysis to determine different expected
levels of policy effect across European destinations from the constrained source markets. This analysis
will assess the potential benefits to European destinations of changing visa policies towards China.

2.1.1 Best practice
28 case studies of bilateral flows helped gauge the impacts associated with adhering to “best practice”, which
includes reducing fees payable upon application, a visa’s validity period, and other changes to application
procedures. These included Oman reducing the fee for its visa and Indonesia increasing the validity of its visa
from 7 days to 30 days.

More restrictive practices have also been included in the analysis, encompassing a wider range of observed
impacts. However, on average these negative impacts have the same magnitude of impact as facilitative policy
changes. The median impact of these restrictive policies on subsequent travel was an annual average fall of 4.5%
compared with annual average growth premium of 3.5% for the facilitative measures. Taking an average of all
inverted negative policy impacts and positive impacts gives greater confidence that the true average policy effect
is captured due to the higher sample size. The wider range of impacts for these negative impacts is skewed by
accompanying negative sentiment between some countries, which can be the original reason for the imposition
of the more restrictive visa process. For example, the outlier in this group is the estimated 33% growth premium
calculated as the inverse of the impact for travel between Syria and Egypt in recent years.

By taking the median growth premium and also focussing on the inter-quartile range for groups of impacts
these outliers can be excluded from calculation of expected growth premiums for European destinations as
the basis of scenario analysis. The median impact for fee changes is an average 4.5% growth premium in
subsequent years. The other best practice policies to facilitate current visa practices had a median growth
premium of 4.3%. The overwhelming majority of cases suggest a growth premium of less than 10% per annum
following policy changes.

As in previous analysis by TE, a proportion of the remaining volatility in observed growth impacts is due to the
relative attractiveness of the destination and the relative response in leisure travel to the reduction of costs
and barriers to entry.

6
2.1.2 New visa types
New visa types account for a total of 57 travel flows in case studies, including 24 cases of electronic visas
(eVisa) and 33 cases of visa on arrival. The latter includes both the introduction of new visa on arrival for
countries and also the inverted negative impacts of the cancelation of some previous policies. Key case
studies for analysis were Turkey and Australia which have successfully opened borders to a wide range of
source markets through the use of new visa types.

Initial analysis of the growth premiums following changes in visa type showed a wide range of impacts. Even
excluding the obvious outliers, the observed impacts following imposition of both visa on arrival and eVisa was
in a wider range than for the best practice facilitation. On average, observed growth premiums for new visa
types were comparable to that for other policies but with some higher observed impacts.

Closer analysis of each case study for new visa types showed a correlation between the growth premium and
policy before the new visa was introduced. The higher observed impacts were for cases where there was no
notable visa facilitation before the new visa was introduced. In a majority of instances, some previous policy
changes and visa facilitation measures had taken place before the introduction of the visa on arrival or eVisa.
Positive benefits had already been realised from the earlier policy change and the observed impact relative to
counterfactual growth following the new visa introduction is an incremental change.

A total growth premium for the new visa types, relative to a baseline of no facilitation, was derived as the sum
of the observed premium plus the median “best practice” impact where such changes had already occurred.

The estimated average benefit to destinations is very similar for the imposition of visa on arrival and eVisa. Annual
average growth is estimated to be 8% higher per annum in the years following imposition of one of these new
visa types, relative to a baseline of no facilitation. Excluding outliers, there is some observed range of impacts,
but the lower quartile of observed impacts is towards the top end of the impacts seen for best practice facilitation.

2.1.3 Visa free travel
Moving to visa-free travel provides the largest growth premiums in case studies, with a wide range of impacts.
Similar to the analysis of new visa types, some of the difference across examples can be explained by the
visa policy in place before this change. In these cases, to estimate the growth premium over a baseline of no
facilitation we calculate the cumulative impact by adding on the median estimated impact for prevailing policy.

Of the 35 observations of visa-free travel impact in our analysis, around half had some active visa facilitation
policies before fully waiving visa requirements, explaining some of the low responses to policy changes. Within
this, we include the example of bilateral travel between Nigeria and South Africa which was subject to a visa
on arrival until 2013, after which travel became fully visa-free. These bilateral flows accounted for some of the
lowest growth premiums in initial analysis before adding other cumulative effects.

Of course, visa waiver is not feasible in all cases for political or security reasons, but this is presented here as
an upside example of the positive benefits of visa facilitation policies.

                                                                                                                   7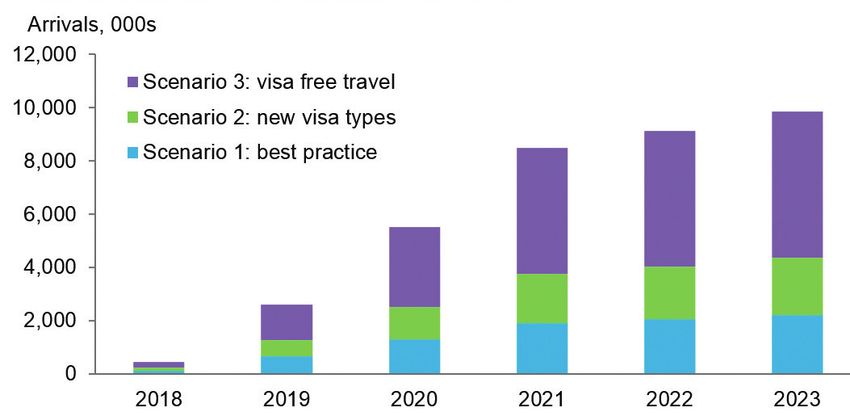
2.2 Policy impact calculations
The analysis uses baseline forecasts from Tourism Economics’ global tourism model for travel from China to
each country within the EU. Data within this model are taken from UNWTO and national data sources, while
forecasts are generated according to estimated relationships with key identified economic demand drivers and
Oxford Economics’ global macroeconomic model.

Alternative scenarios are generated by applying the relevant growth premiums to travel flows from China to
each country within the EU to quantify the potential uplift from visa policy changes. Growth premiums vary by
destination according to the relative attractiveness of that destination consistent with prior TE modelling of visa
impacts on behalf of WTTC and UNWTO. Hence the growth premium for each destination is within the range
of impacts identified by visa type rather than the exact median value.

Once additional visits from China have been identified under different visa policy scenarios the typical average
length of stay and average spending is applied within the model to derive total spending impacts. Further
multipliers are then applied to derive GDP and employment benefits, including direct and total impacts
(including indirect and induced).

Scenarios are run under the assumption that policy change occurs during the remainder of 2018, with the total
impacts estimated to accrue over the years to 2023. Some minimal impact is estimated for late 2018, with
stronger policy driven effects accumulating over the next 5 years.

3.VISA POLICY FOR CHINA

3.1 European visa constraints
Within this study Tourism Economics consider the impacts on EU 27 destinations only (excluding the UK).
In the original 2015 study three different European geographies were considered, with impacts estimated

8
for each of these geographies. These geographies were Schengen area, EU 28, and Wider Europe which
consisted Schengen area and EU 28 destinations, plus an additional five countries.

Analysis in this report will focus on travel to EU 27 destinations from China only. Previous analysis considered
travel from ten key focus markets, including China. This approach recognises the important role of visas in
controlling arrivals but also demonstrates the clear benefits that can be realised from a targeted relaxation of
visa policy.

3.2 China: a constrained source market
Following the Schengen Agreement (1985), signatories began a process of abolishing internal border controls
and harmonising visa policy. Citizens of many countries are free to visit the Schengen area without a visa, such
as citizens of the EU, the United States, Brazil, and the United Arab Emirates. Around 40 countries in total are
exempt from a visa requirement to enter Schengen area countries. If a visa is granted it allows travel within the
zone, to multiple countries during the same trip. Visas allowing multiple entries within a time period are also
available. The Schengen area receives the majority of arrivals to the EU.

To lodge a successful application for a Schengen visa, multiple criteria must be met with supporting
documentation provided, with a processing fee also often applicable.

China is one of the many long-haul source markets for which visa-free access to the EU, including the Schengen
area, is not available.

Chinese travel demand to Europe has been strong in recent years, and the outlook equally so. Yet, China is
subjected to some of the most stringent visa requirements imposed by European destinations. China is also
the largest of the visa constrained markets.

European destinations are host to less than half of Chinese long-haul travel; a proportion which is largely
unchanged from ten years ago. This is despite some rapid growth in Chinese travel demand over the same
period.

There remains a large opportunity for even faster growth in the coming years. The growing size of the Chinese
market means that more facilitative visa policy should generate an even larger uplift in visitor volumes and
spending than in the prior research. The magnitude of this uplift, however, will depend on the specific policy
approach adopted.

3.3 Alternative scenarios
It is clear from numerous cases studies around the world that changes in visa policy are followed by a period of
clear gains in travel demand, higher than growth on comparable flows. It is also clear that higher travel demand
can boost economic activity and job creation within the wider economy.

A more relaxed approach with regards China will undoubtedly generate a significant amount of additional
tourism demand for European destinations from one of the world's most lucrative source markets. Alternative
scenarios have been generated to quantify the potential increase via more lenient visa policy. The positive
impact on GDP and job creation, within the tourism sector specifically and the wider economy more generally,
would likely be considerable.

Any visa liberalisation measures need to be balanced against security and immigration concerns. But large
benefits can be realised for relatively minor changes including targeted policy changes for China and with
minimal effect on the other key functions that visas serve.
                                                                                                               9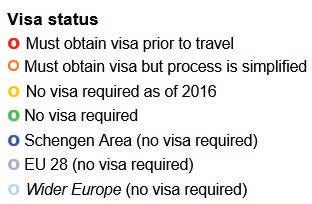
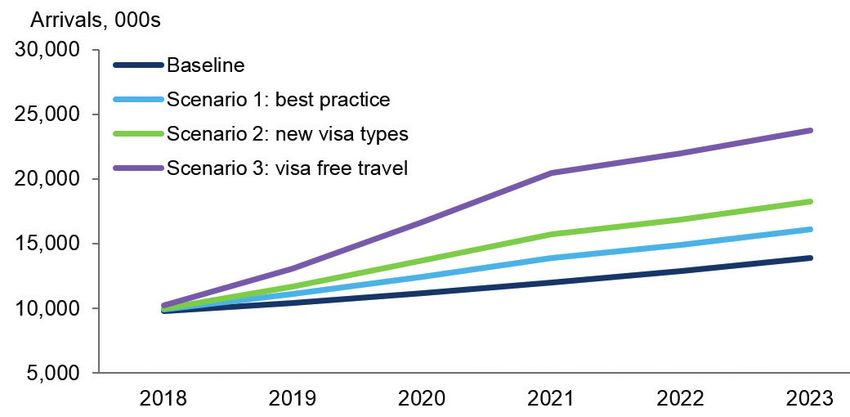
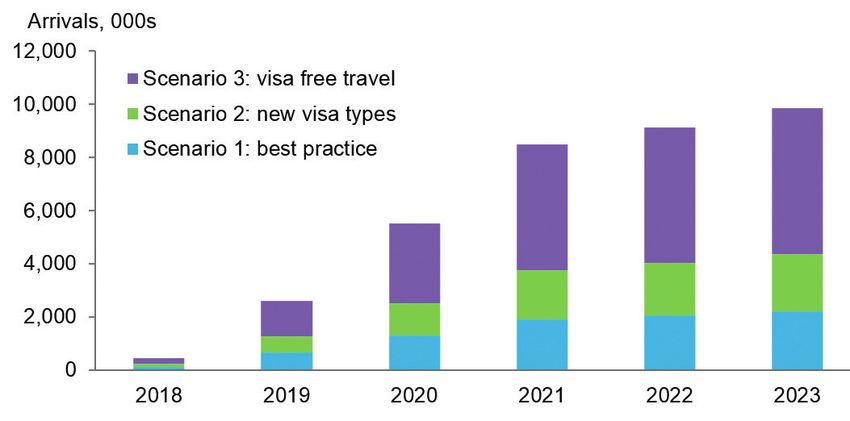
Arrivals from China under different scenarios

                                                                                                   +71%

                                                                                                   +31%

                                                                                                           +17%

Source: Tourism Economics

In this analysis Tourism Economics has assessed the potential uplift for the EU 27 (excluding UK) under three
different policy approaches, consistent with prior analysis:

   • Adoption of industry best practice
   • Improvements in available visa types
   • Full visa liberalisation

In the baseline forecast, TE anticipate average annual arrivals growth from China to EU27 to be 7.4% over the
2018-23 period compared to 18.4% in the full visa liberalisation scenario. Arrivals from China currently account
for less than 2% of all visits to the EU and in all scenarios this share is expected to increase. In the full visa
liberalisation scenario this share is expected to reach 3.9% by 2023 compared to 2.3% in the baseline outlook.

     China’s share of EU arrivals under different scenarios

10                                                                                           Source: Tourism Economics
The analysis suggests that adoption of industry best practice (e.g., reduced fees, increased validity, less
paperwork) would yield 2.2mn more visitor arrivals from China in 2023 compared to the baseline; 16% uplift for
that market. This is equivalent to 0.4% uplift in total EU arrivals.
Improvements in available visa types (e.g., visa on arrival or eVisa) would likely result in Chinese arrivals to
Europe being 17% higher in 2023 than if there was no policy change, equating to 4.4mn additional arrivals in
2023 and equivalent to 0.7% increase in total arrivals.
Additional arrivals over baseline from China
Source: Tourism Economics
Full visa liberalisation would likely yield 71% increase in Chinese arrivals, equivalent to 1.6% increase in total
EU arrivals in 2023 relative to a baseline of no visa policy changes.
11Inbound revenue from China under different scenarios
Source: Tourism Economics
The uplift on inbound tourism revenue would follow a similar pattern to the arrivals impacts, but some higher
percentage increases are estimated. This is consistent with the relatively high length of stay and spend per trip
for Chinese visitors. The percentage uplift on tourism sector GDP and employment will be lower than that for
international arrivals and revenue due to the size of the domestic tourism markets.
Additional inbound revenue over baseline from China
Source: Tourism Economics
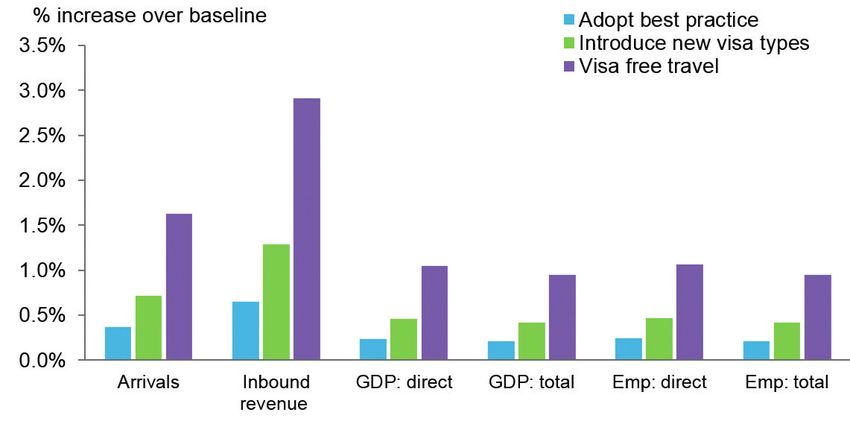
12Under the best practice scenario, inbound revenue would likely be 0.7% or €2.8bn higher than the baseline
outlook for 2023. As a result, Travel & Tourism’s (T&T) direct contribution to GDP & employment would be 0.2%
higher than the baseline outlook. This would equate to 25,000 additional jobs within the wider economy once
indirect effects are taken into account.
Under the scenario of new visa types, inbound revenue would be 1.3% higher than baseline; an additional
€5.5bn per annum by 2023. T&T's contribution to GDP and employment would be 0.4% higher than under the
baseline outlook, representing an additional 105,000 jobs within the economy in 2023.
Full visa liberalisation would generate additional inbound spending of €12.5bn of spend per annum, 2.9%
higher than the baseline by 2023. T&T's contribution to Europe's GDP would be 1.0% higher with a total
employment uplift of 0.9%, representing 237,000 additional jobs, including 120,000 directly within the T&T
sector.
Scenario impacts over baseline from China in 2023
Source: Tourism Economics
13Baseline outlook for EU27 and scenario impacts over baseline
2018 2019 2020 2021 2022 2023
Baseline
Arrivals (000s) 524,162 538,584 552,922 568,583 586,242 606,867
Inbound revenue (euro, bn) 324.8 343.4 363.2 384.0 404.7 427.2
GDP direct (euro, bn) 452.3 472.4 492.3 512.7 533.3 554.6
GDP total (euro, bn) 1,201.7 1,252.3 1,303.1 1,354.7 1,405.6 1,458.7
Employment direct (000s) 10,382 10,520 10,696 10,880 11,049 11,234
Employment total (000s) 23,700 23,937 24,240 24,552 24,797 25,118
Scenario 1: best practice
Arrivals (000s) 120 660 1,301 1,899 2,043 2,210
Inbound revenue (euro, bn) 0.1 0.7 1.5 2.2 2.5 2.8
GDP direct (euro, bn) 0.1 0.3 0.7 1.1 1.2 1.3
GDP total (euro, bn) 0.1 0.8 1.7 2.5 2.8 3.1
Employment direct (000s) 1 8 16 23 25 27
Employment total (000s) 3 16 31 46 49 53
Scenario 2: new visa types
Arrivals (000s) 223 1,250 2,519 3,737 4,021 4,351
Inbound revenue (euro, bn) 0.2 1.4 2.9 4.4 4.9 5.5
GDP direct (euro, bn) 0.1 0.6 1.3 2.1 2.3 2.6
GDP total (euro, bn) 0.3 1.5 3.2 5.0 5.5 6.1
Employment direct (000s) 3 15 30 45 49 53
Employment total (000s) 5 30 60 90 97 105
Scenario 3: visa free travel
Arrivals (000s) 445 2,605 5,508 8,478 9,121 9,870
Inbound revenue (euro, bn) 0.5 2.8 6.3 10.0 11.2 12.5
GDP direct (euro, bn) 0.2 1.3 2.9 4.7 5.2 5.8
GDP total (euro, bn) 0.5 3.2 7.1 11.3 12.5 13.9
Employment direct (000s) 5 31 66 102 111 120
Employment total (000s) 10 62 132 204 220 237
Source: Tourism Economics
144. ANNEX
Comparison to prior analysis
Chinese travel to both Europe and
other global destinations exceeded Additional arrivals over baseline from China
prior expectations in recent years. after 5 years
In prior analysis growth to Europe
over 2015-17 was expected to
average 4.6% per annum, however,
latest available data suggest growth
averaged 8.9% per annum. Some
non-visa travel facilitation, such as
increased connectivity, as well as a
greater appetite for foreign travel paved
the way for this growth. This also came
despite some disruption from terrorism
over the period proving the resilience
of the sector and demand for European
destinations over the longer-run.
Source: Tourism Economics
In the full visa liberalisation scenario, the expected impact on arrivals, inbound revenue, GDP, and employment
relative to baseline impacts are higher than in the prior analysis in the end year of respective time periods. This
is due to the increasing importance of China as a source market and highlights the increasing cost of policy
inaction.
The chart (above right) compares the estimated uplift in arrivals after 5 years in this analysis (impact by 2023)
and in the prior analysis (impact by 2020). Comparison is between the impact on the EU28 in the prior analysis
and on the EU27 (excluding UK) in the latest analysis. The higher estimated arrivals impact in the latest
analysis, even with the exclusion of the UK, are due the growing importance of the Chinese market.
There uplift for spending is less evident
Additional inbound revenue over baseline from China due to the exclusion of the UK in the
after 5 years comparison. Partly due to the fact that
the UK is outside of the Schengen
Area, Chinese travel to the UK involves
a relatively high average length of stay
and high spending per trip. Hence,
the exclusion of the UK from the EU
aggregation has a greater impact on
revenue than on visits.
On a more comparable basis, the
potential uplift in revenue from Chinese
travellers is now higher for European
destinations due to the growing size of
the market.
Source: Tourism Economics
15TIGATION
Rue du Marché aux Herbes 61 - 1000 Brussels – Belgium
ION Tel +32 2 548 90 00 Fax +32 2 514 18 43
info@visiteurope.com
www.visiteurope.com
www.etc-corporate.orgYou can also read