NOVEL CORONAVIRUS 2019-NCOV: EARLY ESTIMATION OF EPIDEMIOLOGICAL PARAMETERS AND EPIDEMIC PREDICTIONS - MEDRXIV
←
→
Page content transcription
If your browser does not render page correctly, please read the page content below
medRxiv preprint doi: https://doi.org/10.1101/2020.01.23.20018549. The copyright holder for this preprint (which was not peer-reviewed)
 is the author/funder, who has granted medRxiv a license to display the preprint in perpetuity.
 It is made available under a CC-BY-NC-ND 4.0 International license .

 Read JM et al. Novel coronavirus 2019-nCoV: early estimation of epidemiological parameters and epidemic predictions

 Novel coronavirus 2019-nCoV: early estimation of epidemiological parameters and
 epidemic predictions

 Jonathan M. Read1, Jessica R.E. Bridgen1, Derek A.T. Cummings2, Antonia Ho3, Chris P.
 Jewell1

 Affiliations:
 1. Centre for Health Informatics, Computing and Statistics, Lancaster Medical School,
 Lancaster University, Lancaster, United Kingdom.
 2. Department of Biology and Emerging Pathogens Institute, University of Florida,
 Gainesville, United States of America.
 3. Medical Research Council-University of Glasgow Centre for Virus Research, Glasgow,
 United Kingdom.

 Correspondence: jonathan.read@lancaster.ac.uk

 Key findings
 ● We estimate the basic reproduction number of the infection ( 0 ) to be significantly
 greater than one. We estimate it to be between 3.6 and 4.0, indicating that 72-75% of
 transmissions must be prevented by control measures for infections to stop
 increasing.
 ● We estimate that only 5.1% (95%CI, 4.8–5.5) of infections in Wuhan are identified,
 indicating a large number of infections in the community, and also reflecting the
 difficulty in detecting cases of this new disease. Surveillance for this novel pathogen
 has been launched very quickly by public health authorities in China, allowing for
 rapid assessment of the speed of increase of cases in Wuhan and other areas.
 ● If no change in control or transmission happens, then we expect further outbreaks to
 occur in other Chinese cities, and that infections will continue to be exported to
 international destinations at an increasing rate. In 14 days’ time (4 February 2020),
 our model predicts the number of infected people in Wuhan to be greater than 190
 thousand (prediction interval, 132,751 to 273,649). We predict the cities with the
 largest outbreaks elsewhere in China to be Shanghai, Beijing, Guangzhou,
 Chongqing and Chengdu. We also predict that by 4 Feb 2020, the countries or
 special administrative regions at greatest risk of importing infections through air travel
 are Thailand, Japan, Taiwan, Hong Kong, and South Korea.
 ● Our model suggests that travel restrictions from and to Wuhan city are unlikely to be
 effective in halting transmission across China; with a 99% effective reduction in
 travel, the size of the epidemic outside of Wuhan may only be reduced by 24.9% on
 4 February.
 ● There are important caveats to the reliability of our model predictions, based on the
 assumptions underpinning the model as well as the data used to fit the model. These
 should be considered when interpreting our findings.

 Abstract

 In December 2019, a novel coronavirus (2019-nCoV) is thought to have emerged into the
 human population in Wuhan, China. The number of identified cases in Wuhan has increased

 1
medRxiv preprint doi: https://doi.org/10.1101/2020.01.23.20018549. The copyright holder for this preprint (which was not peer-reviewed)
 is the author/funder, who has granted medRxiv a license to display the preprint in perpetuity.
 It is made available under a CC-BY-NC-ND 4.0 International license .

 Read JM et al. Novel coronavirus 2019-nCoV: early estimation of epidemiological parameters and epidemic predictions

 rapidly since, and cases have been identified in other Chinese cities and other countries (as
 of 23 January 2020).

 We fitted a transmission model to reported case information up to 21 January to estimate
 key epidemiological measures, and to predict the possible course of the epidemic, as the
 potential impact of travel restrictions into and from Wuhan.

 We estimate the basic reproduction number of the infection ( 0 ) to be 3.8 (95% confidence
 interval, 3.6 and 4.0), indicating that 72-75% of transmissions must be prevented by control
 measures for infections to stop increasing. We estimate that only 5.1% (95%CI, 4.8–5.5) of
 infections in Wuhan are identified, and by 21 January a total of 11,341 people (prediction
 interval, 9,217–14,245) had been infected in Wuhan since the start of the year. Should the
 epidemic continue unabated in Wuhan, we predict the epidemic in Wuhan will be
 substantially larger by 4 February (191,529 infections; prediction interval, 132,751–273,649),
 infection will be established in other Chinese cities, and importations to other countries will
 be more frequent. Our model suggests that travel restrictions from and to Wuhan city are
 unlikely to be effective in halting transmission across China; with a 99% effective reduction in
 travel, the size of the epidemic outside of Wuhan may only be reduced by 24.9% on 4
 February.

 Our findings are critically dependent on the assumptions underpinning our model, and the
 timing and reporting of confirmed cases, and there is considerable uncertainty associated
 with the outbreak at this early stage. With these caveats in mind, our work suggests that a
 basic reproductive number for this 2019-nCoV outbreak is higher compared to other
 emergent coronaviruses, suggesting that containment or control of this pathogen may be
 substantially more difficult.

 Background and current epidemic situation

 On 31 December 2019, Chinese authorities alerted the World Health Organization (WHO) to
 an outbreak of pneumonia of unknown aetiology in Wuhan City, Hubei Province, China. A
 novel strain of coronavirus (2019-nCoV) was subsequently isolated from a patient on 7
 January 2020 (Tan et al. 2020). Most cases from the initial cluster had epidemiological links
 with a live animal market (Huanan South China Seafood Market), suggesting a possible
 zoonotic origin (World Health Organization 2020a). However, the definitive source of the
 virus is unknown. Infections in family clusters as well as in healthcare workers confirm the
 occurrence of human-to-human transmission, though the extent of this mode of transmission
 is unclear. On 21 January 2020, the WHO suggested there was possible sustained human-
 to-human transmission (World Health Organization 2020b).

 As of 22 January 2020, over 600 cases have been confirmed, of which 444 are from Hubei
 province (New York Times 2020a). Cases with travel history to Wuhan have also been
 reported in other Chinese provinces, including large cities such as Beijing, Shanghai and
 Shenzhen, as well as other countries, including Thailand (n=4), Japan (n=1), South Korea
 (n=1), Taiwan (n=1), Hong Kong (n=2), Macau (n=2) and the United States (n=1).
 Presenting symptoms of cases reported include fever, cough, and shortness of breath
 (World Health Organization 2020c). Pneumonia, severe acute respiratory syndrome and

 2
medRxiv preprint doi: https://doi.org/10.1101/2020.01.23.20018549. The copyright holder for this preprint (which was not peer-reviewed)
 is the author/funder, who has granted medRxiv a license to display the preprint in perpetuity.
 It is made available under a CC-BY-NC-ND 4.0 International license .

 Read JM et al. Novel coronavirus 2019-nCoV: early estimation of epidemiological parameters and epidemic predictions

 kidney failure have been reported in severe cases. Seventeen deaths have been reported
 from Wuhan, the majority were elderly or had underlying health conditions (Hong Kong
 Centre for Health Protection 2020).

 Current clinical and epidemiological data are insufficient to understand the full extent of the
 transmission potential of the epidemic. This comes at a time when there is a substantial
 increase in travel volume within as well as in and out of China around the Lunar New Year
 on 25 January 2019. Over 3 billion passenger journeys were predicted for the period
 between 10 January and 18 February (CGTN 2020), which could significantly increase the
 spread of the virus.

 Domestic and international connectivity of Wuhan

 Wuhan is a city of more than 11 million residents and is connected to other cities in China
 via high-speed railway and frequent commercial airline flights. There were 670,417
 passenger bookings departing Wuhan made during January 2017, the top destinations being
 Shanghai (53,214 bookings), Beijing (51,066 bookings) and Kunming (40,120 bookings)
 (OAG 2015); Figure 1. While the majority of air travel departing Wuhan is domestic (87.2%
 of bookings, Jan 2017), Wuhan is connected internationally through both direct and indirect
 flights (Bogoch et al. 2020).

 Transmission model

 We fitted a deterministic SEIR metapopulation transmission model of infection within and
 between major Chinese cities to confirmed cases of 2019-nCoV in Chinese cities and cases
 reported in other countries (see Methods Supplement). We modelled the period from 1
 January 2020 when local authorities closed the wet market implicated as the zoonotic source
 of human infection (World Health Organization 2020a). We only considered human-to-
 human transmission in our model, and made the assumption that following the closure of the
 market, no further zoonotic infection contributed to the epidemic dynamics. Coupling
 between cities followed daily-adjusted rates of travel estimated from monthly-aggregated full
 itinerary passenger booking data for January 2017, accessed from OAG Traffic Analyser
 database (OAG 2015), assuming that travellers are drawn randomly from the origin
 population. We estimated the transmission rate and the recovery rate (the inverse of the
 infectious period). We assumed that the incubation period was 4 days, based on an estimate
 for SARS, a related coronavirus (Lessler et al. 2009). We also estimated the ascertainment
 rate within Wuhan, and the initial number of human infections present in Wuhan when the
 market was closed. Cases in Chinese cities and other countries reported as of 21 January
 2020 were used for fitting. Fitting was achieved by predicting the number of infections in all
 Chinese cities and other countries having onset between 1 and 21 January 2020, and
 maximizing the likelihood using the optim function in the R statistical language (R Core
 Team 2019).

 Epidemiological parameter estimates

 We estimated the transmission rate within Wuhan, , to be 1.07 d-1 (95%CI, 1.06–1.09),
 while we found the infectious period to be 3.6 days (95%CI, 3.6–3.6). We calculated the
 basic reproduction number, 0 , of the infection to be 3.8 (95%CI, 3.6–4.0), higher than the

 3
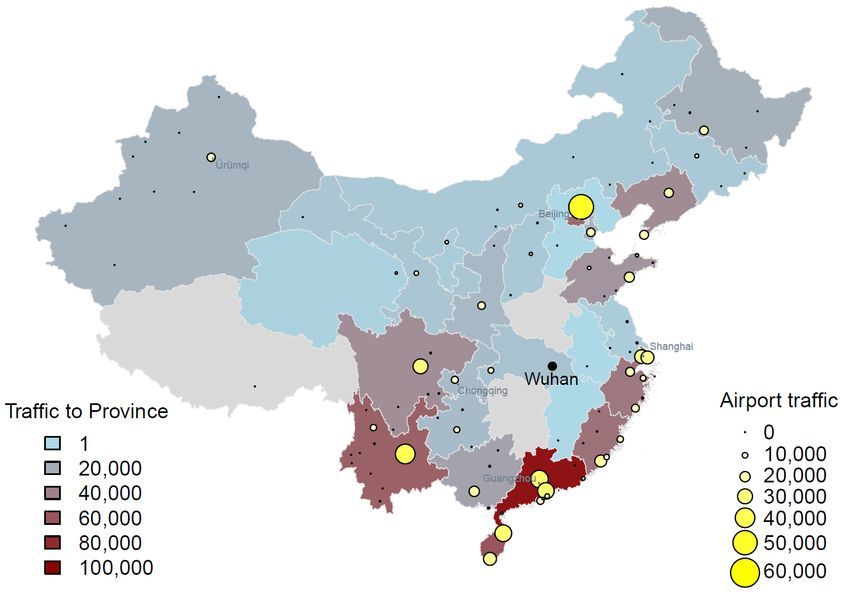
medRxiv preprint doi: https://doi.org/10.1101/2020.01.23.20018549. The copyright holder for this preprint (which was not peer-reviewed)
 is the author/funder, who has granted medRxiv a license to display the preprint in perpetuity.
 It is made available under a CC-BY-NC-ND 4.0 International license .

 Read JM et al. Novel coronavirus 2019-nCoV: early estimation of epidemiological parameters and epidemic predictions

 average of SARS estimated from outbreaks during the 2003 epidemic (World Health
 Organization 2003; Lipsitch et al. 2003). This estimate of 0 is significantly greater than 1, the
 epidemic threshold, providing evidence that sustained human-to-human transmission is
 occurring in China, and further suggests that a concerted effort will be required to control the
 outbreak.

 We estimated that the ascertainment rate in Wuhan is 5.1% (95%CI, 4.8–5.5), reflecting the
 difficulty in identifying cases of a novel pathogen. Given the generally good accessibility to
 healthcare in China, this suggests that the majority of infections may be mild and
 insufficiently serious for individuals to seek treatment. However, it is worth noting that a
 number of identified cases have died (Centre for Disease Control and Prevention 2020) and
 that the true case fatality rate has yet to be estimated accurately. We also estimated the size
 of the epidemic in Wuhan at the time of the market closure to be 24 individuals (95%CI, 22–
 25). Our estimates of epidemiological parameters are sensitive to our assumption regarding
 the length of the incubation period; see Figure 2.

 Epidemic forecasts

 Using our parameterised transmission model, we simulated the impact of an ongoing
 outbreak in Wuhan to seed infections and outbreaks in other cities of China, and to generate
 infection in travellers to other countries, through airline travel originating in China. We stress
 that these projections make strong assumptions: that no control interventions are instigated;
 that the key epidemiological variables driving epidemic dynamics remain constant; that travel
 behaviour within China and to the rest of the world continues as per our mobility estimates;
 finally, we only consider travel by air, and do not include land transportation, particularly via
 trains.

 We estimate that on 21 January 2020, in Wuhan there were 3,493 currently infected
 individuals (prediction interval, 3,050–4,017), and that a total of 11,341 people (prediction
 interval, 9,217–14,245) had been infected since the start of the year. We also estimate that
 there had been 115 infections (prediction interval, 102–131) in other locations of China since
 the start of the year. For comparative purposes, we estimate the number of people infected
 in Wuhan from 1 January to 18 January was 4,764 (prediction interval, 3,969–5,817); this is
 similar to other published estimates (Imai et al. 2020) and highlights the estimated rapid
 growth of the epidemic.

 Should the epidemic continue unabated in Wuhan, our model predicts that in 14 days’ time
 (4 Feb 2020) the epidemic in Wuhan will be substantially larger (191,529 infections;
 prediction interval, 132,751–273,649); see Figure 3A and Table 1. Infected travellers to other
 Chinese cities will initiate outbreaks in those cities, and that outbreaks will be ongoing in a
 number of cities, the largest of which will be in Shanghai, Beijing, Guangzhou, Chongqing
 and Chengdu (Figure 3B and Table 1). By 4 February, there will be an elevated risk of
 importations into other countries, most notably to Thailand (average of 15.0 imports d-1),
 Japan (7.8), Taiwan (6.3), Hong Kong (5.8); South Korea (5.5), USA (4.5), Malaysia (4.1),
 Singapore (3.2), Australia (2.9) and Vietnam (2.7); see Figure 3C.

 Effectiveness of travel restrictions from/to Wuhan

 4
medRxiv preprint doi: https://doi.org/10.1101/2020.01.23.20018549. The copyright holder for this preprint (which was not peer-reviewed)
 is the author/funder, who has granted medRxiv a license to display the preprint in perpetuity.
 It is made available under a CC-BY-NC-ND 4.0 International license .

 Read JM et al. Novel coronavirus 2019-nCoV: early estimation of epidemiological parameters and epidemic predictions

 From 23 January 2020, Chinese authorities will restrict travel into and from Wuhan by
 restricting air, rail and road access (New York Times 2020b), a public health measure
 unprecedented in scale. We explored the potential impact of a reduction in travel from and to
 Wuhan, by reducing the appropriate airline traffic by 50%, 80%, 90%, 95% and 99%. Our
 model predicts that these reductions in travel results in 12.6%, 20.1%, 22.6%, 23.9% and
 24.9% reduction in infections, respectively, elsewhere in China by 4 February. Our prediction
 is In line with other modelling studies of travel restrictions: reducing travel only serves to
 delay the epidemic reaching other locations, rather than suppressing the spread entirely
 (Figure 4). It is important to note that as our model only considered air travel, we do not
 consider the potential impact of travel restrictions relating to land transportation.

 Comparison of transmissibility with SARS and MERS

 Our estimates of the reproductive number for this novel coronavirus are higher than most
 estimates reported for SARS and MERS-CoV, but similar to some estimates from subsets of
 data in the early period of SARS. For the SARS coronavirus, estimates ranged from 1.1 to
 4.2 with most estimates between 2 and 3 (Bauch et al. 2005). These estimates represent a
 range of methods and settings. Some estimates come from data that mixes time periods
 before and after control. Estimates of 0 also varied based on assumed serial intervals (e.g.
 Lipsitch et al. (2003) estimated 0 ranging from 2.2 to 3.6 for serial intervals of 8 to 12 days
 (9). Bauch et al. reviewed sources of variation in basic reproductive numbers of SARS and
 noted that those locations in which outbreaks occurred, 0 was approximately 3. Estimates
 from MERS-CoV were uniformly lower, with estimates from Saudi Arabia having a mean less
 than 1 (~0.5) but exhibited large temporal variability with increases in some periods of time
 particularly in healthcare settings (Cauchemez et al. 2016).

 A comparison of the efficiency of transmission in this outbreak and in SARS outbreaks can
 be seen as well in simple comparisons of doubling times in each outbreak. In SARS,
 doubling times varied from 4.6 days to 14.2 days depending on setting (doubling time,
 Td=6.0 (1358 over 63 days, Singapore), Td=4.6 (425 over 41 days, Hong Kong), Td=14.2
 (7919 over 185 days, overall)) (Lipsitch et al. 2003). Using the counts of confirmed cases as
 of 22 January (444) and assuming the outbreak began on 15 December 2019, we find a
 doubling time of 4.1. However, using our estimates of the size of the outbreak on 1 and 21
 January (24 and 11,257 people respectively) we estimate a doubling time of 2.3. We note
 this is similar to estimates from the SARS outbreak in Hong Kong (Lipsitch et al. 2003).

 Limitations

 Our model necessarily makes a number of assumptions. Our estimates of the reproductive
 number of this novel coronavirus are tied to the specific time period and data analysed here,
 and this measure may change substantially over the course of this outbreak and as
 additional data arrives. Additionally, the spatial component of our model is dependent upon
 only airline travel; the model does not include rail and road transportation, so we may
 underestimate local connectivity. Our modelling of Wuhan travel restrictions does not
 account for stochastic effects, and so may underestimate the potential effect of travel
 restrictions as a consequence. We also do not attempt to account for any dynamic changes
 in control or other factors than may influence transmission, nor changes in surveillance and
 reporting effort.

 5
medRxiv preprint doi: https://doi.org/10.1101/2020.01.23.20018549. The copyright holder for this preprint (which was not peer-reviewed)
 is the author/funder, who has granted medRxiv a license to display the preprint in perpetuity.
 It is made available under a CC-BY-NC-ND 4.0 International license .

 Read JM et al. Novel coronavirus 2019-nCoV: early estimation of epidemiological parameters and epidemic predictions

 Earlier novel coronavirus (SARS and MERS-CoV) outbreaks found evidence for substantial
 heterogeneity in reproductive numbers between individuals (Cauchemez et al. 2016; Bauch
 et al. 2005; Chowell et al. 2004). In our analysis, we assume that there is little heterogeneity
 in reproductive numbers and this assumption may change our estimated reproductive
 number. Additionally, 0 estimates tend to be reduced as case information accumulates,
 though control measures may also be introduced during these periods. Our estimate of 0
 may also reflect the dynamics of surveillance effort and reporting rather than just the
 dynamics of the epidemic.

 A key uncertainty of this outbreak is when it started. We have chosen to model transmission
 from 1 January onwards. Surveillance in China and elsewhere only started once the
 outbreak was identified in Wuhan. Had the outbreak started much earlier, and both domestic
 and international infections occurred before January and in early January (while surveillance
 was ramping up), our estimates of the reproductive number would mostly decrease.

 A threat to the accuracy of these projections is if a substantial proportion of infection has
 been due to multiple exposures to animals that has been curtailed in some way. These data
 may also represent a period of high transmission (due to favourable seasonal conditions,
 stochastic variation or selection bias in detecting large clusters of transmission) that will not
 be sustained over long periods of time.

 Summary

 We are still in the early days of this outbreak and there is much uncertainty in both the scale
 of the outbreak, as well as key epidemiological information regarding transmission. However,
 the rapidity of the growth of cases since the recognition of the outbreak is much greater than
 that observed in outbreaks of either SARS or MERS-CoV. This is consistent with our higher
 estimates of the reproductive number for this outbreak compared to these other emergent
 coronaviruses, suggesting that containment or control of this pathogen may be substantially
 more difficult.

 6
medRxiv preprint doi: https://doi.org/10.1101/2020.01.23.20018549. The copyright holder for this preprint (which was not peer-reviewed)
 is the author/funder, who has granted medRxiv a license to display the preprint in perpetuity.
 It is made available under a CC-BY-NC-ND 4.0 International license .

 Read JM et al. Novel coronavirus 2019-nCoV: early estimation of epidemiological parameters and epidemic predictions

 Figures

 Figure 1. Connectivity of Wuhan to other cities and provinces in mainland China, based on
 total commercial airline traffic from Wuhan in January 2017. Traffic is based on the number
 of departing bookings.

 Figure 2. Sensitivity of parameter estimates to assumed incubation period. Boxes represent
 the 95% confidence intervals around point estimates (black dots), as the incubation period is
 varied.

 7
medRxiv preprint doi: https://doi.org/10.1101/2020.01.23.20018549. The copyright holder for this preprint (which was not peer-reviewed)
 is the author/funder, who has granted medRxiv a license to display the preprint in perpetuity.
 It is made available under a CC-BY-NC-ND 4.0 International license .

 Read JM et al. Novel coronavirus 2019-nCoV: early estimation of epidemiological parameters and epidemic predictions

 Figure 3. Epidemic predictions for (A) Wuhan, (B) selected Chinese cities and (C) selected
 countries. Uncertainty in estimated model parameters is reflected by 500 repeated
 simulations with parameter values drawn randomly from the distribution of fit estimates.

 Figure 4. Effect of imposing travel restrictions from/to Wuhan on 23 Jan 2020 onwards.
 Here, we compare increasing the predicted number of infections across cities of mainland
 China

 8
medRxiv preprint doi: https://doi.org/10.1101/2020.01.23.20018549. The copyright holder for this preprint (which was not peer-reviewed)
 is the author/funder, who has granted medRxiv a license to display the preprint in perpetuity.
 It is made available under a CC-BY-NC-ND 4.0 International license .

 Read JM et al. Novel coronavirus 2019-nCoV: early estimation of epidemiological parameters and epidemic predictions

 Tables

 Table 1. Predicted epidemic sizes in selected cities on 4 February 2020 assuming no
 change in transmissibility from current time to 4 February.

 9
medRxiv preprint doi: https://doi.org/10.1101/2020.01.23.20018549. The copyright holder for this preprint (which was not peer-reviewed)
 is the author/funder, who has granted medRxiv a license to display the preprint in perpetuity.
 It is made available under a CC-BY-NC-ND 4.0 International license .

 Read JM et al. Novel coronavirus 2019-nCoV: early estimation of epidemiological parameters and epidemic predictions

 References

 Bauch CT, Lloyd-Smith JO, Coffee MP, Galvani AP. Dynamically modeling SARS and other
 newly emerging respiratory illnesses: past, present, and future. Epidemiology. 2005 Nov
 1:791-801.

 Bogoch II, Watts A, Thomas-Bachli A, Huber C, Kraemer MU, Khan K. Pneumonia of
 Unknown Etiology in Wuhan, China: Potential for International Spread Via Commercial Air
 Travel. Journal of Travel Medicine. 2020. https://doi.org/10.1093/jtm/taaa008 [cited 22
 Jan 2020].

 Cauchemez S, Nouvellet P, Cori A, Jombart T, Garske T, Clapham H, Moore S, Mills HL,
 Salje H, Collins C, Rodriquez-Barraquer I. Unraveling the drivers of MERS-CoV
 transmission. Proceedings of the National Academy of Sciences. 2016 Aug
 9;113(32):9081-6.

 Centre for Disease Control and Prevention. 2019 Novel Coronavirus (2019-nCoV), Wuhan,
 China. CDC. 2020. https://www.cdc.gov/coronavirus/2019-nCoV/summary.html [cited 22
 Jan 2020].

 Chowell G, Castillo-Chavez C, Fenimore PW, Kribs-Zaleta CM, Arriola L, Hyman JM. Model
 parameters and outbreak control for SARS. Emerging Infectious Diseases. 2004
 Jul;10(7):1258.

 CGTN. Things you need to know about the world’s largest human migration.
 https://news.cgtn.com/news/2020-01-19/What-is-the-world-s-largest-human-migration--
 Nmsd7OcJ8Y/index.html [cited 23 Jan 2020].

 Hong Kong Centre for Health Protection. Countries/areas with reported cases of novel
 coronavirus infection. January 22 2020.
 https://www.chp.gov.hk/files/pdf/statistics_of_the_cases_novel_coronavirus_infection_en.
 pdf [cited 23 Jan 2019].

 Imai, N, Dorigatti I, Cori A, Donnelly C, Riley S, Ferguson NM. Report 2: Estimating the
 potential total number of novel Coronavirus cases in Wuhan City, China. Imperial College.
 https://www.imperial.ac.uk/media/imperial-college/medicine/sph/ide/gida-
 fellowships/2019-nCoV-outbreak-report-22-01-2020.pdf [cited 23 Jan 2020].

 Lessler J, Reich NG, Brookmeyer R, Perl TM, Nelson KE, Cummings DA. Incubation periods
 of acute respiratory viral infections: a systematic review. Lancet Infect Dis.
 2009;9(5):291–300. doi:10.1016/S1473-3099(09)70069-6

 Lipsitch, M, Cohen T, Cooper B, Robins JM, Ma S, James L, Gopalakrishna G, et al.
 Transmission Dynamics and Control of Severe Acute Respiratory Syndrome. Science.
 2003. 300 (5627): 1966–70.

 New York Times (a). Death Toll From Virus Outbreak in China's Hubei Reaches 17: State
 TV

 10
medRxiv preprint doi: https://doi.org/10.1101/2020.01.23.20018549. The copyright holder for this preprint (which was not peer-reviewed)
 is the author/funder, who has granted medRxiv a license to display the preprint in perpetuity.
 It is made available under a CC-BY-NC-ND 4.0 International license .

 Read JM et al. Novel coronavirus 2019-nCoV: early estimation of epidemiological parameters and epidemic predictions

 https://www.nytimes.com/reuters/2020/01/22/world/asia/22reuters-china-health-hubei-
 cases.html [cited 23 Jan 2020].

 New York Times (b). Wuhan, Center of Coronavirus Outbreak, Is Cut Off by Chinese
 Authorities. https://www.nytimes.com/2020/01/22/world/asia/china-coronavirus-travel.html
 [cited 23 Jan 2020].

 OAG Traffic Analyser FAQs. Luton: OAG. https://www.oag.com/traffic-analyser-faq. [cited
 July 2015].

 R Core Team (2019). R: A language and environment for statistical computing. R
 Foundation for Statistical Computing, Vienna, Austria. https://www.R-project.org/ [cited 23
 January 2020].

 Tan W, Zhao X, Ma X, Wang W, Niu P, Xu W, et al. A Novel Coronavirus Genome Identified

 in a Cluster of Pneumonia Cases — Wuhan, China 2019−2020[J]. China CDC Weekly.
 2020,2(4): 61-62.

 World Health Organization. Consensus document on the epidemiology of severe acute
 respiratory syndrome (SARS). WHO. 2003. https://apps.who.int/iris/handle/10665/70863
 [cited 22 Jan 2020].

 World Health Organization (a). WHO | Novel Coronavirus – China. WHO. 12 Jan 2020.
 https://www.who.int/csr/don/12-january-2020-novel-coronavirus-china/en/ [cited 23 Jan
 2020].

 World Health Organization (b). Twitter post. 21 Jan 2020.
 https://twitter.com/WHOWPRO/status/1219478547644813312?s=20 [cited 23 Jan 2020].

 World Health Organization (c). WHO | Coronavirus. 2020. https://www.who.int/health-
 topics/coronavirus [cited 23 Jan 2020].

 11
You can also read