Caltrain Business Plan - COVID RECOVERY PLANNING UPDATE ON NEAR TERM SERVICE PLANNING - caltrain.com
←
→
Page content transcription
If your browser does not render page correctly, please read the page content below
Caltrain
Business
Plan
C O V I D R E C O V E RY
PLANNING

U P D AT E O N N E A R T E R M
SERVICE PLANNING

October 28, 2020
Ongoing                                         Equity, Connectivity, Recovery,

Recovery                                        & Growth Framework

Planning                                        Near Term Service Planning

Efforts
Caltrain has pivoted its Business Plan
effort to focus on COVID-19 Recovery            Financial Analysis
planning. This work is spread across
multiple streams as shown on the right

Caltrain staff will engage regularly with the
Board, stakeholders and the public as           Scenario Planning
recovery planning proceeds over the next
several months

                                                                             2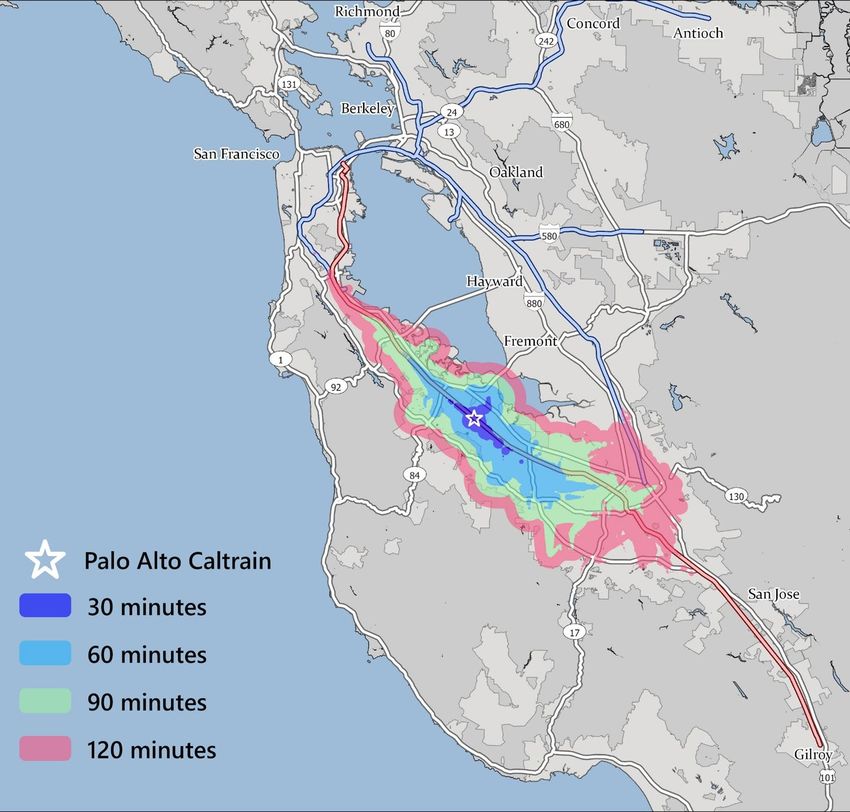
Ongoing                                         Equity, Connectivity, Recovery,

Recovery                                        & Growth Framework

Planning                                        Near Term Service Planning

Efforts
Caltrain has pivoted its Business Plan
effort to focus on COVID-19 Recovery            Financial Analysis
planning. This work is spread across
multiple streams as shown on the right

Caltrain staff will engage regularly with the
Board, stakeholders and the public as           Scenario Planning
recovery planning proceeds over the next
several months

                                                                             3
Context & Background
Multiple Phases of Crisis
& Response

Initial                                Surviving the                             Preparing for
Triage                                 Pandemic                                  the Next Reality
March 2020 – May 2020                  May 2020 – 2021 (?)                       2021 and Beyond

Initial crisis and immediate   Extended period where Pandemic is ongoing         Long-term resolution of pandemic
triage response by Caltrain    and Caltrain ridership and operations remain      through vaccine or other permanent
                               deeply impacted and in a state of dynamic flux.   public health approaches. Caltrain
                               Railroad’s financial position is precarious       adjusts to new Business Environment
                                                                                                                5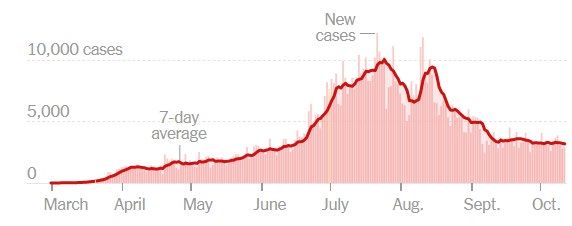
Global

The Pandemic
The U.S. and the world continue to
experience waves of the COVID-19
pandemic.
                                              US

Public health experts, like Dr. Fauci, have
indicated that they expect a vaccine could
be available for mass distribution around
Q2 2021, while social distancing
guidelines are likely to remain in effect
through at least Q3 2021.
                                              California

                                                           Source: NY Times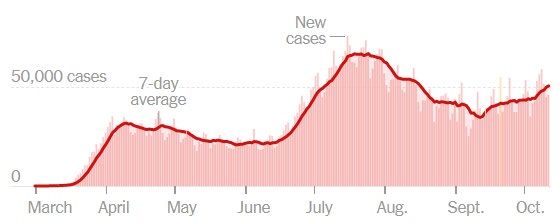
The Pandemic
& Bay Area
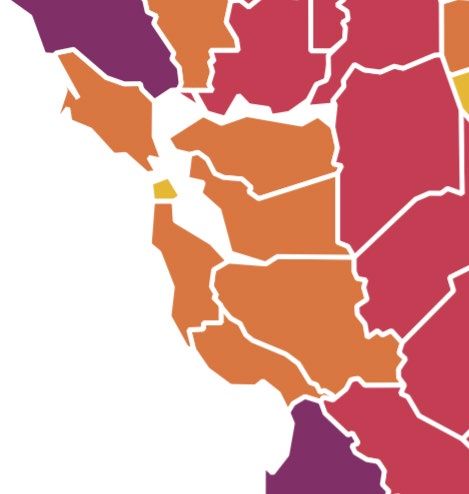
The Bay Area has been under a shelter-in- San Francisco
place order since March. Cases loads have
generally remained lower than other regions in
the country. San
Mateo
On October 20th, San Francisco became the
first urban county to reach the state’s least Santa Clara
restrictive tier in California’s reopening
blueprint—although non-essential offices can Transmission Risk
open at 25% capacity.
Tiers as of 10/27
Many large companies have announced plans
to continue remote work through at least July
2021. Some have announced permanent shifts
toward remote work and hybrid work options.
Source: California
Department of
Public Health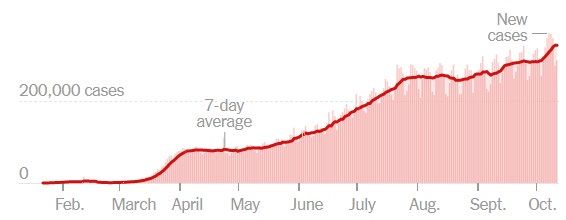
California's COVID-19 Cases and
The Pandemic                                      Deaths by Race and Ethnicity

& Equity                                          Latinx
                                                  Percent CA Population
                                                  Percent Cases
                                                  Percent Deaths

                                                  White
The COVID-19 pandemic and economic effects
have disproportionately affected low income
communities and communities of color.
These populations have been more likely to face   Asian
exposure as essential workers or be adversely
affected by the shelter-in-place order.
Caltrain’s Equity, Connectivity Recovery &
                                                  Black
Growth Framework (adopted at the September
JPB meeting) provides guidance to Caltrain
regarding ways it can make its services more
useful and accessible to these communities
                                                  Other

                                                                                            Source: California
                                                                                            Department of Public Health
                                                              10%         20%   30%   40%    50%            60%
Changes in Caltrain Service
and Ridership
70,000                                                                                                                                          100
Riders                                                                                                                                          Trains
                                                                                March 17th: Shelter-in-Place Order Issued
         Average Weekday Ridership by Month

                                                                                                                                                70
                                              Weekday Trains by Month

                                                                                                                                                40

 5,000
                                                                              N/A
                                    Jan                                 Feb         Mar       Apr          May          Jun   Jul   Aug   Sep
Change in Weekday Service Levels

                                                5                  5

                           hour / direction
                           # of Trains per
                                                4                  4
 Pre-COVID Service Plan                         3                  3
          92 Trains/Day                         2                  2
     65,000 Daily Riders                        1         1        1         1
                                 Early AM     AM Peak   Midday   PM Peak   Late PM

    Current Service Plan                        3                  3
                           # of Trains

          70 Trains/Day                         2                  2
     ~3,500 Daily Riders                        1        1         1         1
                                 Early AM     AM Peak   Midday   PM Peak   Late PM
Health & Safety Enhanced Cleaning Face Coverings Physical Distancing Since the start of the pandemic, Caltrain has aggressively implemented enhanced safety protocols with an emphasis on frequent cleaning, mask requirements for all employees and passengers, and physical distancing onboard trains. Caltrain has partnered with other Bay Area transit agencies to develop common commitments and expectations for employees and passengers – and the JPB adopted the Riding Together—Bay Area Healthy Transit Plan at its September meeting
A Challenging Fiscal Outlook

Caltrain                                           $     Fiscal Year 2021 Budget

Finances                                                 • The JPB has incrementally approved
                                                            balanced quarterly operating budgets for Q1
                                                            and Q2
                                                         • A deficit of at least $18.5 million is projected
Lacking a dedicated source of funding, Caltrain
                                                            for the remainder of the fiscal year
is highly dependent on fare revenue. With
ridership devastated by the pandemic, Caltrain           • Deficit could be higher if ridership recovery is
has had to rely heavily on CARES Act federal                slow or GoPass participation drops further
relief funding. The railroad has avoided                 • Fiscal year 2022 will present additional
devastating service cuts and has refrained from             financial challenges
furloughs while using these funds.
CARES funding will be exhausted soon, and
Caltrain must consider how to balance service            Analyzing Options
costs, customer needs and available financial            • Caltrain is exploring a variety of deficit
resources as it looks toward the coming year.
                                                           closure options related to both revenue
                                                           generation and cost reduction
                                                         • Service plans shown here are being
                                                           analyzed for cost implications
Context
Winter Service • The COVID-19 Pandemic is ongoing and the path
to recovery and resolution is uncertain. Reopening
Change:
of the region has been slow and uneven
• CARES Act funding will be exhausted in December
Context and
timeframe. Overall financial state of railroad is
highly uncertain
• Hillsdale reopening, potential Atherton closure and
Goals ongoing major construction on corridor
Goals
Caltrain continues to navigate a period of • Develop a consistent service framework that can be
extreme uncertainty relative to both the financial scaled up (and down) based on demand and
health of the system as well the trajectory of the funding availability while minimizing disruption and
pandemic and its impact on ridership recovery confusion for riders and connecting transit
• Focus on serving the riders who need Caltrain
most, with an emphasis on implementing key
elements of the ECRG policy
• Balance travel time and coverage goals while also
maintaining capacity for social distancingOverall Service Approach
Who’s riding Caltrain during COVID-19?

  Share of riders that qualify                                           28%                           Ridership has skewed
  for low income housing
  assistance                                         13%                                               toward essential
                                                                                                       workers, many of whom
  Share of riders that live in                                                                   49%
                                                                                                       live in low- or middle-
  households earning less                                                                              income households.
  than $100k per year                                                 26%

  Share of riders that did         % of Riders during COVID-19 (July 2020 Survey)                      Unknown
  not have to a car                % of Riders in 2019 Triennial Survey                        48%

                                 0%          10%           20%          30%           40%      50%
                                 Based on the July 2020 online survey, 2019 Triennial Survey
Where Are Riders September 2020 Weekday Ridership
at Top Ridership Stations
Traveling?
(2019 Ridership for Comparison)
600
620
590
Weekday Riders
Caltrain ridership patterns have shifted during 400
COVID-19, with ridership comprised of
310 330
essential workers in healthcare, life sciences, 200 270
government, and related fields. 180
0
4th & King Millbrae Redwood Palo Alto Mountain San Jose
Rider Trip Purposes (15,000) (3,200) City (4,200) (7,400) View (4,600) Diridon
(4,800)
70% of riders commuting to work
Ridership Concentration Gilroy Extension
50% of riders work in healthcare, life Ridership during COVID-19 has
been more concentrated around
Ridership on the Gilroy
extension (50 riders per day)
sciences, or government stations with major medical centers mirrors systemwide decline.
like Palo Alto and Redwood City,
10% of riders traveling to medical with fewer riders commuting to
appointments offices due to COVID restrictions.Social Distancing Social Distancing Ample Space is Available Trains can handle about 33% of seated capacity On a typical day, Caltrain served a max (roughly 250 passengers) in order to maintain 6 feet load of around 8% of seated capacity in of distance between passengers, or about 500 September (about 60 passengers). passengers to maintain 3 feet of distance.
When are Riders Traveling on Weekdays?
                               Weekday ridership has experienced earlier peaks due to a higher proportion healthcare workers

                              Average Weekday Ridership vs. Social Distancing Capacity
                              Northbound                                                                                                       Southbound
                                                                                                  3 TPH                                                                                                     3 TPH
                             750                                                                                                         750
Social Distancing Capacity

                                                                                                            Social Distancing Capacity
                                                                                                  2 TPH                                                                                                     2 TPH
                             500                                                                                                         500
                                                          Ample capacity for                                                                                          Ample capacity for
                                                          social distancing                                                                                           social distancing
                                                                                                  1 TPH                                                                                                     1 TPH
                             250                                                                                                         250

                               0                                                                                                           0
                                   4   5   6   7   8   9 10 11 12 13 14 15 16 17 18 19 20 21 22 23 24                                          4   5   6    7   8   9 10 11 12 13 14 15 16 17 18 19 20 21 22 23 24
                                                                    Hour                                                                                                         Hour

                                               Social Distancing Capacity (6 Feet)               Riders per Hour                                           Estimated Max Load per Train

                                   Based on September 2020 ridership and SF/SJ departure times
Weekend Weekly Ridership,
Pre-COVID and During COVID
Ridership Weekend Weekend
Patterns
6%
17%
The share of weekend ridership (1,900 per day, 2018 Sept
17% of all riders) is three times greater than pre- 2020
COVID-19. The resiliency of weekend ridership is
94% 83%
likely due to continued use by essential workers
Weekday Weekday
and low-income riders.
Ridership on Local trains is about 20% higher Ridership by Train Type
than on Bullet trains as the market for leisure trips 2018 Sept 2020 Riders
Service Type
has declined. Riders per Train per Train
Weekend Local 575 95
Weekend Bullet 542 79
Based on September 2020 ridership, 2019 ridership counts, and 2019 Triennial Survey Based on 2018 counts and September 2020 counts. Local comparison for service 8am-8pm.When are Riders Traveling on Weekends?
Average Weekday Ridership vs. Social Distancing Capacity
Northbound Southbound
750 750
Social Distancing Capacity
Social Distancing Capacity
2 TPH 2 2Trains
TPH
500 500
Ample capacity for Ample capacity for
social distancing social distancing
1 TPH 11Train
TPH
250 250
0 0
7 8 9 10 11 12 13 14 15 16 17 18 19 20 21 22 23 24 7 8 9 10 11 12 13 14 15 16 17 18 19 20 21 22 23 24
Hour Hour
Social Distancing Capacity (6 Feet) Riders per Hour Estimated Max Load per Train
Based on September 2020 ridership and SF/SJ departure timesBase Service Plan
AM Peak Midday PM Peak Evening
Weekend
Recommended Base
# of Trains
Service Plan 2 2 2 Hourly Service All Day
68 Trains/Weekday 1 1 1 1 (28-32 Trains/Day)
2 Trains per Hour, Per Direction – All Day Hourly All-Day Weekend Service
Caltrain would provide 2 trains per hour per Caltrain would increase weekend service to hourly
direction in the peak- sufficient to meet demand. By frequencies to better serve weekend riders,
expanding service to 2 trains through the midday especially essential workers and low-income
period, Caltrain can better serve unmet needs of riders.
essential workers and lower income riders.Why Two Trains? Caltrain has focused on maintaining at least two trains per hour during as many time periods as possible. Running at least two trains per hour, per direction provides several key benefits: 30 min frequency Reasonably Coverage to Timed connections at higher demand competitive all stations to every BART train stations travel times at Millbrae
A Framework
                                                 Expanded
                                                 Service Plan
                                                 92 Weekday Trains

For Service
                                                 28-32 Weekend Trains

Ridership is not expected to fully recover in
2021. Depending on public health conditions
and the railroad’s finances, Caltrain may need   Base Service
to make further service adjustments including    Plan
                                                 68 Weekday Trains
scaling service levels up or down to meet        28-32 Weekend Trains

changing needs.
An Expanded Service Plan could restore
service back to 92 trains per day.
An Austerity Service Plan could reduce service
                                                 Austerity
to as little as 44 trains per day and suspend
                                                 Service Plan
weekend service.                                 44 Weekday Trains
                                                 No Weekend Trains
Equity Low Income Ridership by Time Period
Implications Significant increases in service proposed during midday and
on weekends would benefit lower income riders
30%
The Base (and Expanded) service plans
expands service in a manner that supports the
% Low Income Riders
observed travel patterns of low-income riders
20%
who rely on Caltrain and enacts key service
components of the Equity, Connectivity
Recovery & Growth framework.
• Service frequency would double during 10%
midday periods and passengers will no
longer need to rely solely on local trains
• On weekends, service would increase to
0%
hourly (a 50% increase in frequencies) Early AM AM Peak Midday PM Peak Evening Late Weekend
Evening
• Service span is maintained Time Period
Source: 2019 Triennial Survey
Low income riders defined as riders qualifying for low income housing assistance in the three-county corridor.Equity Low Income Ridership by Time Period
Implications Service cuts to early morning, late evening and weekend
service would impact low income riders
30%
The Austerity Service Plan represents a minimum
viable level of service for the railroad.
% Low Income Riders
It would not provide equity benefits and cuts would
20%
impact low income riders.
• Suspending early morning, late evening, and
weekend services would substantially impact
lower income riders 10%
• Midday service would not be improved
The Austerity Plan is not recommended.
A potential intermediate level of service reduction 0%
Early AM AM Peak Midday PM Peak Evening Late Weekend
(between the Austerity and Base plan) could look at Evening
initially cutting either weekday or weekend service. Time Period
Source: 2019 Triennial Survey
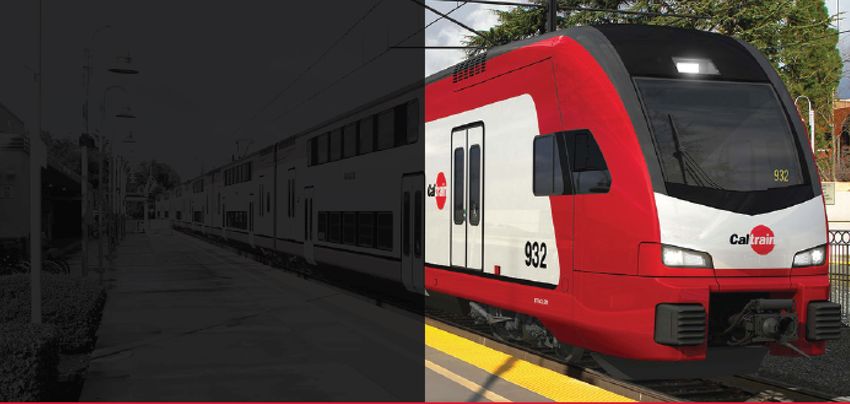
Low income riders defined as riders qualifying for low income housing assistance in the three-county corridor.Regional Access by Transit from Palo Alto
with Base 2tph Caltrain Service Plan
Shutdown
Considerations
While the Austerity plan is not recommended
and would have significant equity impacts, it
remains a strongly preferred option relative to
shutting down the railroad
The map at the right shows how far a person
could travel by transit during a weekday peak-
hour starting at the Palo Alto Caltrain station
(currently the busiest station in the system).
This map assumes the 2 train per hour peak
service included in both the Base Caltrain plan
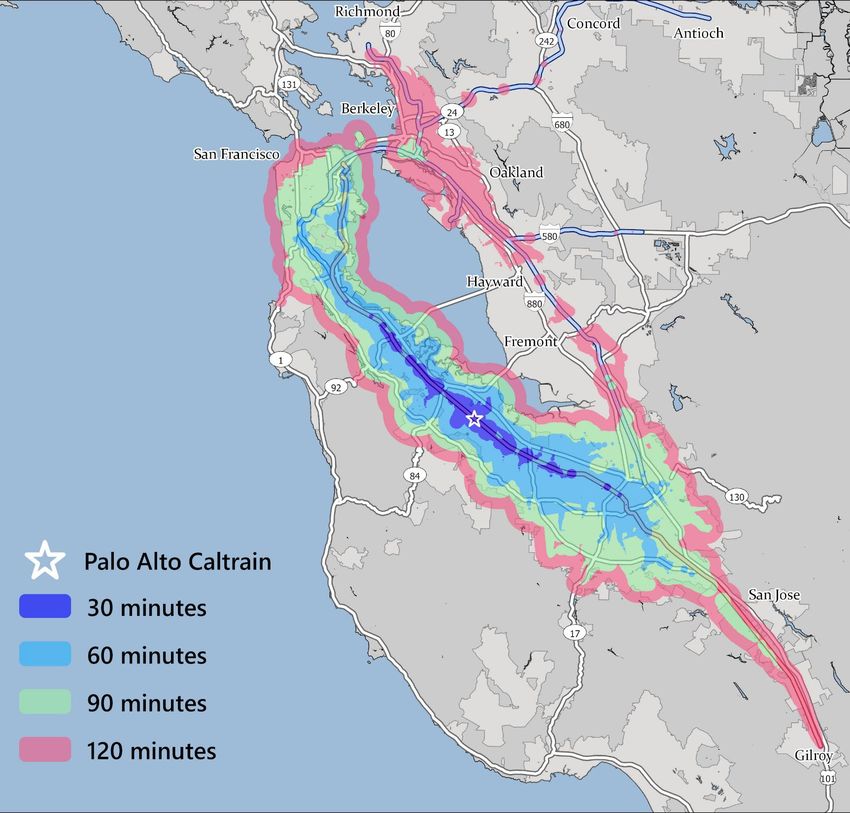
and austerity plan.Regional Access by Transit from Palo Alto with
Caltrain Service Shut Down
Shutdown
Considerations
The map at the right shows how transit access for
Palo Alto Station would change if Caltrain were
shut down and passengers only had access to bus
and connecting services. The table below
quantifies the loss of access to bay area residents
within a 60-minute travel shed.
60 Minute Travel Shed
Proposed
Base Service Service
People Served Pattern Shut Down % Difference
Population 1,390,000 488,200 -65%
Jobs 955,100 294,000 -69%
Low-Income 280,500 84,400 -70%
Non-White 878,300 282,800 -68%
Car-Free 100,300 31,000 -69%
Demographic data from 2018 American Community SurveyService Details
Local/Express                      Limited

 Service Options                                                 L E

                                                                        San Francisco
                                                                                                 A B

                                                                                                        San Francisco
                                                                        22nd St                         22nd St

 Operating two trains per hour per direction, Caltrain
                                                                        Bayshore                        Bayshore
 has two basic service options that fit the corridor:
 Local/Express Pattern                                                  South San Francisco             South San Francisco

                                                                        San Bruno                       San Bruno

      •   One express train and one local train per hour                Millbrae                        Millbrae

      •   11 stations receive two stops per hour, but                   Burlingame                      Burlingame

                                                                        San Mateo                       San Mateo
          headways vary between 10 and 50 mins                          Hayward Park                    Hayward Park
                                                                        Hillsdale                       Hillsdale
      •   2 roundtrips to Gilroy per day (Local)                        Belmont                         Belmont
                                                                        San Carlos                      San Carlos

 Limited Pattern                                                        Redwood City                    Redwood City

      •   Two limited stop trains running at similar                    Menlo Park                      Menlo Park
                                                                        Palo Alto                       Palo Alto
          travel times in a skip-stop manner                            California Ave                  California Ave

      •   11 stations receive two stops per hour at even                San Antonio                     San Antonio
                                                                        Mountain View                   Mountain View
          30-minute headways
                                                                        Sunnyvale                       Sunnyvale
      •   2 roundtrips to Gilroy per day (one on each                   Lawrence                        Lawrence

          pattern)
                                                                        Santa Clara                     Santa Clara

Stopping patterns shown are preliminary                                 San Jose Diridon                San Jose Diridon
                                                                        Tamien                          Tamien
recommendations and subject to change
                                                               To Gilroy: 2x roundtrip per Day   To Gilroy: 2x roundtrip per Day
Travel Markets & Equity Recommended stopping patterns were developed based on a number of factors including, historic ridership patterns, observed use of the system during the pandemic, and ECRG policy goals related to enhancing equity and connectivity. COVID-19 2019 Equity Essential Connectivity Ridership Ridership Workers to other transit Counts and & Triennial systems Surveys Survey
Travel Markets & Equity
                                                                            Stopping patterns shown are
                                                                            preliminary recommendations
                                                                            and subject to change

   Stations with 2
   Trains per Hour

                            Construction Underway

                                                    Construction Underway
         Top 8 Ridership

Top 8 Low Income Riders

 Community of Concern

         Hospital or Life
          Science Jobs

  Major Transfer Station
Service Characteristics: Comparison
Similarities Differences
Markets & Intermodal Balancing Competitive
Equity Connectivity Loads Travel Times
Both provide 2 trains per hour Both provide timed transfers Limited helps avoid crowding Limited provides moderately
throughout the day at stations to BART at Millbrae Station and enables social competitive travel times
serving high ridership distancing by maintaining between stations
volumes – especially those Both provide standardized, consistent 30-minute
serving low income riders and repeating schedules headways and balanced Local/Express provides fast
essential workers loads travel times between major
Limited provides even stations and slow travel times
Both provide hourly service at headways and better Local/Express may result in everywhere else
all other stations and on opportunities for coordinated imbalanced loads and
weekends transfers at more stations bunched headways of up to
Local/Express connects all 50 minutes
Both provide 2 daily
roundtrips to Gilroy station pairs. Limited does
notCoverage
Coverage of Station Pairs:
Limited vs. Local Express
Comparison
Prior to COVID-19, Caltrain connected
approximately 98% of station pairs, while 3%
were not connected.
With the Limited service, 18% of station pairs
would not be not connected. However, these
station pairs account for less than 3% of pre-
pandemic ridership.
Local/Express would serve 100% of riders
and station pairs.
To
Served by both Loc/Exp and Limited
Served by Loc/Exp but not served by LimitedTravel Time
Travel Times by Station Pair:
Local/Express vs. Limited
Comparison
Local/Express would be faster for trips
between major stations, but stations with only
local service would have slow travel times.
Limited trains would be faster for all other
trips, including trips between minor stations
and between minor and major stations.
To
Local/Express faster Limited faster
14 12 10 8 6 4 2 0 2 4 6 8 10 12 14
Trip time difference (minutes)Sample Travel Times
Travel times shown are
preliminary and subject
to change
Example Station Pair Local/Express Limited
Diridon-4th & King 65 or 91 79 Fastest
Travel
Palo Alto-San Mateo 17 or 25 21 Time
Diridon-Palo Alto 23 or 32 27
Menlo Park-Millbrae 29 25
Lawrence-Millbrae 53 45
San Carlos-4th & King 45 38
Palo Alto-4th & King 41 or 58 50
Lawrence-4th & King 79 68Headways & Both provide
timed connection
Limited pattern enables
coordinated transfers and
regular headways at more
Connectivity
to BART stations
50
Maximum Headway (mins)
40
While both patterns provide two trains per hour,
they differ in headways and potential for
connectivity. 30
Both provide timed connections to BART, which
will continue to operate every 30 minutes at 20
Millbrae.
Local/Express
The Limited pattern provides 30 minute regular
headways at all other stations receiving two 10
Limited
trains per hour, enabling more easily coordinated
transfers with other frequent transit services.
0
Local/Express provides variable headways of up 4th & King Millbrae Palo Alto Mountain Diridon
to 50 minutes, which makes coordinating View
transfers more challenging.Balancing
Express Local Limited
Passenger
Loads & Social
Distancing
With Local/Express, bunched headways and
differentiated travel times increase the
likelihood of imbalanced passenger loads,
which could make social distancing more
challenging as ridership returns.
Skip Stop balances passenger loads by
maintaining even headways and similar travel
times.Rider Other (10%)
Perspectives Prioritize Fast
Trains / Bullet
Service (15%)
Rider feedback suggest space for social
distancing and service frequency are higher Prioritize What is the single
priorities than providing faster service at this Social
Distancing
most important
time. & Cleaning thing Caltrain can
This feedback suggests a Limited service (39%)
do to help you at
would better meet the needs of riders.
this time?
Prioritize Service
Frequency (36%)
Source: July 2020 Caltrain Rider SurveyWeekday
Operate the Base Service Plan at 68 trains per
day with 2 TPH throughout the day
Recommendation
• Serves peak ridership demand
• Responds to midday needs of low-income
riders and essential workers by significantly
improving midday service
• Provides framework for scaling up or down
based on finances and demand
Operate two Limited patterns per hour
• Balances passenger loads to promote social
distancing
• Provides regular headways and enables
coordinated transfers
• Provides good travel times for all stations
• Provides two daily roundtrips to Gilroy (one
trip on each pattern)Weekend
Provide Hourly Local Service to provide 28-32
trains per day (+4 trains over today)
• Better serves ridership demand and promotes
Recommendation social distancing
• Responds to needs of low-income riders and
essential workers by increasing service frequency
by 50%
• Regular hourly service better enables coordinated
transfers with other transit providers
• Maintains construction windows
Suspend Weekend Bullet Service
• Weekend bullet service is scheduled around
leisure trips, a market that has been weak during
the pandemic. Observed ridership on weekend
bullets has been substantially similar to local
trains.
• Standardized hourly service benefits weekend
riders who are traveling to work or medical
appointmentsScaling Down: The Austerity service plan would not further
equitable outcomes
Austerity Plan Cutting service during off-peak periods,
shortening peaks and service span, and
suspending weekend service would have a
disproportionate effect on low-income riders
Rebuilding ridership would be difficult
There is presently not a clear peak period to plan
around - Caltrain may need to choose between
serving earlier peaks for medical workers or later
peaks for office workers
Austerity Plan is not recommended – and
remains conceptual only at this timeExample – Adding service by doubling
Scaling Up: recommended Base Service Pattern
Clockface service every 15 A B A B
There are several options for how minutes at major stations
Caltrain could scale up service as
finances allow and demand returns
Clockface service every 30
minutes at minor stations
Caltrain could double frequency on the two
Limited patterns
Travel times similar
• All stations would be served at least every between trains
30 minutes during peak periods, with major
stations served every 15 minutes
• Travel times would remain similar between Coordinated transfers
patterns
• Maintains coordinated transfers
• Minimal disruption to schedules
Balanced passenger loadsExample – Adding Service in
Scaling Up: a more customized pattern
Some major stations receive A B 1 2
There are several options for how 4 trains per hour, but at
Caltrain could scale up service as variable headways
finances allow and demand returns
Service may remain
hourly at some stations
Alternatively, Caltrain could reduce travel times
by providing fewer stops and more variation in
train types – either on added trains or within the Travel times different
service plan as a whole between trains
• Stations could be served by one to four
trains per hour at variable headways
Transfers may be more
• Travel times could decrease, especially difficult to coordinate
between major stations
• Change would involve more significant
disruption to schedules and would make
aspects of coordination with other service Potential for Imbalanced
providers more challenging passenger loadsNext Steps
Next Steps:
                                                    Implementation
                                                    • Continue refinement of schedule and stopping
                                                      patterns
Implementation                                      • Complete financial analysis related to crewing
                                                      and equipment utilization
& Monitoring                                        • Coordinate with connecting and partner
                                                      operators (BART, CCJPA, ACE, SFMTA,
                                                      SamTrans and VTA)
The outlined service approach is a staff            • Solicit feedback from JPB, CAC and other
recommendation based on available data and            stakeholder groups
evidence                                            • Confirm date for implementation (targeting mid-
                                                      December)
The pandemic has created a highly difficult and
dynamic business environment for transit –
further changes and adjustments will inevitably     Monitoring
be needed                                           • Develop pre- and post-implementation counts
                                                      and surveys
Monitoring rider reaction to the new service will   • Identify external measures that can be used to
be essential to determine what aspects are            calibrate and contextualize ridership outcomes
working well and what may need to change
Appendix: Stringline Charts
Local/Express LimitedYou can also read