GALILEO OPEN SERVICE PERFORMANCE ANALYSIS REPORT
←
→
Page content transcription
If your browser does not render page correctly, please read the page content below
Satellite Navigation Branch, ANG-E66

    GALILEO OPEN SERVICE
PERFORMANCE ANALYSIS REPORT
                   April 2021

                      Report #1
  Reporting Period: October 01 to December 31, 2020
              http://www.nstb.tc.faa.gov

       FAA William J. Hughes Technical Center
 Atlantic City International Airport, New Jersey 08405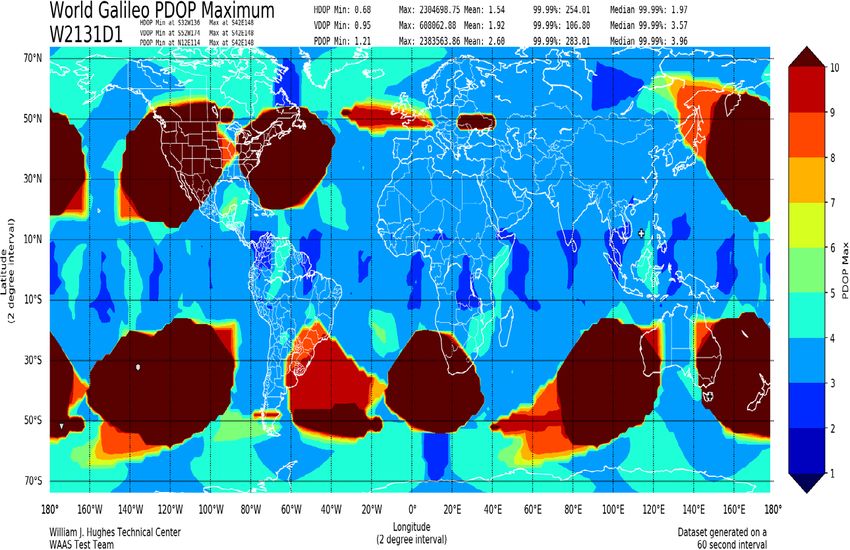
Galileo Open Service Performance Analysis Report

          DOCUMENT VERSION CONTROL

VERSION     DESCRIPTION OF CHANGE                  DATE

  0.1              Initial Draft                 03/04/2021

  0.2               Tech Edit                    03/10/2021

  0.3           Section 6 Updated                03/11/2021

  0.4            Group Tech Edit                 03/15/2021

  0.5              Peer Review                   04/01/2021

  0.6          External Peer Review              04/26/2021

  1.0              Final Report                  04/30/2021

                        ii                                    April 2021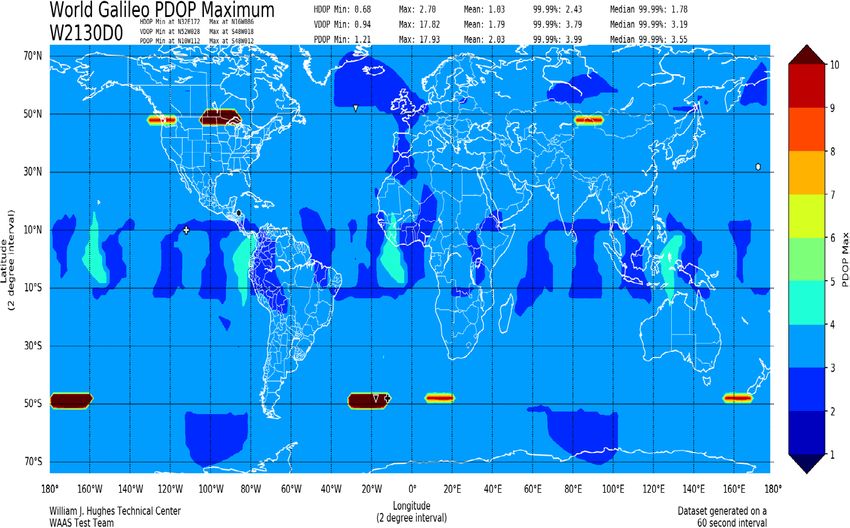
Galileo Open Service Performance Analysis Report

                                   EXECUTIVE SUMMARY

In 2016, the European Union made available the Galileo global satellite navigation system [1].
This system provides ranging, navigation, and timing services to properly equipped users. Galileo
is currently in its initial operational capability phase. Galileo is a Global Navigation Satellite
System similar to the United States’ Global Positioning System (GPS). Galileo and GPS are
interoperable and transmit signals on the same frequencies.

This report focuses exclusively on the Galileo performance. The Federal Aviation Administration
(FAA) publishes a separate report on GPS performance and Advanced Receiver Autonomous
Integrity Monitoring (ARAIM) performance. ARAIM is a dual-frequency/multi-constellation
scheme that uses GPS and Galileo in an aviation application.

The Galileo performance assessment evaluates parameters in the Galileo Open Service (OS)
Service Definition Document (SDD), version 1.1 [2]. The parameters included in this report or
future reports are, with the high-level results for the quarter, are:

Availability of Galileo Position Dilution of Precision (PDOP). The availability of PDOP less
than or equal to 6 is calculated on an equally spaced grid across the world as a monthly statistic to
coincide with Minimum Performance Level (MPL) in the OS SDD. Using the almanacs posted on
the European Global Navigation Satellite System Agency website and published Notices Advisory
to Galileo Users (NAGUs), coverage data was calculated for each month in the reporting period.
Availability of PDOP ranged from 99.18% to 99.99% for the months during this reporting period.

Signal Health and Accuracy F/NAV Signal-in-Space Accuracy (SISA). Using a Wide Area
Augmentation System (WAAS) G-III receiver at the William J. Hughes Technical Center in
Atlantic City, NJ, Galileo E5a F/NAV signals were tracked with the health assessed as per Figure
4 in the OS SDD v1.1 document [2]. During the Q4 2020, three marginal signal events were
detected where the F/NAV E5a signal broadcasted a SISA index of 255, indicating no accuracy
predication available (NAPA) from at least one satellite vehicle. The decoded F/NAV data from
the NovAtel G-III receiver was examined along with any available NAGUs relevant to each event.
Section 3.2 details data processing, cleansing, and modeling plans to assess signal-in-space ranging
accuracy (SISRA) as per OS SDD v1.1, Section 3.3.2, Tables 9 and 10. This section will include
SISRA results in upcoming Galileo quarterly reports.

Galileo Time Transfer Performance. Analysis of Galileo Time Transfer Performance will be
incorporated in a future report. As is done with GPS time transfer analysis, a data product is
needed from the United States Naval Observatory (USNO) comparing Galileo system time as
computed by its users, with that of the Universal Time Coordinated (UTC) standard of time
produced by the USNO and other labs. The evaluation of both accuracy and availability of
Galileo’s time dissemination service will follow the descriptions in OS SDD v1.1, Sections 2.3.3
and 3.3.3, and 2.3.4 and 3.3.4, respectively.

                                                 iii                                     April 2021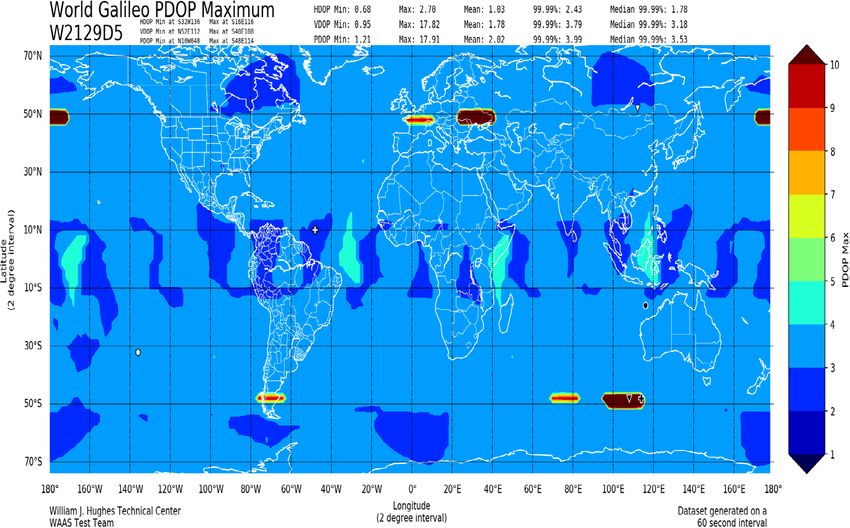
Galileo Open Service Performance Analysis Report

Availability of Galileo Positioning. In future reports this section will include data processing
results assessing the availability of the Galileo positioning service at the worst user location and
average user location as it relates to MPL commitments described in OS SDD v1.1, Section 3.4.4,
Tables 16 and 17. The development of this section depends on the completed development of data
processing, cleansing, and modeling detailed in Section 3.2. Using the dilution of precision
modeled in Section 2 along with the signal-in-space ranging error, this section will present
horizontal position error and vertical position error results modeled as described in OS SDD v1.1,
Section C.4.5.3.

This report does not include Galileo position accuracy obtained from receiver - satellite
pseudorange measurements.

Timely Publication of NAGUS. The timeliness of NAGUs is based on the MPLs discussed in
Section 3.6.1 of the Galileo OS SDD [2] using NAGUs published to the European GNSS Service
Center website [3]. There was one planned NAGU published in a timely manner that affected
service. There was one General NAGU not published in a timely manner that impacted service.

                                                iv                                      April 2021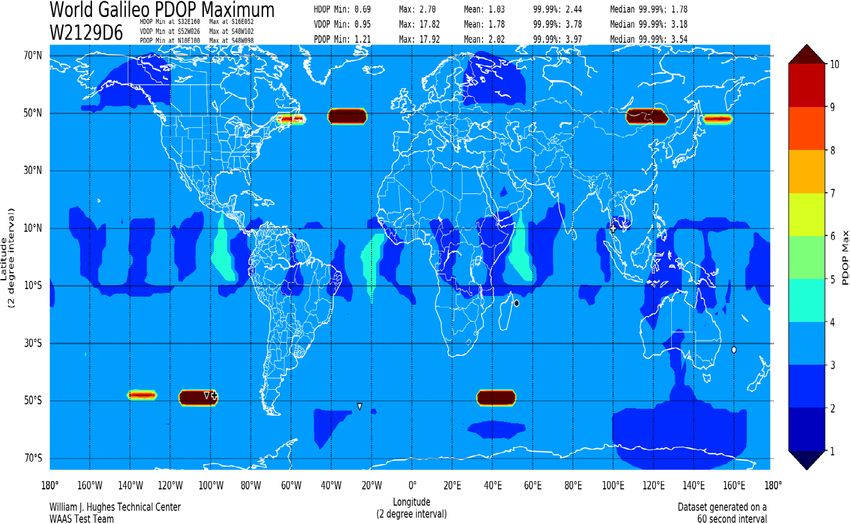
Galileo Open Service Performance Analysis Report

                                             TABLE OF CONTENTS

1.   INTRODUCTION .............................................................................................................. 1
2.   AVAILABILITY OF GALILEO POSITION DILUTION OF PRECISION..................... 2
3.   SIGNAL HEALTH AND ACCURACY (F/NAV) .......................................................... 15
     3.1       Healthy Signal Summary ...................................................................................... 15
               3.1.1      Monthly F/NAV Signal Health Tracked at WJHTC................................. 18
               3.1.2      F/NAV Marginal Signal Health Events Tracked at WJHTC .................... 20
     3.2       Satellite Position Errors ........................................................................................ 23
               3.2.1      SISRA ....................................................................................................... 23
               3.2.2      SISRA Quarterly Results .......................................................................... 25
4.   GALILEO TIME TRANSFER PERFORMANCE .......................................................... 25
     4.1       Availability ........................................................................................................... 25
     4.2       Accuracy ............................................................................................................... 25
5.   GALILEO POSITIONING PERFORMANCE ................................................................ 26
     5.1       Availability of the Galileo Positioning Service .................................................... 26
     5.2       Galileo Position Accuracy .................................................................................... 26
6.   MPL OF THE TIMELY PUBLICATION OF NAGUS ................................................... 27
7.   IGS DATA (POSITION ERRORS) ................................................................................. 33
8.   ACRONYMS .................................................................................................................... 34
9.   REFERENCES ................................................................................................................. 36

                                                                v                                                        April 2021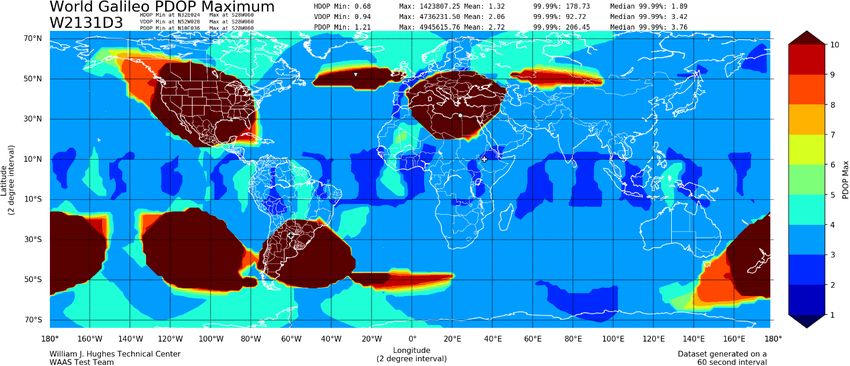
Galileo Open Service Performance Analysis Report

                                                    LIST OF FIGURES

Figure 2-1. Availability of Galileo PDOP October 2020 (PDOP Availability Contour Color bar:
            99.8%–100%) .............................................................................................................. 4
Figure 2-2. Availability of Galileo PDOP November 2020 (PDOP Availability Contour Color bar:
            99.0%–100%) .............................................................................................................. 5
Figure 2-3. Availability of Galileo PDOP December 2020 (PDOP Availability Contour Color bar:
            98.5%–100%) .............................................................................................................. 6
Figure 2-4.World Galileo Maximum PDOP (October 30, 2020) ................................................... 8
Figure 2-5. World Galileo Maximum PDOP (November 9, 2020) .............................................. 10
Figure 2-6. World Galileo Maximum PDOP (November 10, 2020) ............................................ 11
Figure 2-7. World Galileo Maximum PDOP (October 31, 2020) ................................................ 12
Figure 2-8. World Galileo Maximum PDOP (November 11, 2020) ............................................ 13
Figure 2-9. World Galileo Maximum PDOP (November 1, 2020) .............................................. 14
Figure 3-1. Percentage of Time Healthy F/NAV Subframes Tracked from WJHTC .................. 15
Figure 3-2. F/NAV Signal Health by SVID (Tracked at WJHTC October 2020) ........................ 19
Figure 3-3. F/NAV Signal Health by SVID (Tracked at WJHTC November 2020) .................... 19
Figure 3-4. F/NAV Signal Health by SVID (Tracked at WJHTC December 2020) .................... 20
Figure 3-5. Marginal F/NAV Signal (SVID 11 Tracked at WJHTC November 10–11) .............. 21
Figure 3-6. Marginal F/NAV Signal (SVID 1 Tracked at WJHTC December 7–9) .................... 22
Figure 3-7. Marginal F/NAV Signal (Multiple SVIDs Tracked at WJHTC December 14) ......... 23
Figure 3-8. 200 User Locations .................................................................................................... 25

                                                                  vi                                                    April 2021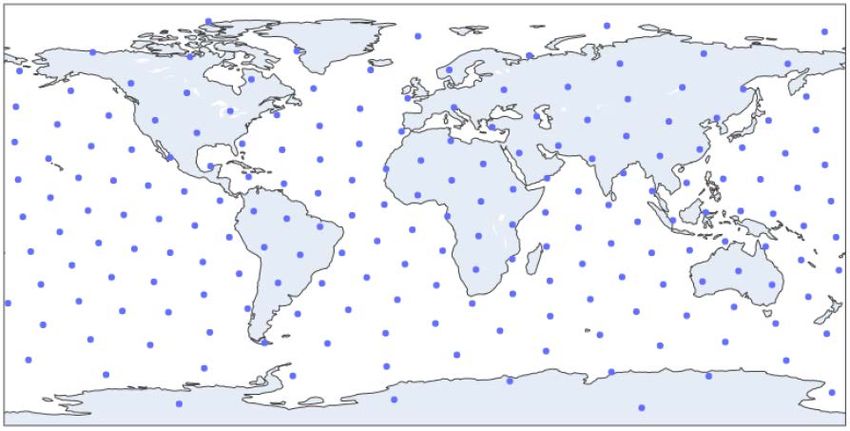
Galileo Open Service Performance Analysis Report

                                                     LIST OF TABLES

Table 2-1. Availability of PDOP Parameter ................................................................................... 2
Table 2-2. Availability of PDOP .................................................................................................... 3
Table 3-1. Q4 2020 F/NAV E5a SVIDs by SISA ........................................................................ 16
Table 3-2. Q4 2020 F/NAV E5a SISAs by SVID ........................................................................ 17
Table 6-1. MPL of the Timely Publication of NAGUS ................................................................ 27
Table 6-2. NAGUs Affecting Satellite Availability ..................................................................... 28
Table 6-3. NAGUs Forecasted to Affect Satellite Availability .................................................... 29
Table 6-4. Galileo Satellite Maintenance Statistics ...................................................................... 29
Table 6-5. Summary of Q4 Published NAGUs ............................................................................ 31

                                                                 vii                                                   April 2021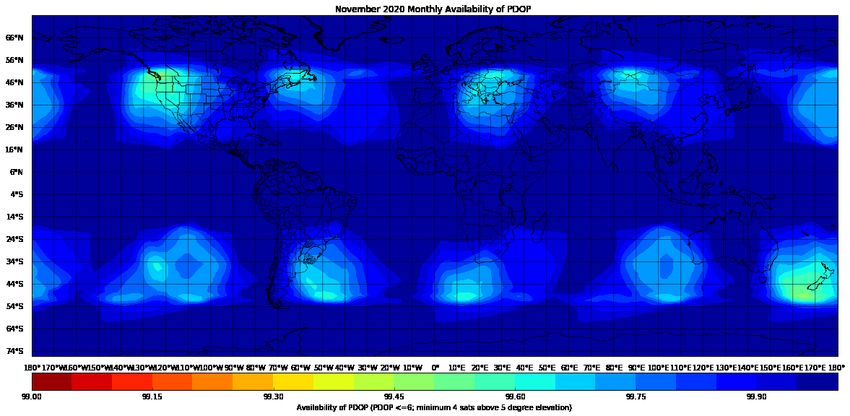
Galileo Open Service Performance Analysis Report

1.       INTRODUCTION

In 2016, the European Union (EU) made available the Galileo global satellite navigation system
[1], providing ranging, navigation, and timing services to properly equipped users. Galileo is
currently in its initial operational capability (IOC) phase. Galileo is a Global Navigation Satellite
System (GNSS) similar to the United States’ Global Positioning System (GPS). Galileo and GPS
are interoperable and transmit signals on the same frequencies.

Galileo provides four services: Open Service (OS), Safety-of-Life Service, Commercial Service,
and Public Regulated Service [4]. The scope of this report is limited to the OS, specifically the E1
and E5a signals. The Galileo signals applicable to the OS are E1 (1575.42 MHz, the same
frequency as GPS L1), E5a (1176.45 MHz, the same frequency as GPS L5), and E5b (1207.14
MHz). The E1 and E5a frequencies and modulation scheme correspond to GPS L1 and L5 to
simplify the combined use of both constellations.

The Federal Aviation Administration (FAA) will evaluate Galileo performance while it is still in
its IOC phase. Internationally, standards organizations are preparing specifications for aviation use
of Galileo. To prepare for the future use of Galileo in aviation, performance monitoring of Galileo
is necessary to assess the performance and characteristics of the system. Note that the European
Union’s European Global Navigation Satellite Systems Agency (GSA) also publishes Galileo
performance reports on their website [5].

This report focuses exclusively on Galileo performance. The FAA publishes a separate report on
GPS performance and Advanced Receiver Autonomous Integrity Monitoring (ARAIM)
performance. ARAIM is a dual-frequency/multi-constellation scheme that uses GPS and Galileo
in an aviation application.

This report uses several sources of data for the evaluation. A NovAtel G-III receiver located at the
FAA William J. Hughes Technical Center (WJHTC) in Atlantic City, NJ collects the Galileo
signals directly. Future reports will include data from other Galileo-capable receivers to expand
the footprint of this report’s assessment of Galileo. Other sources of data include Galileo broadcast
navigation data from the International GNSS Service (IGS) and precise Galileo ephemeris and
clock data from the Center for Orbit Determination in Europe (CODE). This report later explains
the use of these offline data sources.

The Galileo performance assessment evaluates parameters in the Galileo OS Service Definition
Document (SDD), version 1.1 [2]. The parameters included in this report or future reports are:

     •   Signal-in-Space Ranging Accuracy (SISRA)
     •   Signal-in-Space (SIS) Ranging Rate Accuracy
     •   Galileo Time Transfer Accuracy and Availability (Future Report)
     •   Per Slot Availability

                                                 1                                       April 2021
Galileo Open Service Performance Analysis Report
• Dilution of Precision (DOP) Availability
• Positioning Service Availability
• Timely Publication of Notice Advisory to Galileo Users (NAGU)
• User Position Error (this parameter is not in the OS SDD; it will be evaluated in future
reports)
The minimum performance levels (MPLs) for each of the parameters evaluated are in the
applicable section of this report.
Note that two Galileo constellation “auxiliary” satellites, Space Vehicle Identification (SVID)
numbers 14 and 18, were set healthy during this quarter on November 30, 2020. This report does
not include those two satellites in the performance assessment.
2. AVAILABILITY OF GALILEO POSITION DILUTION OF PRECISION
The availability of Galileo Position Dilution of Precision (PDOP) is the percentage of time the
PDOP remains less than or equal to a threshold for any point in the Galileo service coverage. DOP
is the effect on user position errors induced by the satellite geometry used in the position
measurement solution. The Galileo OS SDD defines the availability of Galileo PDOP to be the
percentage of time the PDOP remains less than or equal to 6 with a minimum of 4 Galileo satellites
visible above a 5-degree elevation transmitting healthy SIS (satellite health described in OS SDD
Section 2.3.1). On a global basis, the availability of PDOP is computed as the average over all user
locations within the service coverage (service coverage described in OS SDD Annex C.3 [2]),
provided as a monthly statistic.
Table 2-1 specifies the MPL for the availability of PDOP according to the OS SDD.
Table 2-1. Availability of PDOP Parameter
MPL of the Availability of PDOP Conditions and Constraints
• PDOPGalileo Open Service Performance Analysis Report
E18, were not included in the calculations and data provided in this section. This report contains
Galileo data processed from a NovAtel G-III receiver located at the FAA WJHTC. As we
incorporate additional receiver data and increase the visibility of worldwide Galileo satellite
ephemeris data, we plan to include the capability of using ephemeris data in DOP processing.
DOPs were calculated at every 2-degree grid between longitudes 180W to 180E and latitudes 74S
to 74N at 1-minute intervals. This resulted in 1440 samples for each of the 13,500 grid points over
a 24-hour period. Table 2-2 provides the results of the monthly Availability of PDOP (computed
as an average of the 2-degree coverage area described above).
Table 2-2. Availability of PDOP
Availability of PDOP
Month
(Galileo OS SDD MPL: ≥ 77%)
October 2020 99.99803%
November 2020 99.93169%
December 2020 99.18253%
Figure 2-1 through Figure 2-3 show a monthly contour plot of the availability of PDOP at each
2x2 degree grid point calculated for the Galileo coverage area. Inside each contour area, the
availability of PDOP percentage is greater than or equal to the contour value shown in the legend
for that color line. That areas’ value is also less than the next higher contour value, unless another
contour line lies within the current area. Please note the contour color values for Figure 2-1 through
Figure 2-3 vary for each plot. The Availability of PDOP for December (Figure 2-3) was not 100%
at any grid point due to the December 14, 2020 NAGU (2020021) that is discussed in this section
and in Section 6.
3 April 2021Galileo Open Service Performance Analysis Report
Figure 2-1. Availability of Galileo PDOP October 2020 (PDOP Availability Contour Color bar: 99.8%–100%)
4 April 2021Galileo Open Service Performance Analysis Report
Figure 2-2. Availability of Galileo PDOP November 2020 (PDOP Availability Contour Color bar: 99.0%–100%)
5 April 2021Galileo Open Service Performance Analysis Report
Figure 2-3. Availability of Galileo PDOP December 2020 (PDOP Availability Contour Color bar: 98.5%–100%)
6 April 2021Galileo Open Service Performance Analysis Report
Figure 2-4 shows a contour plot of the maximum PDOP values at each 2-degree grid point for a
24-hour period. Figure 2-4 shows typical PDOP performance during the quarter, using a day with
no NAGUs or events affecting PDOP. Galileo constellation ground tracks have a 10-day
repeatability cycle; therefore, consecutive 24-hour PDOP plots will not be repeatable day to day.
7 April 2021Galileo Open Service Performance Analysis Report
= location of maximum PDOP, VDOP and HDOP , respectively
= location of minimum PDOP, VDOP and HDOP , respectively
Figure 2-4.World Galileo Maximum PDOP (October 30, 2020)
8 April 2021Galileo Open Service Performance Analysis Report
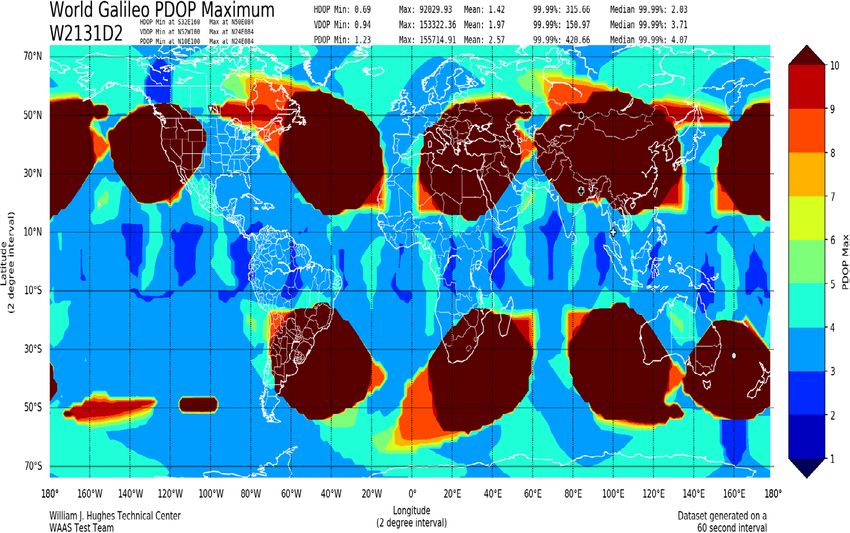
Events that affect Galileo PDOP are often due to satellite planned or unplanned outages. NAGUs
provide information of forecasted satellite outages and summarize times satellites were unusable,
after the event. This quarter had 2 events that affected Galileo PDOP. SVID 11 was unusable from
06:18 GMT on November 9, 2020 to 08:20 GMT on November 11, 2020 (NAGU 2020018). Figure
2-5 shows the maximum PDOP contour plot for November 9, 2020. Figure 2-4 can be referenced
to show the maximum PDOP plot on October 30, 2020 (10 days earlier) with similar Galileo
constellation and no NAGU events. Figure 2-6 shows the maximum PDOP plot for November 10,
2020 (NAGU 2020018), and Figure 2-7 shows the maximum PDOP plot on October 31, 2020
with no events. Figure 2-8 shows the maximum PDOP plot for November 11, 2020 (NAGU
2020018), and Figure 2-9 shows the maximum PDOP plot on November 1, 2020 with no events.
On December 14, 2020, a general NAGU (2020021) was issued reporting service degradation on
all Galileo satellites. Signals did not meet the MPLs defined in the OS SDD from 00:00 GMT to
06:12 GMT. All Galileo satellites were set to marginal during this time. Section 3.1 details the
satellite health during these time periods, and Section 6 provides NAGU information.
9 April 2021Galileo Open Service Performance Analysis Report
= location of maximum PDOP, VDOP and HDOP , respectively
= location of minimum PDOP, VDOP and HDOP , respectively
Figure 2-5. World Galileo Maximum PDOP (November 9, 2020)
10 April 2021Galileo Open Service Performance Analysis Report
= location of maximum PDOP, VDOP and HDOP , respectively
= location of minimum PDOP, VDOP and HDOP , respectively
Figure 2-6. World Galileo Maximum PDOP (November 10, 2020)
11 April 2021Galileo Open Service Performance Analysis Report
Figure 2-7. World Galileo Maximum PDOP (October 31, 2020)
12 April 2021Galileo Open Service Performance Analysis Report
= location of maximum PDOP, VDOP and HDOP , respectively
= location of minimum PDOP, VDOP and HDOP , respectively
Figure 2-8. World Galileo Maximum PDOP (November 11, 2020)
13 April 2021Galileo Open Service Performance Analysis Report
Figure 2-9. World Galileo Maximum PDOP (November 1, 2020)
14 April 2021Galileo Open Service Performance Analysis Report
3. SIGNAL HEALTH AND ACCURACY (F/NAV)
3.1 Healthy Signal Summary
The Galileo OS SDD v1.1, Section 2.3.1.4 discusses the mapping of SIS status flags with the SIS
status. Figure 3-1 shows the percentage of time that the E5a signal received at WJHTC with a
Wide Area Augmentation System (WAAS) G-III receiver demodulated F/NAV data from the E5a
signal which would be interpreted as a healthy signal following the decision tree described in
Figure 4 of the OS SDD v1.1. For this section, currently implemented data sources limit evaluation
to the sky visible in Atlantic City. Future reports will seek to evaluate the MPL commitments in
OS SDD, Section 3.4.1, which require worldwide signal tracking. Excluding auxiliary satellites
E14 and E18, 1,201,720 F/NAV subframes across 22 SVIDs were evaluated during the Q4 2020
period.
Figure 3-1. Percentage of Time Healthy F/NAV Subframes Tracked from WJHTC
Table 3-1 provides a count of each individual F/NAV subframe received with the NovAtel G-III
receiver at WJHTC, grouping the counts by the signal-in-space accuracy (SISA) index first then
by the SVID. Table 3-2 provides the same counts where the grouping instead begins with the SVID
followed by the SISA index.
15 April 2021Galileo Open Service Performance Analysis Report
Table 3-1. Q4 2020 F/NAV E5a SVIDs by SISA
SISA SVID # of Subframes Signal Data
Health Validity
Status Status
(SHS) (DVS)
1 56697 0 0
2 58078 0 0
3 58155 0 0
4 57204 0 0
5 58329 0 0
7 56837 0 0
8 56972 0 0
9 57581 0 0
11 55779 0 0
12 56999 0 0
13 58379 0 0
107
15 58503 0 0
19 55983 0 0
21 57117 0 0
24 57879 0 0
25 57829 0 0
26 57682 0 0
27 57731 0 0
30 58155 0 0
31 57741 0 0
33 22873 0 0
36 23167 0 0
1 258 0 0
3 149 0 0
7 230 0 0
8 271 0 0
12 51 0 0
13 243 0 0
108 15 84 0 0
19 8 0 0
21 260 0 0
24 76 0 0
26 288 0 0
27 53 0 0
31 254 0 0
110 11 78 0 0
16 April 2021Galileo Open Service Performance Analysis Report
SISA SVID # of Subframes SHS DVS
1 920 0 0
2 308 0 0
3 132 0 0
5 129 0 0
8 195 0 0
9 28 0 0
11 892 0 0
255
12 276 0 0
24 237 0 0
25 206 0 0
30 38 0 0
31 130 0 0
33 42 0 0
36 214 0 0
Table 3-2. Q4 2020 F/NAV E5a SISAs by SVID
SVID SISA # of Subframes
107 56697
1 108 258
255 920
107 58078
2
255 308
107 58155
3 108 149
255 132
4 107 57204
107 58329
5
255 129
107 56837
7
108 230
107 56972
8 108 271
255 195
107 57581
9
255 28
107 55779
11 110 78
255 892
17 April 2021Galileo Open Service Performance Analysis Report
SVID SISA # of Subframes
107 56999
12 108 51
255 276
107 58379
13
108 243
107 58503
15
108 84
107 55983
19
108 8
107 57117
21
108 260
107 57879
24 108 76
255 237
107 57829
25
255 206
107 57682
26
108 288
107 57731
27
108 53
107 58155
30
255 38
107 57741
31 108 254
255 130
107 22873
33
255 42
107 23167
36
255 214
3.1.1 Monthly F/NAV Signal Health Tracked at WJHTC
Figure 3-2 through Figure 3-4 show the F/NAV health status of the Galileo SVIDs tracked with a
NovAtel G-III receiver at WJHTC in Atlantic City for each month in the quarter. A firmware
upgrade to the NovAtel G-III receiver applied in November 2021 resolved an issue tracking SVID
33 and SVID 36. Healthy F/NAV subframes are marked in green and marginal subframes are
marked red.
18 April 2021Galileo Open Service Performance Analysis Report
SVID
Figure 3-2. F/NAV Signal Health by SVID (Tracked at WJHTC October 2020)
SVID
Figure 3-3. F/NAV Signal Health by SVID (Tracked at WJHTC November 2020)
19 April 2021Galileo Open Service Performance Analysis Report
SVID
Figure 3-4. F/NAV Signal Health by SVID (Tracked at WJHTC December 2020)
3.1.2 F/NAV Marginal Signal Health Events Tracked at WJHTC
The following sections examine in closer detail the F/NAV Page 1 SISA index and F/NAV Pages
1–3 IODnav from during the 3 periods in Q4 2020 when marginal F/NAV signals were detected
with a NovAtel G-III receiver at WJHTC in Atlantic City.
3.1.2.1 SVID 11 November 10–11, 2020
The times when the F/NAV signal on SVID 11 was tracked in a marginal state due to the SISA
index indicating No Accuracy Prediction Available (NAPA) state were covered by the forecasted
NAGU 2020017 (see Figure 3-5). The signal returned to a healthy state slightly before the usable
time published in NAGU 2020018.
20 April 2021Galileo Open Service Performance Analysis Report
Figure 3-5. Marginal F/NAV Signal (SVID 11 Tracked at WJHTC November 10–11)
3.1.2.2 SVID 1 December 7–8, 2020
On December 7 at 09:13:10 Universal Time Coordinated (UTC), the NovAtel G-III receiver at
WJHTC tracked the F/NAV signal on SVID 1 broadcasting a SISA index of 255 (see Figure 3-6).
The last seen F/NAV subframe in NAPA state was framed on December 9 at 01:41:30 UTC. No
associated NAGU appears to refer to this event on the SVID 1 F/NAV signal. An inquiry to the
Galileo Service Center, ticket #1057, provided the following explanation as to why a NAGU was
not issued:
“The Signal In Space Accuracy (SISA) is a prediction of the minimum standard deviation
of the unbiased Gaussian distribution which overbounds the Signal In Space Error (SISE)
predictable distribution for all possible user locations within the satellite coverage area.
When no accurate prediction is available (SISA=NAPA), this is an indicator of a potential
anomalous SIS. As consequence, the SIS Status was Marginal. In this case, the users were
protected with the status of the broadcast SIS. It was not an outage in the satellite service,
and for this reason, no NAGU was raised.”
21 April 2021Galileo Open Service Performance Analysis Report
Figure 3-6. Marginal F/NAV Signal (SVID 1 Tracked at WJHTC December 7–9)
3.1.2.3 Multiple SVIDs December 14, 2020
On December 14 at 00:02:20 UTC, the NovAtel G-III receiver at WJHTC tracked the F/NAV
signal on SVIDs 5, 9, 11, 12, and 31 broadcasting a SISA index of 255. The broadcast of NAPA
state on the F/NAV signal continued for approximately 4 hours, with SVID 2 sending the last
NAPA state at 04:44:50 UTC. Figure 3-7 provides the first and last UTC timestamps with a SISA
index of 255 for each SVID.
22 April 2021Galileo Open Service Performance Analysis Report
SVID
Figure 3-7. Marginal F/NAV Signal (Multiple SVIDs Tracked at WJHTC December 14)
3.2 Satellite Position Errors
3.2.1 SISRA
This section is planned for future reports. It will present the SISRA for each individual satellite as
well as the SISRA over all satellites to evaluate the MPLs as described in OS SDD v1.1, Section
3.3.2, Tables 9 and 10.
3.2.1.1 Data Source and Rate
The offline analysis in this report plans to use two sources of input data: Galileo broadcast
navigation data and post-processed precise data. The broadcast navigation data consists of satellite
23 April 2021Galileo Open Service Performance Analysis Report
orbit and clock parameters. The precise data consists of Galileo orbit and clock parameters. It is
used as the truth reference.
A subset of the Galileo broadcast navigation data is available from the IGS in Receiver
Independent Exchange (RINEX) navigation file format [7]. The available subset of broadcast
navigation data will be evaluated to determine if the Broadcast Group Delay term can be included
in the error models. Precise Galileo ephemerides and clock are generated from CODE in the
Standard Product #3 (SP3) format [8] [9].
3.2.1.2 Data Collection and Cleansing
A customized tool is used to automate the data downloads on a daily basis. All data are protected
by checksums and other basic integrity checks. Galileo broadcast navigation data is downloaded
from the Crustal Dynamics Data Information System (CDDIS) [10] archive site. Precise Multi-
GNSS Experiment (MGEX) data is downloaded from the CDDIS archive server.
The broadcast navigation data, as received in RINEX format from IGS, sometimes contains defects
such as duplications, inconsistencies, discrepancies, and errors that can cause false anomalies. A
cleansing algorithm is applied to the IGS data to generate “validated” navigation messages, which
have as many of these defects removed as possible. This process is based on the algorithm
described by Heng [11].
3.2.1.3 Error Computation
For each time step when precise data is available, all valid broadcast navigation data over all age
of data (AOD) is used to propagate the satellite orbits and clocks. To account for clock offset in
the precise product, at each epoch, the clock residuals between healthy precise and broadcast
products are filtered for outliers, then a mean correction is applied onto the CODE precise clock
estimate. At each data point for which both sources indicate a healthy signal and valid data within
the fit interval, the satellite position error is determined by calculating the difference between the
CODE-derived reference value and the calculated, propagated satellite position, in Earth-Centered,
Earth-Fixed (ECEF) coordinates. The errors are segregated into radial, along-track, and cross-track
(RAC) errors. The satellite position error is also projected onto Earth at each epoch to produce the
maximum projected error (MPE), and projected along the lines of sight to individual user locations
on Earth to produce User Projected Error (UPE). MPE and UPE are two forms of signal-in-space
range error (SISRE) that are used to evaluate the error distributions.
UPE will be calculated using 200 evenly distributed user locations around the globe. This density
has been determined to be sufficient such that a value within 2 cm of the unfaulted MPE will be
observed at one or more of the user locations [12]. MPE is computed for each satellite, at each
epoch. UPE is computed for each of the 200 user locations, for each satellite in view, for each
epoch. A mask angle of 5 degrees is used for MPE and UPE computations. Figure 3-9 shows the
24 April 2021Galileo Open Service Performance Analysis Report
200 user locations. The UPE at these points and the MPE are used to evaluate the SISRA as
described in OS SDD v1.1, Section 3.3.2, Tables 9 and 10.
Figure 3-8. 200 User Locations
3.2.2 SISRA Quarterly Results
Figures in this section will present the SISRA for each individual satellite as well as the SISRA
over all satellites.
This section is planned for future reports.
4. GALILEO TIME TRANSFER PERFORMANCE
The Galileo time transfer error analysis will be provided in future reports.
4.1 Availability
The availability of the Galileo UTC Time Dissemination Service is defined as the percentage of
time that the system provides at least one “healthy” ranging/timing SIS above a minimum elevation
angle of 5 degrees.
4.2 Accuracy
The Galileo SIS UTC Time Dissemination Accuracy and the Galileo SIS UTC Frequency
Dissemination Accuracy are computed as the daily average error of the normalized time and
25 April 2021Galileo Open Service Performance Analysis Report
frequency offset relative to UTC for a user equipped with a Standard Timing/Calibration
Laboratory Receiver.
The accuracy data was provided by the United States Naval Observatory (USNO) website [13].
The data file contains daily overall values for the entire constellation. They are an estimate of the
difference between the USNO Master Clock and Galileo System Time (GST). These values
represent a 2-day filtered linear solution and computed for 0 hours Universal Time (UT) of the
second day and published daily for the preceding day. In order to evaluate the Galileo time-transfer
error, the data file was used to create a histogram to represent the distribution of the Galileo time
error. The histogram was created by taking the absolute value of time difference between the
USNO Master Clock and GST, then creating data bins with 1-nanosecond precision. The number
of samples in each bin was then plotted to form a histogram. The maximum instantaneous UTC
offset error (UTCOE) for the quarter was 13.3 nanoseconds. The mean, standard deviation, and
95% index of Time Transfer Error, and the maximum UTCOE are all within the requirements of
GPS Standard Positioning Service (SPS) time error.
5. GALILEO POSITIONING PERFORMANCE
This section of the report provides information and performance for the availability of Galileo
Position Service and Galileo Position Accuracy. Data will be presented in future reports.
5.1 Availability of the Galileo Positioning Service
Figures in this section will show the availability of positioning at the worst user location (WUL)
and average user location (AUL) to assess the commitments to the MPLs described in OS SDD
v1.1, Section 3.4.4, Table 16 and 17. Sections 3.2.1–3.2.3 describe the data source and processing
followed to arrive at the SISRE. The SISRE, along with the DOP described in Section 2, are used
to derive the position accuracy in this section as described in OS SDD v1.1, Section C.4.5.3.
5.2 Galileo Position Accuracy
Galileo user position errors are not constrained by MPLs according to the Galileo OS SDD. The
data that pertains to this section is assessed as 30-day statistics to coincide with the MPL conditions
defined in the OS SDD for Availability of Galileo Position Service (see Section 5.1).
Galileo navigation measurement data is being collected using a FAA WJHTC Satellite Navigation
(ANG-E66) NovAtel G-III receiver to process Galileo position accuracy. The Galileo user position
tool uses a dual frequency solution processing the E1b - E5a frequencies (F/NAV message). The
user position is calculated once per second and compared to the surveyed position of the receiver
to assess the position error when PDOP is less than or equal to 6. Galileo satellite measurement
data is used in the position solution according to the ephemeris and SIS health status specifications
26 April 2021Galileo Open Service Performance Analysis Report
in the OS SDD. The FAA Satellite Navigation Team is currently working to incorporate and
validate other test receivers processing Galileo navigation and measurement data into this report.
NovAtel G-III firmware upgrades were installed on the WJHTC receiver to track and process the
Galileo constellation satellite measurements. Current analysis of receiver performance,
environment, and firmware is ongoing; therefore, user position data is not available for the time
period of this report. Future reports will include histograms of the calculated horizontal position
error (HPE) and vertical position error (VPE) over a 1-month period, highlighting the 95th
percentile. As more receivers are incorporated in the Galileo user solution processing, the
histograms will provide an overall HPE and VPE, respectively.
6. MPL OF THE TIMELY PUBLICATION OF NAGUS
The Galileo OS SDD v1.1, Section 3.6.1 [2] discusses the timely publication of NAGUs. A
published NAGU is considered timely if it fulfills two criteria: 1) if a NAGU is categorized as
planned, it must be published over 24 hours before the event occurs, and 2) if a NAGU is
categorized as unplanned, it must be published within 72 hours of the event that occurred (see
Table 6-1).
Table 6-1. MPL of the Timely Publication of NAGUS
MPL OF THE TIMELY PUBLICATION
CONDITIONS AND CONSTRAINTS
OF NAGUS
For scheduled events affecting the service • Including both Planned and General
NAGUs
• ≥ 24 hours before the service is affected
For unscheduled outages or events affecting • Only for Unplanned NAGUs
the service
• ≤ 72 hours after the event affecting the
service is detected
Satellite availability performance was analyzed based on published NAGUs. During this reporting
period, October 1 through December 31, 2020, there were 2 reported outages. One outage was a
planned activity and was reported in advance, and one was a General NAGU which was reported
after the outage occurred. A complete listing of outage NAGUs for the reporting period is provided
in Table 6-5.
Table 6-2 provides a summary of the time each NAGU affected service. Total unscheduled time
is the amount of time in hours a NAGU indicated service outages without notifying Galileo users
in advance or that fell outside the forecasted outage time. Total scheduled time is the actual time
in hours that satellite outages affected service according to the USABLE NAGU within the
27 April 2021Galileo Open Service Performance Analysis Report
forecasted time indicated in the corresponding PLN_OUTAGE NAGU. The Total time is the
amount of time both unscheduled and scheduled that a satellite outage affected service.
Table 6-2. NAGUs Affecting Satellite Availability
Total Total
NAGU SVID Type Start End Total
Unscheduled Scheduled
11
09 Nov
NOV
2020
2020018 11 USABLE 2020 0 50.03 50.03
06:18
08:20
UTC
UTC
1 6.03 0 6.03
2 6.03 0 6.03
3 6.03 0 6.03
4 6.03 0 6.03
5 6.03 0 6.03
7 6.03 0 6.03
8 6.03 0 6.03
9 6.03 0 6.03
11 6.03 0 6.03
12 14 Dec 14 Dec 6.03 0 6.03
13 GENERAL 2020 2020 6.03 0 6.03
2020021
15 (NOTICE) 00:00 06:12 6.03 0 6.03
19 UTC UTC 6.03 0 6.03
21 6.03 0 6.03
24 6.03 0 6.03
25 6.03 0 6.03
26 6.03 0 6.03
27 6.03 0 6.03
29 6.03 0 6.03
31 6.03 0 6.03
33 6.03 0 6.03
36 6.03 0 6.03
Totals of Unscheduled Scheduled and Total Downtime 132.66 50.03 182.69
Table 6-3 provides a summary of NAGUs published which forecast satellite outages.
28 April 2021Galileo Open Service Performance Analysis Report
Table 6-3. NAGUs Forecasted to Affect Satellite Availability
NAGU SVID TYPE Start End Total Comments
09 Nov 11 Nov
2020 2020
2020017 11 PLN_OUTAGE 54.50 2020018
05:05 11:35
UTC UTC
Total Forecasted Downtime 54.50
Table 6-4 provides a summary of Satellite Reliability, Maintainability, and Availability data. This
data is being collected based on published NAGUs. The “Percent Operational” was calculated
based on the ratio of total actual operating hours to total available operating hours for every satellite
according to published NAGUs.
Table 6-4. Galileo Satellite Maintenance Statistics
Satellite Availability Parameter
Total Forecasted Downtime (hrs) 54.50
Total Actual Downtime (hrs) 182.69
Total Actual Scheduled Downtime (hrs) 50.03
Total Actual unscheduled Downtime (hrs) 132.66
Total Satellite Outages 23
Scheduled Satellite Outages 1
Unscheduled Satellite Outages 22
Percent Operational – Scheduled Downtime (%) 99.91
Percent Operational – All Downtime (%) 99.62
NAGU 2020017 was published on November 6, 2020 at 16:50 UTC for an event that occurred on
November 9, 2020 at 06:18 UTC. The NAGU warned users about the unavailability of service by
GSAT0101 for all signals. Since this NAGU was planned and published over 24 hours before the
event, it was published in a timely manner.
NAGU 2020021 was published on December 14, 2020 at 14:00 UTC for an event that occurred at
06:12 on the same day. The NAGU alerted users ex post facto of the unavailability of service on
all satellites for all signals. Since the NAGU was in regards to an unplanned event and was
published within 72 hours of the occurrence, it was published in a timely manner.
29 April 2021Galileo Open Service Performance Analysis Report
The F/NAV signal broadcasted a SISA index of 255 from December 7, 2020 at 09:13 UTC until
December 9, 2020 at 01:41 UTC on E01 (GSAT0210). Since users were protected with the status
of the broadcast SIS, this was not considered an outage in the satellite service. Therefore, no
NAGU was published.
Table 6-5 provides the timeliness details of each NAGU that occurred during this quarter.
30 April 2021Galileo Performance Analysis Report
Table 6-5. Summary of Q4 Published NAGUs
NAGU Event Description
Month NAGU Type Published Category Timeliness
Number Time
Oct NO NAGUS PUBLISHED
Galileo satellite GSAT0101 (all
NAGU was
signals) will be unavailable from
06 Nov 2020 09 Nov 2020 published 56.25
PLN_OUTAGE 2020017 Planned 2020-11-09 beginning 05:05 UTC.
16:50 UTC 05:05 UTC hours before the
Outage recovery estimated on 2020-
event.
11-11 11:35 UTC.
Galileo satellite GSAT0101 (all
signals) is usable since/as of 2020-11-
11 beginning 08:20 UTC. payload on
11 Nov 2020 09 Nov 2020
USABLE 2020018 N/A RAFS clock. Galileo satellite
16:45 UTC 06:18 UTC
GSAT0101 (all signals) was
unavailable from 2020-11-09
Nov beginning 06:18 UTC.
Galileo satellite GSAT0201 (all
signals) is usable since/as of 2020-11-
30 Nov 2020 30 Nov 2020
USABINIT 2020019 N/A 30 beginning 08:32 UTC. GSAT0201
13:10 UTC 08:32 UTC
is positioned in slot EXT01 of the
constellation. payload on PHM clock.
Galileo satellite GSAT0202 (all
signals) is usable since/as of 2020-11-
30 Nov 2020 30 Nov 2020
USABINIT 2020020 N/A 30 beginning 08:32 UTC. GSAT0202
13:10 UTC 08:32 UTC
is positioned in slot EXT02 of the
constellation. payload on PHM clock.
31 April 2021Galileo Performance Analysis Report
NAGU Event Description
Month NAGU Type Published Category Timeliness
Number Time
Users have experienced a service
degradation on all Galileo satellites.
signals did not meet the minimum
performance levels defined in the
NAGU was
Galileo open service definition
GENERAL 14 Dec 2020 14 Dec 2020 published 14
Dec (NOTICE)
2020021
14:00 UTC 00:00 UTC
General
hours after the
document starting 2020.12.14 at
00:00 UTC ending 2020.12.14 at
event.
06:12 UTC. All satellites providing
nominal signals as of 2020.12.14 at
06:55 UTC. Nominal service has been
resumed.
32 April 2021Galileo Open Service Performance Analysis Report
7. IGS DATA (POSITION ERRORS)
This section will be included in future reports.
33 April 2021Galileo Open Service Performance Analysis Report
8. ACRONYMS
AOD Age of data
ARAIM Advanced Receiver Autonomous Integrity Monitoring
AUL Average user location
CDDIS Crustal Dynamics Data Information System
CODE Center for Orbit Determination in Europe
DOP Dilution of precision
DVS Data Validity Status
ECEF Earth-Centered, Earth-Fixed
EU European Union
FAA Federal Aviation Administration
GNSS Global Navigation Satellite System
GPS Global Positioning System
GSA Global Navigation Satellite Systems Agency
GST Galileo System Time
HDOP Horizontal dilution of precision
HPE Horizontal position error
IGS International GNSS Service
IOC Initial operational capability
MGEX Multi-GNSS Experiment
MPE Maximum projected error
MPL Minimum performance level
NAGU Notice Advisory to Galileo Users
NAPA No Accuracy Prediction Available
OS Open Service
PDOP Position dilution of precision
RCA Radial, along-track, and cross-track
RINEX Receiver Independent Exchange
SDD Service Definition Document
SHS Signal Health Status
SIS Signal-in-space
SISA Signal-in-space accuracy
SISRA Signal-in-space ranging accuracy
SISRE Signal-in-space range error
SP3 Standard Product #3
SPS Standard Positioning Service
SVID Space Vehicle Identification
UPE User Projected Error
USNO United States Naval Observatory
UT Universal Time
34 April 2021Galileo Open Service Performance Analysis Report
UTC Universal Time Coordinated
UTCOE UTC offset error
VDOP Vertical dilution of precision
VPE Vertical position error
WAAS Wide Area Augmentation System
WJHTC William J. Hughes Technical Center
WUL Worst user location
35 April 2021Galileo Open Service Performance Analysis Report
9. REFERENCES
1. The European Space Agency, “What is Galileo?,” https://www.esa.int/Applications/Navigation/
Galileo/What_is_Galileo, last accessed on February 23, 2021.
2. European GNSS (Galileo) Open Service Service Definition Document, Issue 1.1, available at
https://www.gsc-europa.eu/sites/default/files/sites/all/files/Galileo-OS-SDD_v1.1.pdf, published
May 2019.
3. European Global Navigation Satellite Systems Agency, European GNSS Service Center,
“NAGUs (Notice Advisory to Galileo Users),” https://www.gsc-europa.eu/system-status/nagu-
information, last accessed March 31, 2021.
4. The European Space Agency, “Galileo Navigation Signals and Frequencies,”
https://www.esa.int/Applications/Navigation/Galileo/Galileo_navigation_signals_and_frequencie
s, last accessed February 23, 2021.
5. European Global Navigation Satellite Systems Agency, https://www.gsa.europa.eu/, last
accessed March 31, 2021.
6. European Global Navigation Satellite Systems Agency, European GNSS Service Center,
“Almanac,” https://www.gsc-europa.eu/product-almanacs, last accessed March 31, 2021.
7. National Aeronautics and Space Administration, CDDIS, “GNSS MGEX Data,”
https://cddis.nasa.gov/Data_and_Derived_Products/GNSS/gnss_mgex.html, last accessed on
March 15, 2021.
8. International GNSS Service, “MGEX Pilot Project,” https://www.igs.org/mgex/#referencing,
last accessed on March 15, 2021.
9. International GNSS Service, “MGEX Data & Products,” https://www.igs.org/mgex/data-
products/#products, last accessed March 15, 2021.
10. National Aeronautics and Space Administration, CDDIS, https://cddis.nasa.gov/, last accessed
June 2, 2020.
11. L. Heng, "Safe Satellite Navigation with Multiple Constellations: Global Monitoring of GPS
and GLONASS Signal-in-Space Anomalies," 2012.
12. Walter, T., Gunning, K., Phelts, E., and Blanch, J., “Validation of Unfaulted Error Bounds for
ARAIM,” NAVIGATION Journal of The Institute of Navigation, February 2018.
13. Naval Oceanography Portal, “The United States Naval Observatory,”
https://www.usno.navy.mil/USNO, last accessed March 31, 2021.
36 April 2021You can also read