Database Performance Analyzer - EVALUATION GUIDE - SolarWinds
←
→
Page content transcription
If your browser does not render page correctly, please read the page content below
EVALUATION GUIDE

Database Performance Analyzer
EVALUATION GUIDE: Database Performance Analyzer

Database Performance Analyzer
INTRODUCTION
The purpose of this guide is to help you get the most out of your evaluation.

»» Learn why DPA is the most powerful tool for application performance

»» Identify what is slowing your app using the steps in the walkthrough section:

      • How to identify the performance problems

      • Correlate response time with system resources

      • Determine specific bottlenecks that slow response time

      • Set up proactive management with automated reporting and alerting

»» See why DPA is a smart investment for your team

»» Listen to what DPA customers have to say

page 2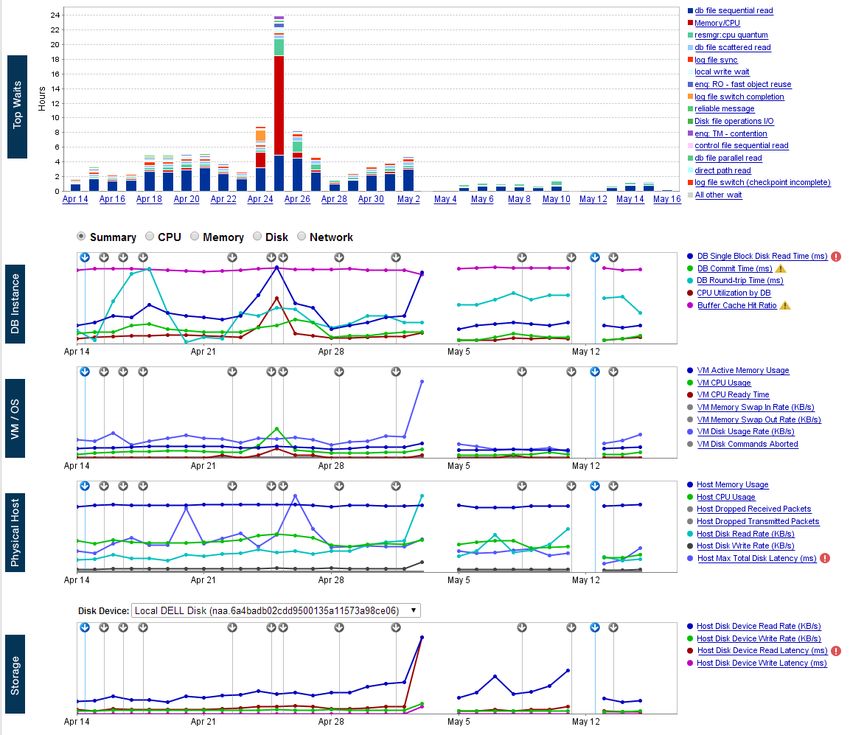
EVALUATION GUIDE: Database Performance Analyzer

DPA – A POWERFUL TOOL FOR APPLICATION PERFORMANCE
Application performance starts with the database
Databases are the heart of the applications we all depend on every day. Problems with an
application often result in needless finger pointing across teams, but the database is the best           Did You Know?
place to start. From social networks to mission-critical corporate apps, databases are the most
critical (and often the most complex) part of an application.

Monitoring tools are insufficient                                                                                88%
Traditional database monitoring tools focus on health metrics: up/down or red/yellow/green.
Dashboards show hundreds of gauges and numbers that are meaningless and require exten-
sive analysis. Network, virtualization, storage, and application teams have different tools and           88% of respondents cite
                                                                                                         the database as the most
function within siloes, leaving each with an incomplete view of performance. Current application           common challenge or
performance management tools provide hints, but do not help find the root cause. SolarWinds®               issue with application
                                                                                                               performance.
Database Performance Analyzer (DPA) is a powerful application performance monitoring tool
that addresses this gap in the market.                                                                              Source:
                                                                                                          Gleanster Survey Research

You can be the performance guru of your IT team
SolarWinds DPA provides visibility across application requests, SQL statements, database re-
sources, host/OS, network, virtualization, and storage performance. DPA incorporates wait-time
analysis so the focus is not only on health, but on the speed at which the database responds to
application requests. With “slow” rapidly becoming the new “broken,” SolarWinds DPA empow-
ers database administrators, developers, and all IT pros to quickly pinpoint the root cause of
performance issues. It then provides valuable advice for quickly resolving the issues.

Multi-Dimensional Performance Analysis™ makes troubleshooting simple
DPA’s Multi-Dimensional Performance Analysis looks at and correlates response time, resources,            Did You Know?
SQL statements, wait events/types, and relevant context to help quickly identify the root cause
of complex performance problems. DPA constantly looks at thousands of metrics that may
contribute to application performance issues in detail and over time, so IT pros can pinpoint
what happened at any given point in time and how performance compares to equivalent past
                                                                                                                 71%
operations.
                                                                                                                 71%
                                                                                                             71% of respondents
                                                                                                           indicated their current
                                                                                                         application performance
                                                                                                        management tools provide
                                                                                                        hints, but rarely identify the
 SQL Statements          Context              System Health              Wait- Based         Response
                                                                                                              root of problems
                                                                          Analytics            Time

                                                                                                                    Source:
                    DPA analyzes and correlates five dimensions to identify the root cause                Gleanster Survey Research

page 3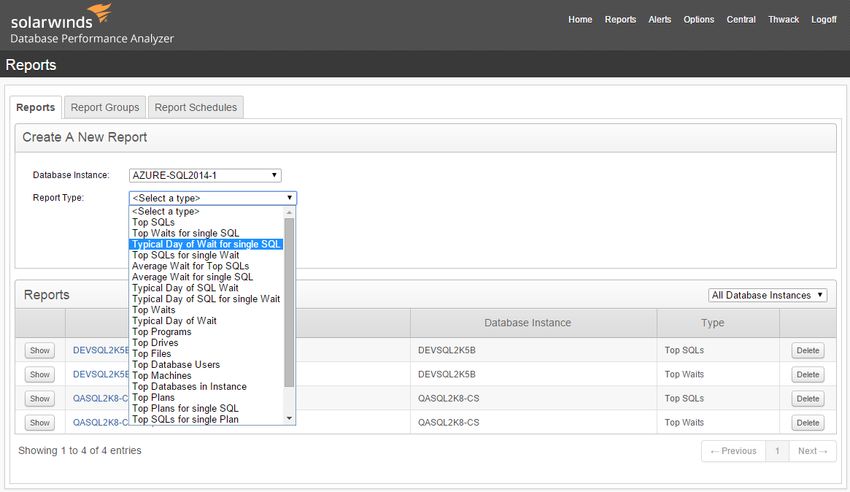
EVALUATION GUIDE: Database Performance Analyzer

Historical business intelligence
DPA excels in using historical data to identify opportunities for current improvements. From five
years ago to five seconds ago, DPA provides a wide range of historical data to help DBAs find
and resolve performance problems.

  Database Performance Analyzer excels in using historical data to identify opportunities for current improvements

Saves you time and saves your applications from failure
DPA presents all of this information in easy-to-understand bar charts, with alarms that lead
to more detailed data surrounding an issue. Having easy access to this information enables
DBAs and the whole application team to quickly solve problems, reduce downtime, and improve
end-user experience. Optimizing resources minimizes the need for costly hardware upgrades.

Scalable, low-impact performance analysis
DPA supports all major commmercial databases, including Oracle ® , IBM ® DB2 ® , SQL Server® ,
MySQL ® and SAP® Adaptive Server Enterprise (SAP ASE) (formally Sybase®), scaling from one
to thousands of instances, and supporting geographically distributed deployments to get a
view of an entire enterprise. SolarWinds DPA is deployed with no agent, so there is no need to
support or patch monitors across hundreds of instances. Combine that with DPA’s web-based
architecture and entire IT teams—including DBAs, architects, QA, and developers—can monitor
performance in production environments without placing additional load on the servers.

page 4
EVALUATION GUIDE: Database Performance Analyzer

Ease of installation and configuration
Designed for quick installation, DPA typically takes less than 20 minutes for installation and
configuration. Because DPA is 100% web-based, everything is browser accessible for unlimited
user access without an installed client. DPA runs on Windows®, UNIX®, and Linux® servers.

Monitor and optimize the top RDBMS engines on premise, virtualized, or in the Cloud
Monitor and optimize across SQL Server, Oracle, DB2, MySQL, and SAP ASE from a single view,
whether it’s on-premises, virtualized, or in the cloud. The SolarWinds DPA dashboard provides
an overview of all monitored instances and statuses.

Return on investment
The cost of DPA per month over three years is just over $55 dollars. For less than the cost of
a coffee, DPA is like insurance to help you run your applications better and faster. Alerts and
reports make it easy for the team to stay on top of things and spend less time writing and
maintaining scripts. DPA helps reduce the need for support and facilitates faster turnaround
times on issues.

For questions or to schedule a free consultation with a database performance expert,

Call/Email us: Phone: 1.866.530.8100 Email: dpasales@solarwinds.com

page 5
EVALUATION GUIDE: Database Performance Analyzer
A WALKTHROUGH OF DATABASE PERFORMANCE ANALYZER
Multi-vendor monitoring from
This guide assumes that you have installed DPA and have started monitoring the database single solution
instances. For best results, point DPA at as many database instances as possible. With only a
»» Oracle 11g, 12c (single tenant)
negligible load, you are safe using DPA to monitor critical production instances 24/7. »» SQL Server 2008, 2012, 2014
»» SAP ASE (formerly Sybase)
After installation, DPA will immediately begin collecting and displaying performance data, but 15.0.x, 15.5, 15.7, 16
to analyze performance trends and anomalies, you must allow DPA to monitor for several days. »» DB2 LUW 9.x, 10.1, 10.5
»» VMware® ESX®, ESXi™ 5.1, 5.5, 6
»» MySQL Community Edition
Identify the top performance issues
5.6 and Percona® 5.6
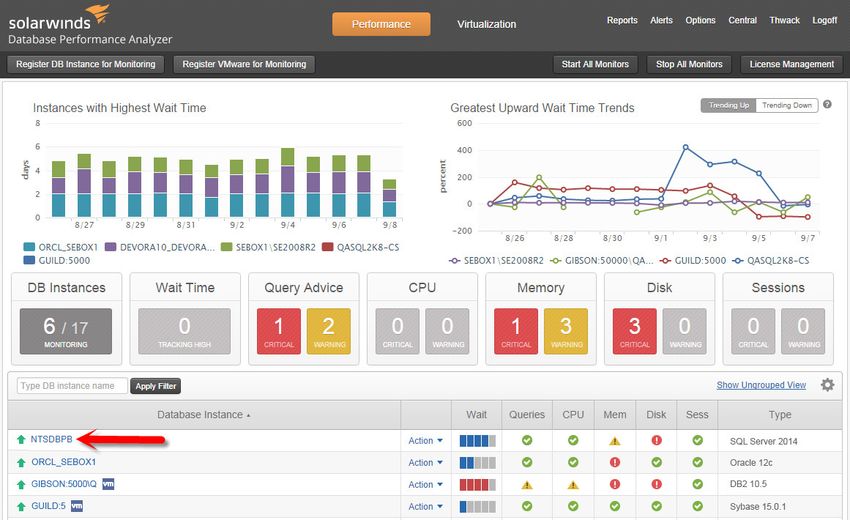
The SolarWinds DPA dashboard provides an overview of all monitored instances and statuses.
For detailed information about
DPA identifies the instances with the highest contribution to application waits. hardware server/system
requirements, please visit:
DPA Administrator Guide
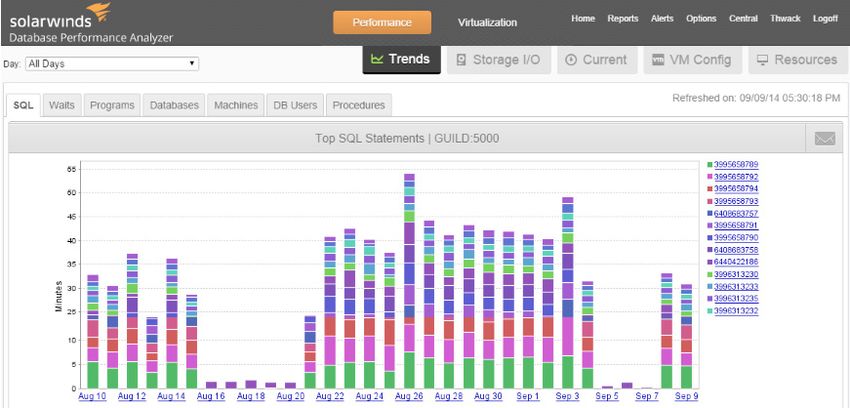
Screen 1: Click on the instance name to see more. Clicking on the instance name on Screen 1 takes you to the Trend View,
which shows the worst performing SQL statements for the day. The bigger the bar, the longer the application waits. Tips- Install DPA in Four Steps
1.Download.
2. Install on a server
(Windows®/Linux®) that is not
a production server.
3. Configure repository
database (SQL Server or
Oracle).
4. Register database instances
for monitoring. If running
on VMware, connect DPA to
vCenter™ for in-depth analysis.
For detailed information about
installation and configuration,
please visit:
DPA Administrator Guide
Screen 2: Click the big bar to drill down to the day’s performance details.
page 6EVALUATION GUIDE: Database Performance Analyzer
Correlate response time with system resources
Tips - Setup
DPA provides a direct correlation between response time and system resources such as CPU,
I/O, and memory. It is easy to see relationships between specific response time spikes and »» After installation, type
:8123
server resources by comparing these charts displayed in a single pane of glass. The Resource
into a Web browser. A wizard
Tab correlates resources with response time. will guide you through the
next steps.
»» Set up the historical reposi-
tory database.
»» Connect to the database in-
stances you want to monitor,
then connect to vCenter to
get clear visibility down to
the physical host if you are
running your database on
VMware (optional).
»» Analyze performance trends
and see results.
»» Immediately after install,
only real-time problems will
be apparent, but after a few
days performance trends
and anomalies begin to
emerge.
Screen 3: Click the ‘Resource Tab’ to view the correlation and then the big bar to see the hourly detail.
For detailed setup instructions,
please visit
DPA Administrator Guide
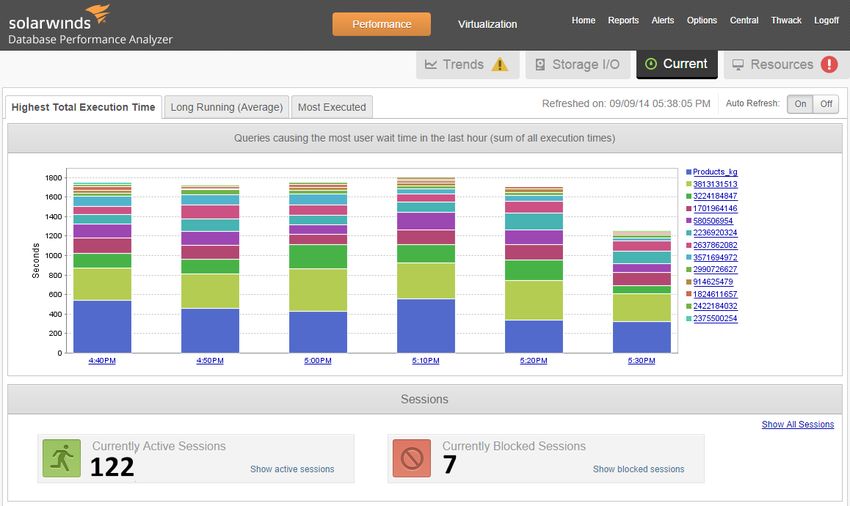
Determine specific wait bottlenecks that slow response time
The screen below displays a one-hour representation of the worst-performing SQL statements
(left side), how long the application is waiting (top), and specific wait types/events that are
causing the bottlenecks (right side).
Screen 4: Click on the wait type/event to get an explanation
of the problem and advice on how to resolve it.
page 7EVALUATION GUIDE: Database Performance Analyzer
Screen 5: See a description of the issue and even
recommend solutions based on best practices.
Diagnose the situation in real-time with Current View
In addition to historical trends, DPA’s Current View gives you insight into current issues.
To see immediate performance issues, switch to Current View to display response times within
the past minute or second.
Screen 6: Current View shows current conditions.
page 8EVALUATION GUIDE: Database Performance Analyzer
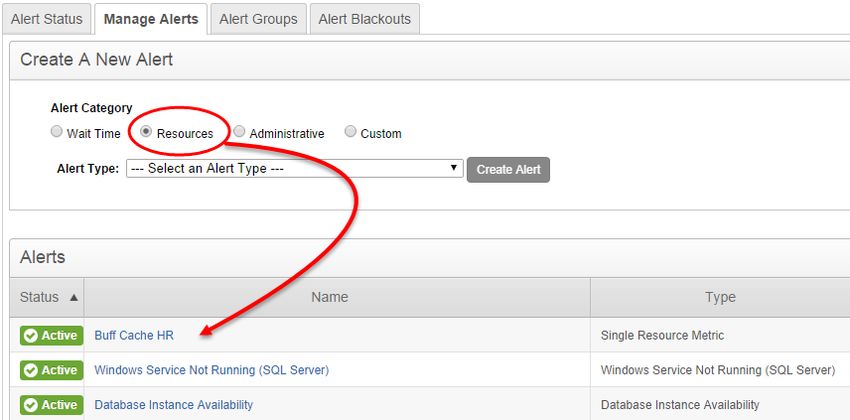
Set up proactive management with automated reporting and alerting
Proactive response time monitoring is essential to maintain top database performance. So-
larWinds DPA offers automated reports and alerts to help focus on improving response time,
while immediately warning users when significant performance degradation occurs. SolarWinds
DPA provides an extensive set of built-in reports and alerts. This robust alerts and reporting
framework:
»» Enables DPA to meet special business requirements
»» Provides reports that allow users to communicate their database status to people who do
not have direct access to DPA
»» Helps streamline record keeping and compliance
»» Delivers alerts 24/7 and notifications via email or an SNMP trap
»» With the most recent update to SolarWinds DPA, there are now more than 50 resource alerts,
as well as numerous wait time and administrative alerts. DPA also lets you create custom
alerts based on any SQL query
Click on the Alert link at the top right to configure and schedule alerts.
Screen 7: Custom Alerts in DPA
page 9EVALUATION GUIDE: Database Performance Analyzer
To schedule and configure reports, click on the link at the top right of the screen.
View the Guided Tour Video for
a walk-through of DPA
Screen 8: Create a new report
For questions or to schedule a free consultation with a database performance expert,
Call/Email us: Phone: 1.866.530.8100 Email: dpasales@solarwinds.com
page 10EVALUATION GUIDE: Database Performance Analyzer
WHY DPA IS A SMART INVESTMENT FOR YOUR TEAM
Prevent slowdowns before they impact your business
What is the cost of downtime (or a slow application) to your business per hour?
DPA lets you identify problems before they escalate and impact business operations—and the
bottom line. Dynamic baselines, wait time analysis, and custom reports allow your team to DPA Pricing Basics:
stay on top of application performance. When an application is down, your team will be able to »» SolarWinds DPA is licensed
quickly respond, and typically within 3-4 clicks, identify most problems in a database system by the number of instances
monitored
or in the systems that support it. Often, customers who have been trying to find the root cause
»» First year maintenance is
of performance issues for months, use DPA’s advanced correlation capabilities to find those included free
lurking problems in a few minutes. »» Floating licenses with dis-
counts for volume
»» The VM Option provides
Affordable cost of ownership
visibility into VMWare-based
How much is your team’s time worth? How much time (hours per month) would DPA have to resources
save your team to make it a worthwhile investment?
Starting at $1,9951 per instance, the cost of DPA per month over three years is just over $55
dollars a month—or $1.80 a day. For less than the cost of a coffee, DPA helps you run your
applications better and faster.
Complements traditional monitoring tools
How many hours does your team spend trying to find the root cause of problems across tools?
DPA is not a traditional performance monitoring tool. It is a performance analysis tool with a
unique approach: Multi-Dimensional Performance Analysis, an evolution of the wait-time analysis
methodology we pioneered 10 years ago. DPA is often used as a complementary solution to
traditional monitoring tools (i.e. Oracle, OEM, or SCCM) code-centric APM tools (App Dynamics
® ® ®
or NewRelic ) and database monitoring tools (Idera , Foglight , etc.). The insights and drill-down
capabilities that DBAs and application teams get from DPA are not available in any other tool.
Increased team productivity
How much time does your team spend writing, maintaining, and interpreting the information
of each script? Alerts and reports make it easy for teams to handle their workloads and spend
less time writing and maintaining scripts. Multi-Dimensional Performance Analysis does the
complex work for you, presenting a simple UI to quickly identify the root cause of a performance
problem. DBAs can support more applications and broaden their impact with the increased
effectiveness they gain from using DPA. It gives all application teams a single version of the
truth to focus on solving problems.
1 Currency is USD; price as of March 2017; SolarWinds reserves the right to change prices; Please contact a local SolarWinds sales representative to
find pricing specific for your jurisdiction.
page 11EVALUATION GUIDE: Database Performance Analyzer
Smarter hardware investment and better business decisions
Should you buy SSD drives or a bigger server? What do you virtualize? DPA Pricing
DPA helps you understand exactly how much time applications spend reading and writing to »» SolarWinds DPA for SQL
disks, waiting for the network, or waiting for the CPU, so you don’t have to guess. You will Server, MySQL, or Oracle
Standard Edition: License
know where you need to invest to accelerate application performance. Or, if no new hardware
starts at $1,995 USD
is needed and if bottlenecks can be resolved by fixing or improving code or database/system »» SolarWinds DPA for Oracle
configuration. With DPA, your team will have visibility into how virtualization resources and host/ Enterprise Edition, DB2, or
SAP ASE: License starts at
OS impact performance. It gives all application teams a single version of the truth to focus on
$3,495 USD
solving problems. »» SolarWinds DPA - VM Option:
License starts at $850 USD
Proactive optimization; not reactive troubleshooting
How do you get your team out of fire-fighting mode? DPA continuously analyzes application
performance and pinpoints areas that can be optimized, reduces bottlenecks, and improves ef-
ficiency. This can result in considerable cost savings in the future as well as avoid performance
problems or downtime.
Safe to use for everyone who needs to see how an application performs
Because DPA uses no agents, adds less than 1% load, and cannot make changes to a database, it
is safe for every team member to use it in production environments. Developers writing code can
see the impact of their code changes in production. Storage, virtualization, and system admins
can see how their system’s support applications perform and the impact of their changes. Ap-
plication teams can see where the applications are spending time across database operations.
What do other application professionals and DBAs think about DPA?
Read independent research facts here.
page 12EVALUATION GUIDE: Database Performance Analyzer
WHAT DO DBAS AND IT PROFESSIONALS THINK ABOUT DPA?
Today, thousands of customers with well over 100,000 instances depend on SolarWinds Database
Performance Analyzer (DPA) to manage their critical business applications.
Listen to what our customers have to say: Watch these videos
Collaboration is key to resolving Database Performance Problems
“My life is considerably easier because of DPA. I highly recommend it for any- Read About What
the Experts Think
body. It is clearly the best tool out there.”
Barry Duran – Principal SQL Server Architect »» Jeremy Kadlec’s review of
DPA for SQL Server
»» Kyle Hailey’s review of DPA
Database Performance in the Cloud and on Premise for Oracle
“We are using DPA with the Cloud and it is working flawlessly. DPA is unique in »» Pinal Dave’s Product Review
the market. I have never seen a product that is as powerful and yet as agnostic
across all major relational databases.”
Adam Japhet – IT Director
Database Performance Historical Analysis
“The nice thing about DPA is it really allows us to discern where the real issue
really is occurring.”
Leigh Freijo - Manager, Database Administration
Read more feedback on DPA from this TechValidate survey: http://bit.ly/DPAquotes
DPA case studies conducted by TechValidate: http://bit.ly/DPAcasestudies
page 13EVALUATION GUIDE: Database Performance Analyzer MORE ABOUT SOLARWINDS DATABASE PERFORMANCE ANALYZER SolarWinds provides powerful and affordable IT management software to customers world- wide, from Fortune 500® enterprises to small businesses, managed service providers (MSPs), government agencies, and educational institutions. We are committed to focusing exclusively on IT, MSP, and DevOps professionals, and strive to eliminate the complexity that our customers have been forced to accept from traditional enterprise software vendors. Regardless of where the IT asset or user sits, SolarWinds delivers products that are easy to find, buy, use, maintain, and scale while providing the power to address key areas of the infrastructure from on-premises to the cloud. This focus and commitment to excellence in end-to-end hybrid IT performance management has established SolarWinds as the worldwide leader in both network manage- ment software and MSP solutions, and is driving similar growth across the full spectrum of IT management software. Our solutions are rooted in our deep connection to our user base, which interacts in our THWACK® online community to solve problems, share technology and best practices, and directly participate in our product development process. Learn more today at www.solarwinds.com. Whether you are an experienced DBA or someone new to database performance, SolarWinds DPA makes it easy to solve complex database issues and optimize application response times, giving you the ability to: »» Quickly see what the problem is and how to fix it. »» Analyze and optimize existing hardware resources before investing in costly upgrades. »» Safely monitor SQL code performance in production. »» Maintain high performance during periods of rapid data growth. page 14
EVALUATION GUIDE: Database Performance Analyzer

ADDITIONAL RESOURCES:
»» Guided Tour Video: YouTube.com/watch?v=YC xwoqGIzfo

»» Administrative Guide: Administrator’s Guide

»» SolarWinds THWACK® Community: Solarwinds thwack online community adds value to IT pros

»» DPA on THWACK

»» Follow us on Twitter: @SolarWinds

For questions or to schedule a free consultation with a database performance expert,

Call/Email us: Phone: 1.866.530.8100 Email: dpasales@solarwinds.com

© 2017 SolarWinds Worldwide, LLC. All rights reserved.

The SolarWinds, SolarWinds & Design, Orion, and THWACK trademarks are the exclusive property of SolarWinds Worldwide, LLC
or its affiliates, are registered with the U.S. Patent and Trademark Office, and may be registered or pending registration in other
countries. All other SolarWinds trademarks, service marks, and logos may be common law marks or are registered or pending
registration. All other trademarks mentioned herein are used for identification purposes only and are trademarks of (and may
be registered trademarks) of their respective companies.

page 15
You can also read