Optimization of medium-low-grade phosphorus rock carbothermal reduction process by response surface methodology
←
→
Page content transcription
If your browser does not render page correctly, please read the page content below
Green Processing and Synthesis 2020; 9: 349–358
Research Article
Biwei Luo, Pengfei Li, Yan Li, Pengpeng He, Jun Ji, Dongsheng He, and Qifeng Tian*
Optimization of medium–low-grade phosphorus
rock carbothermal reduction process by
response surface methodology
https://doi.org/10.1515/gps-2020-0035 and phosphorus rock particle size; coke excess coefficient
received February 12, 2020; accepted May 14, 2020 and molar ratio of silicon–calcium; and coke excess
Abstract: Phosphorus extraction from phosphorus rock coefficient and phosphorus rock particle size. The optimum
was conducted by carbothermal reduction with silica and conditions in the experimental range are reaction time
coke. The effects of reaction temperature, reaction time, 92 min, reaction temperature 1340°C, coke excess coefficient
coke excess coefficient, molar ratio of silicon–calcium, and 1.27, molar ratio of silicon–calcium 1.28, and phosphorus
phosphorus rock particle size on the phosphorus reduction rock particle size 75–106 µm, which were derived from the
rate were investigated by the response surface methodology quadratic statistic model. Under these conditions, the
(RSM). The central composite design (CCD) with five factors phosphorus reduction rate can reach 96.88%, which is
and five levels was used to explore the effects of variables’ close to the model prediction value 99.40%. The optimized
interactions on the phosphorus reduction rate. The results carbothermal reduction conditions of phosphorus rock by
showed that there are significant interactions between the RSM are helpful to reduce the energy cost of thermal
reaction time and temperature; reaction temperature and phosphoric acid process.
molar ratio of silicon–calcium; reaction temperature Keywords: phosphorus rock, carbothermal reduction
reaction, response surface methodology, optimization
* Corresponding author: Qifeng Tian, School of Chemical
Engineering and Pharmacy, Wuhan Institute of Technology, Wuhan
430205, China; Key Laboratory of Green Chemical Process of
Ministry of Education and Key Laboratory of Novel Reactor and 1 Introduction
Green Chemical Technology of Hubei Province, Wuhan Institute of
Technology, Wuhan 430205, China, e-mail: qftian@wit.edu.cn; Yellow phosphorus is mainly obtained from phosphate ore,
tel: +86-27-6552-3795
coke, and silica by carbothermal reduction method in the
Biwei Luo: School of Chemical Engineering and Pharmacy, Wuhan
Institute of Technology, Wuhan 430205, China,
electric furnace, and the main components of the three raw
e-mail: yfnysryg@163.com materials are Ca5(PO4)3F, C, and SiO2, respectively. In this
Pengfei Li: School of Chemical Engineering and Pharmacy, Wuhan process, coke is mainly used as a reducing agent and
Institute of Technology, Wuhan 430205, China, conductor, whereas silica is mainly used as a flux to form
e-mail: ffsrlin@163.com stable silicate and promote the reduction reaction of
Yan Li: School of Chemical Engineering and Pharmacy,
phosphate [1–3]. The main reaction equation is shown in
Wuhan Institute of Technology, Wuhan 430205,
China, e-mail: li_yanyan@163.com Eq. 1:
Pengpeng He: School of Chemical Engineering and Pharmacy,
Ca5 (PO4)3 F + 15C + 9SiO2 = 3P2 (g) + 15CO (g)
Wuhan Institute of Technology, Wuhan 430205, China, (1)
e-mail: hedongpenga@163.com + 9CaSiO3 + CaF2
Jun Ji: School of Chemical Engineering and Pharmacy, Wuhan
Institute of Technology, Wuhan 430205, China; Key Laboratory of The phosphorus obtained by carbothermal reduction
Green Chemical Process of Ministry of Education and Key process is an irreplaceable raw material to produce phos-
Laboratory of Novel Reactor and Green Chemical Technology of phates and their derivatives. It is an important raw material for
Hubei Province, Wuhan Institute of Technology, Wuhan 430205,
producing food-grade, electronic-grade, and medical-grade
China, e-mail: sand_wing@163.com
phosphoric acid, as well as the basic raw material for
Dongsheng He: Xingfa School of Mining Engineering,
Wuhan Institute of Technology, Wuhan 430074, China, agricultural chemical products [4,5]. However, in order to
e-mail: hds@wit.edu.cn facilitate slag discharge, the operating temperature of yellow
Open Access. © 2020 Biwei Luo et al., published by De Gruyter. This work is licensed under the Creative Commons Attribution 4.0 Public
License.
350 Biwei Luo et al.
phosphorus production by the electric furnace process should ore decreases with the increase in the molar ratio of
be about 150°C higher than the melting point of the residue, silicon–calcium, and the decrease in the reduction rate is
and the power consumption is 13,000–15,000 kWh per ton, more significant when the molar ratio of silicon–calcium >2.
which makes it a typical huge energy consumption industry Li et al. [17] studied the growth behavior and size
[6,7]. Therefore, the development of an energy-saving characterization of metallic iron particles in coal-based
technology is vital to promote the sustainable development reduction of oolitic hematite–coal composite briquettes and
of yellow phosphorus industry. manifested that reduction temperature, time, and ore size
In China, medium- and low-grade phosphate ores are fraction strongly influenced the reduction. Li et al. [18]
the majority of phosphorus resources. The utilization studied the feasibility of potassium feldspar as a flux to
percentage of medium- and low-grade phosphorus re- reduce phosphate rock, and they found that when the coke
sources is lower than expected. Effective utilization of excess coefficient increased from 1.0 to 1.05, the reduction
medium- and low-grade phosphate ores is necessary to rate of phosphate rock increased from 95% to 99.61%. In
realize the sustainable development of phosphorus che- order to reduce the temperature (time) of the carbothermal
mical industry [8]. Phosphoric acid prepared by wet process reduction reaction and save energy, orthogonal experiments
of medium- and low-grade phosphate requires ore dressing, are mainly used by the current researchers to optimize the
and the purity of the prepared phosphoric acid is not high process conditions. When the reaction temperature is
enough, which leads to the subsequent complicated mainly in the range of 1,250–1,350°C and the reaction time
separation process [9]. Kiln phosphoric acid process is still is 60–120 min, the reduction rate of phosphate ore could
in the research stage due to its immature technology [10]. usually reach 40–95%. From the above description, one can
Medium- and low-grade phosphate ores can be directly see that in addition to reaction temperature and time, coke
used in the thermal process of phosphoric acid to obtain excess coefficient, molar ratio of silicon–calcium, and
high-purity phosphoric acid. The huge energy consumption phosphorus rock particle size are other pivotal factors to
is its main disadvantage [4,11]. Therefore, reducing energy determine the reduction rate of phosphorus ore. In this
consumption is an important issue in thermal phosphoric paper, these five factors are chosen to study their effects on
acid process. the phosphorus reduction rate.
Many studies on thermal phosphoric acid technology The response surface methodology (RSM) is a relatively
have been carried out. Jiang et al. [12] studied the kinetics of scientific and efficient parameter optimization method, which
fluorapatite carbothermal reduction reaction. After reaction is widely used in chemical, agricultural, pharmaceutical,
at 1,250°C for 60 min, the reduction rate of fluorapatite environmental, and mechanical engineering fields. This
reached about 48%. The reaction at 1,300°C for 60 min method is simple and efficient, especially for studying the
resulted in a reduction rate of 76%. Li et al. [13] found that a interaction between several experimental factors. Compared
reduction rate of 98.9% with medium- and low-grade with single-factor optimization, the response surface metho-
phosphate ores was approached at 1,550°C for 60 min and dology has the advantages of fewer experiments, accurate
the reaction temperature is the most important factor that prediction, and the ability to study the interaction between
influences the reduction rate of phosphate ore. Cao et al. several factors at the same time [19], which makes this
[14] added a certain amount of alkali metals to enhance the method better than the traditional orthogonal methodologies.
activity of carbon and the reduction rate of phosphorus In this paper, based on single-factor experiment and literature
rock. By adding 1.5% K2CO3 and reacting at 1,300°C for research, the response surface methodology is used to
60 min, the reduction rate of phosphorus rock was optimize the process variables (reaction temperature, reaction
increased to 67%. When the reaction time was prolonged time, coke excess coefficient, molar ratio of silicon–calcium,
to 4 h, the reduction rate of phosphorus rock could reach and phosphorus rock particle size) of carbothermal reduction
91.32%. Yang et al. [15] revealed that the carbothermal reaction of phosphorus rock to improve the energy efficiency
reduction reaction of fluorapatite promoted by Al2O3 mainly of thermal phosphoric acid process.
occurred in the low-temperature zone and at the initial stage
of the reaction. The reaction was conducted at 1,250°C for
50 min, and the reduction rate of phosphorus rock can be 2 Materials and methods
increased from 65% to 75% by adding Al2O3. Li et al. [16]
used medium- and low-grade phosphorus rocks with high The phosphorus rock used in the experiments was from
content of calcium to react at 1,300°C for 210 min, and the Yichang, Hubei Province. PANalytical Axios wavelength-
reduction rate of phosphorus rock could reach more than dispersive X-ray fluorescence spectrometer was used to
94%. They proposed that the reduction rate of phosphate determine the composition of the phosphorus rock. The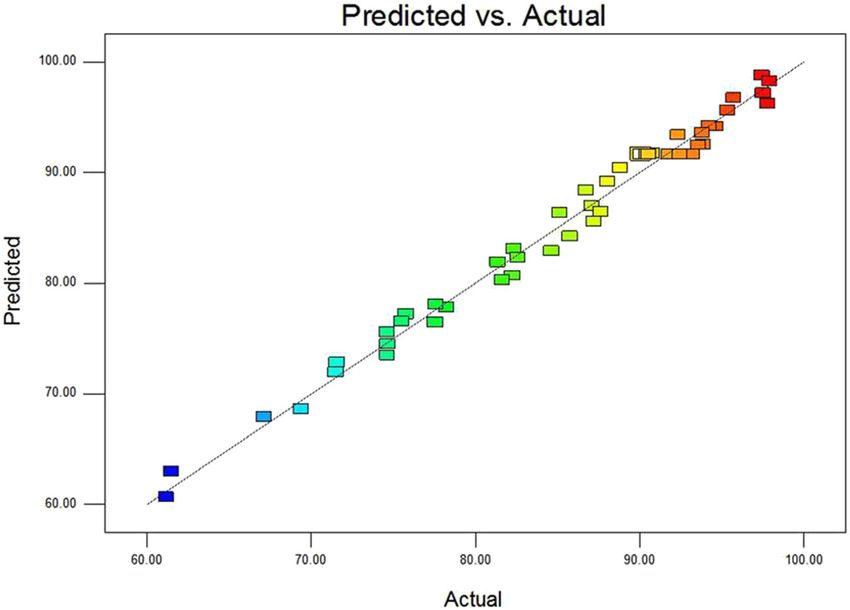
Optimization of phosphorus rock carbothermal reduction process 351
Table 1: The main chemical components of the phosphorus rock (%wt) Table 2: Analysis of the industrial coke (%wt)
Composition P2O5 CaO SiO2 MgO Fe2O3 Al2O3 F Fixed carbon Ash Volatile matter Moisture
of ore
82.03 9.27 4.15 4.55
W (%) 19.58 42.23 25.33 7.17 1.45 1.3 1.45
100% as the most phosphates had reacted out. Considering
main chemical components are shown in Table 1. The the reduction rate and economic cost, the reaction time in
industrial analysis of the reducing agent coke is shown the RSM experiments is in the range of 30–120 min.
in Table 2. Silica (analytical purity) was supplied by As shown in Figure 1b, the reduction rate increases
Sinopharm Chemical Reagent Co. Ltd. gradually with the reaction temperature. When the tempera-
The phosphorus rock powder was mixed with coke and ture is above 1,300°C, the reduction rate increases slowly and
silica powders, which passed 200-mesh sieve evenly becomes stable. From the point of view of thermodynamics,
according to the designed ratio, pressed into several φ 15 × the increase in the temperature provided a favorable thermo-
3 mm flakes under 5 MPa, and then dried for further use. dynamics condition and promoted phosphorus rock reduction.
5–6 g of dried sample was placed in a graphite crucible and Considering the reduction rate and application feasibility, the
heated in the LFT-1600 tube furnace, with the rate of flow of RSM experiments were conducted at 1,200–1,400°C.
nitrogen of 80 mL min−1 for 30 min. Under the protection of Considering the effects of the amount of reduction
nitrogen, the temperature was elevated at a rate of 5°C min−1 agent coke on the reduction rate, the relation between
to a specified temperature. After the reaction ended, the slag different coke excess coefficients and the reduction rate is
was removed from the graphite crucible after cooling to room demonstrated in Figure 1c, which shows that the reduction
temperature. After ground through 200-mesh sieves, the rate increases with CEC. In order to study the effects of coke
residue was used for the analysis of the content of P2O5 and excess coefficient on the reduction rate comprehensively,
further characterization. The phosphorus rock particle size the coke excess coefficient (CEC) was set in the range of
was determined using sieves with different meshes. 0.80–1.60 in the RSM experiments.
The content of P2O5 in the residue was analyzed by The effects of molar ratio of silicon–calcium (Si/Ca) on
gravimetric method with quinoline phosphomolybdate the reduction rate and the results are shown in Figure 1d.
as agent. The phosphorus rock reduction rate (Y) was One can see that the reduction rate increases first and then
calculated according to Eq. 2: decreases with the increase in the molar ratio of
silicon–calcium (Si/Ca). In the process of phosphorus
M0 w0 − M1 w1 production, silica is used as a flux to reduce the reaction
Y= (2)
M0 w0 temperature. The melting point of slag usually depends on
where M0 and M1 are the mass of samples before and the value of silicon–calcium ratio. The amount of silica
after the reaction and w0 and w1 are the mass fraction of should not be too high to prevent side reactions from
P2O5 before and after the reaction, respectively. occurring. The molar ratio of silicon–calcium (Si/Ca) was
The reaction time (A), reaction temperature (B), coke set in the range of 0.80–1.60 in the RSM experiments.
excess coefficient (C), molar ratio of silicon–calcium (D), and The phosphorus rock particle size influences the heat
phosphorus rock particle size (E) were the factors and the and mass conduction and thereby the reduction rate. Figure
phosphorus reduction rate (Y) was the response value in this 1e shows that the reduction rate increases first and then
paper. decreases with the decrease in the phosphorus rock particle
size. When the phosphorus rock particle size is in the range
of 75–106 µm, the reduction rate is the highest in the single-
factor investigation experiments. Therefore, five different
3 Results and discussion
particle sizes of 0–48 µm, 48–75 µm, 75–106 µm, 106–150 µm,
and 150–270 µm were chosen in the RSM experiments.
3.1 Single-factor investigation
3.2 Optimization of reaction conditions
The results of the single-factor investigation are displayed in by RSM
Figure 1. The results in Figure 1a show that the reduction rate
increases with the reaction time. When the reaction time Based on the literature investigation and previous single-
continues to extend, the reduction rate will tend to close to factor experiments, reaction time (A, 30–120 min), reaction352 Biwei Luo et al.
Figure 1: Influence of various factors on the reduction rate. (a) Fixed levels B (1,300°C), C (1.20), D (1.20), E (75–106 µm). (b) Fixed levels A
(75 min), C (1.20), D (1.20), E (75–106 µm). (c) Fixed levels A (75 min), B (1,300°C), D (1.20), E (75–106 µm). (d) Fixed levels A (75 min), B
(1,300°C), C (1.20), E (75–106 µm). (e) Fixed levels A (75 min), B (1,300°C), C (1.20), D (1.20).
temperature (B, 1,200–1,400°C), coke excess coefficient (C, 3.3 Quadratic regression fitting and the
0.8–1.60), molar ratio of silicon–calcium (D, 0.8–1.60), and result of variance analysis
phosphate particle size (E, 0–270 µm) were chosen as factors
to pursue the best reduction rate of phosphorus rock. The The experimental results were fitted to various models
central composite design (CCD) with five factors and five (linear, interactive (2FI), quadratic, and cubic) to get
levels was conducted by Design-Expert 8.0.6 software as regression equation. Three different tests, namely the
shown in Table 3. The optimum conditions for phosphorus sequential model sum of squares, lack-of-fit tests, and
rock carbothermal reduction were obtained by the response model summary statistics, were conducted in this paper
surface methodology. to determine the adequacy of various models to
Through CCD procedure, the detailed fifty experiments represent the maximum reduction rate of phosphorus
with five different factors and levels were generated and rock, and the results are listed in Table 5. The fit
are shown in Table 4. The phosphate reduction rates of 50 summary output indicated that the quadratic polynomial
runs of the experiments are also displayed in Table 4, and model was significant for the present system as shown in
the reduction rate was obtained in the range of Table 5, while the interaction of two factors (2FI) and the
61.18% to 97.90%. linear model were suggested to be insignificant. As
Table 3: Factors and coding levels of response surface analysis
Factor Coded Coding level
−α Low (−1) Central (0) High (+1) +α
Reaction time (min) A 30 56 75 94 120
Temperature (°C) B 1,200 1,258 1,300 1,342 1,400
CEC C 0.8 1.03 1.20 1.37 1.60
Si/Ca D 0.8 1.03 1.20 1.37 1.60
Phosphorus rock particle size (µm) E 150–270 106–150 75–106 48–75 0–48Optimization of phosphorus rock carbothermal reduction process 353
Table 4: Conditions and results of fifty CCD experiments
Run Variables Response
Time Temperature (°C) Carbon excess Molar ratio of Phosphorus rock particle Reduction
(min) coefficient silicon–calcium size (µm) rate (%)
A B C D E Y
1 56 1,342 1.37 1.03 106–150 87.09
2 56 1,342 1.03 1.37 106–150 94.62
3 75 1,300 1.20 1.20 0–48 71.56
4 56 1,258 1.37 1.03 106–150 74.65
5 94 1,342 1.03 1.37 106–150 97.46
6 75 1,300 1.20 1.20 75–106 90.52
7 56 1,342 1.37 1.03 48–75 88.05
8 94 1,258 1.03 1.03 106–150 82.26
9 75 1,300 1.20 1.20 75–106 93.22
10 75 1,300 1.20 1.20 75–106 92.46
11 94 1,342 1.03 1.37 48–75 93.79
12 120 1,300 1.20 1.20 75–106 92.34
13 75 1,300 0.80 1.20 75–106 82.58
14 75 1,400 1.20 1.20 75–106 97.80
15 94 1,258 1.37 1.03 48–75 82.35
16 75 1,300 1.20 1.20 75–106 92.73
17 94 1,342 1.37 1.03 48–75 93.85
18 94 1,342 1.37 1.37 48–75 97.90
19 94 1,258 1.03 1.37 48–75 77.60
20 56 1,258 1.03 1.37 106–150 74.62
21 75 1,300 1.20 1.20 75–106 92.08
22 94 1,342 1.03 1.03 106–150 86.75
23 94 1,342 1.03 1.03 48–75 84.63
24 56 1,258 1.37 1.37 106–150 75.78
25 75 1,300 1.20 1.20 150–270 81.63
26 56 1,258 1.03 1.37 48–75 69.40
27 94 1,258 1.37 1.03 106–150 87.20
28 30 1,300 1.20 1.20 75–106 77.56
29 56 1,342 1.03 1.03 48–75 78.23
30 56 1,258 1.03 1.03 48–75 61.18
31 56 1,258 1.37 1.37 48–75 77.56
32 94 1,258 1.37 1.37 106–150 85.13
33 56 1,258 1.03 1.03 106–150 67.16
34 94 1,258 1.03 1.37 106–150 87.65
35 75 1,300 1.20 1.20 75–106 90.06
36 75 1,200 1.20 1.20 75–106 61.49
37 56 1,342 1.37 1.37 106–150 94.24
38 94 1,342 1.37 1.03 106–150 90.75
39 75 1,300 1.20 1.20 75–106 91.81
40 56 1,342 1.03 1.03 106–150 81.36
41 75 1,300 1.20 1.20 75–106 90.45
42 75 1,300 1.60 1.20 75–106 95.37
43 75 1,300 1.20 1.60 75–106 93.59
44 56 1,342 1.37 1.37 48–75 95.73
45 94 1,258 1.37 1.37 48–75 85.76
46 94 1,342 1.37 1.37 106–150 97.53
47 56 1,342 1.03 1.37 48–75 88.82
48 56 1,258 1.37 1.03 48–75 74.64
49 94 1,258 1.03 1.03 48–75 71.5
50 75 1,300 1.20 0.80 75–106 75.53354 Biwei Luo et al.
Table 5: Fit summary output as the sequential model sum of squares, lack-of-fit tests, and model summary statistics
Source Sum of squares df Mean square F-value p-value Remarks
prob > F
Sequential model sum of squares
Mean vs total 3.61 × 10⁵ 1 3.61 × 10⁵
Linear vs Mean 3.59 × 10³ 5 7.19 × 10² 32.55 D > C > E. The effect order of the interaction items on
p-values as compared to quadratic model. Cubic model the reduction rate (Y) is CE > AB > CD > BD > BE.
was found to be aliased. Therefore, the quadratic model The data shown in Table 4 were regressed by Design-
including linear, interactive, and quadratic terms was Expert 8.0.6, and the derived quadratic polynomial
chosen to describe the effects of process variables on the model equation includes the reaction time (A), reaction
reduction rate of phosphorus rock. temperature (B), coke excess coefficient (C), molar
Furthermore, the analysis of variance (ANOVA) was ratio of silicon to calcium (D), phosphorus rock particle
used to evaluate the adequacy of the model equation. size €, and the reduction rate of phosphorus rock
ANOVA evaluations of the model, including its variables (Y). Combined with ANOVA results in Table 6 and
and their interactions, are given in Table 6. As can be removing insignificant items from the model, the
seen from Table 6, the effects of the reaction time (A), obtained quadratic polynomial model equation is as
reaction temperature (B), coke excess coefficient (C), follows:
molar ratio of silicon to calcium (D), and phosphorus
Y = 9.166 + 3.56A + 6.99B + 2.81C + 3.35D − 1.55E
rock particle size (E) on the reduction rate of phosphorus − 1.56AB + 1.15BD + 0.80BE − 1.205CD + 1.57CE (3)
rock (Y) are all significant because their prob >F-values − 1.19A2 − 2.13B2 − 0.48C2 − 1.206D 2 − 2.67E2
for phosphorus rock reduction rate (Y) are all lower than
0.05 (p value < 0.05), indicating that these factors are Figure 2 shows the relationship between the pre-
significant [20–22]. In addition, the interactions A–B, dicted and actual reduction rates of phosphorus rock. As
B–D, B–E, C–D, and C–E are also significant because can be seen from the diagram, most of the actual values
their prob >F-values are also below 0.05. In the analysis are close to the predicted values, and a few of the actual
of variance, the larger the F-value of the variable(s) and values fall on both sides of the predicted values
their interaction item is, the greater influence of those symmetrically, indicating that the model fits the actual
item(s) on the response value is [23]. Therefore, the responses well. Table 5 gives the R2 = 0.988, which
sequence of the effect of various factors on the means the model can explain 98.8% of the variation ofOptimization of phosphorus rock carbothermal reduction process 355
Table 6: Analysis of variance for the regression model
Source Sum of df Mean F-value p-value Remarks
squares square prob > F
Model 4509.18 20 225.46 114.46356 Biwei Luo et al.
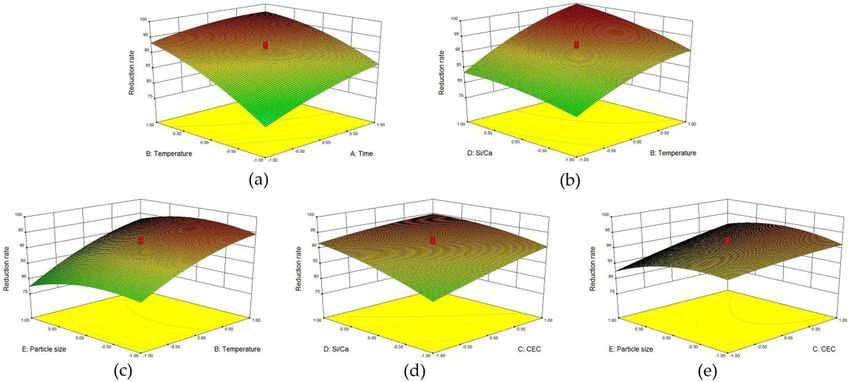
Figure 3: Response surface plot showing the effects on the reduction rate. (a) Fixed levels C (1.20), D (1.20), E (75–106 µm). (b) Fixed levels
A (75 min), C (1.20), E (75–106 µm). (c) Fixed levels A (75 min), C (1.20), D (1.20). (d) Fixed levels A (75 min), B (1,300°C), E (75–106 µm). (e)
Fixed levels A (75 min), B (1,300°C), D (1.20).
reflects that the reaction temperature affects the reduction calcium is shown in Figure 3d, indicating that the reduction
rate stronger than the phosphorus rock particle size. rate increases with increasing coke excess coefficient and
The 3D response surface plot based on the independent molar ratio of silicon–calcium. The molar ratio of silicon to
variables coke excess coefficient and molar ratio of silicon to calcium is obviously a stronger factor of the reduction rate
Figure 4: Contour plot showing the effects on reduction rate. (a) Fixed levels C (1.20), D (1.20), E (75–106 µm). (b) Fixed levels A (75 min), C
(1.20), E (75–106 µm). (c) Fixed levels A (75 min), C (1.20), D (1.20). (d) Fixed levels A (75 min), B (1,300°C), E (75–106 µm). (e) Fixed levels A
(75 min), B (1,300°C), D (1.20).Optimization of phosphorus rock carbothermal reduction process 357
Silicon, 2019, DOI: 10.1007/s12633-019-00311-5
than the coke excess coefficient, which can be found in
Phosphorus, sulfur, and silicon 2018;193:141–8
Figure 4d.
Figure 3e gives the 3D response surface plot at
Adv. Mater. Res. 2012;361–363:268–74
varying phosphorus rock particle sizes and coke excess
Mater. Res. Express 2019;6:075513
coefficients. It shows that the reduction rate increases
with increasing coke excess coefficient. However, the
reduction rate increased to a certain level and then
Silicon 2019;11:2829–36
Silicon 2020;12:613–20
decreased with decreasing phosphorus rock particle size.
It can be seen from Figure 4e that the influence of coke
excess coefficient on the reduction rate is slightly
stronger than that of phosphorus rock particle size.
Reference
3.4 Response surface optimization
G. Zheng et al.
Z. Chen et al.
validation test results
R. Cao et al.
Q. Wu et al.
Y. Liu et al.
This study
Y. Li et al.
Authors
Under the prediction result of the CCD model, the
theoretical optimum reduction conditions and the result
Reduction rate (%)
are as follows: reaction time 92 min, reaction tempera-
ture 1,340°C, coke excess coefficient 1.27, molar ratio of
silicon–calcium 1.28, phosphorus rock particle size
75–106 µm, and the maximum reduction rate 99.40%.
96.88
90.68
94.84
92.77
96.8
In order to test the accuracy of the model, the reduction
78
90
rate of phosphorus rock is 96.88% under the optimum
reduction conditions. The deviation from the predicted
Potassium feldspar and K2CO3
value is only 2.52%, which implies the model can predict
the experimental results well. Based on the investigation
of the related literature, the reduction rate is close to or
higher than most of the reported values in the literature.
Methyl cellulose
In order to illustrate the innovation and the
K2CO3–NiSO4
significant improvement of this study, similar reports
Additives
about phosphorus rock carbothermal reduction were
NiSO4
searched. Their reaction conditions and results are listed
in Table 7. It can be seen that our optimized conditions
Table 7: Comparison with the results of similar literature
of phosphorus rock carbothermal reduction are relatively
1.28
0.67
CEC
1.6
1.5
1.1
1.1
mild and the reduction rate is fairly good as compared to
the other published results.
Si/Ca
1.27
0.8
1.1
1.1
Time (min)
4 Conclusions
60
240
60
240
40
40
92
The process conditions of carbothermal reduction of
medium- and low-grade phosphorus rocks were opti-
Temperature (°C)
mized by the response surface methodology. The effects
of reaction time, reaction temperature, coke excess
coefficient, molar ratio of silicon to calcium, and
phosphorus rock particle size on the reduction rate of
1,400
1,300
1,300
1,300
1,340
1,350
1,350
phosphorus rock were investigated. The optimum358 Biwei Luo et al.
conditions are as follows: reaction time 92 min, reaction [6] Tang A, Jiang D, Chen H. Numerical simulation of phosphorus
temperature 1,340°C, coke excess coefficient 1.27, molar furnace. Phosphate Compound Fertilizer. 2011;26:42–5.
ratio of silicon–calcium 1.28, and phosphorus rock [7] Geng R, Xia J, Chen Z. Effects of potassium feldspar on
slagging and fluxing in phosphorus produced via electric
particle size 75–106 µm. Under these conditions, the
furnace. Phosphorus Sulfur and Silicon Relat Elem.
reduction rate of phosphorus rock (96.88%) is close to 2017;192:475–80.
the predicted value (99.40%). The reduction rate of [8] Xue K, Zhang R. Research progress on phosphate resource
phosphorus rock in this paper is close to or higher than distribution and metallogenic characteristics in China. Acta
most of the reported results in the literature, which Mineral Sin. 2019;39:7–14.
[9] Kijkowska R, Kowalski Z, Pawlowska-Kozinska D, Wzorek Z,
provides the experimental basis for energy saving and
Gorazda K. Tripolyphosphate made from wet-process phos-
consumption reduction in thermal phosphoric acid phoric acid with the use of a rotary kiln. Ind Eng Chem Res.
process. 2008;47:6821–7.
[10] Lv L, Liang B, Liu Q. Back adsorption process of calcium
Acknowledgments: This study was supported by phosphate to P2O5 in kiln phosphoric acid. J Chem Ind Eng.
2016;67:4399–405.
National Natural Science Foundation of China (No.
[11] Chen S. Summary of comprehensive utilization of phosphorus
51474160). The authors would like to acknowledge the
by-products from electric furnace in China. Sulphur
scientific support provided by Wuhan Institute of Phosphorus Bulk Mater Handling Relat Eng. 2011;5:44–8.
Technology and National Natural Science Foundation [12] Jiang L, Liang B. Kinetics of hot carbon reduction of
of China (No. 51474160). fluorapatite. J Univ Sci Techno Chengdu. 1995;5:1–8.
[13] Li X, Hu B, Wu Y. Process and kinetics of reduction of middle
and low-grade phosphate ore by fusion method. J Chem Eng
Author contributions: J. J. and Q. T. developed the idea of
Chin Univ. 2014;28:905–10.
this research and made the problem formulation; B. L., P. [14] Cao R, Xia J, Li W. Effect of alkali metal carbonate on
L., and Y. L. derived the formulas, made the calculations, carbothermal reduction of phosphorus rock. J Chem Eng Chin
performed the simulation, and prepared the initial draft of Univ. 2018;32:568–76.
the paper; and Q. T. oversaw all aspects of the research, [15] Yang J, Chen J, Liu H. Process analysis of solid phase
data analysis, and writing and revised this manuscript. All carbothermal reduction of fluoroapatite with aluminum
impurities. J Sichuan Univ Eng Sci Ed. 2015;47:186–91.
authors have discussed the results and approved the final
[16] Li L, Yan Y, Hu Z. Investigation on reduction of low phosphorite
version of the paper. All authors have read and agreed to with high calcium to silica ratio by the kiln method and the
publish this version of the manuscript. pozzolanic activity of the calcining residue. J Wuhan Univ
Technol. 2014;36:11–6.
Conflict of interest: The authors declare no conflict of [17] Li Y, Han Y, Sun Y, Gao P, Li Y, Gong G. Growth behavior and
size characterization of metallic iron particles in coal-based
interest.
reduction of oolitic hematite-coal composite briquettes.
Minerals. 2018;8:177.
[18] Li Y, Xia J, Chen Z,. Feasibility study on potassium feldspar as
flux to reduce phosphate ore. Bull Chin Ceram Soc.
References 2017;8:2737–42.
[19] Long Y, Tan F, Yang K. Investigation Response surface
optimization of process parameters for LiFePO4/C preparation
[1] Wang Z, Jiang M, Ning P. Thermodynamic modelling with a low temperature carbothermal reduction method. J
and gaseous pollution prediction of the yellow Chem Eng Chin Univ. 2013;27:125–30.
phosphorus production. Ind Eng Chem Res. [20] Verma P, Agrawal US, Sharma AK, Sarkar BC, Sharma HK.
2011;50:12194–202. Optimization of process parameters for the development of a
[2] Li X, Hu B, Wu Y. Reaction kinetics of phosphate ore with cheese analogue from pigeon pea (Cajanus cajan) and
carbon by smelting reduction technology. Chem Eng. soymilk using response surface methodology. Int J Dairy
2013;41:53–6. Technol. 2005;58:51–8.
[3] Zhong B, Chen L, Li J. New progress in purification of wet- [21] Luo Y, Zhang W, Li J. Optimization of uranium removal from
process phosphoric acid by solvent extraction. Chem Ind Eng uranium plant wastewater by response surface methodology
Prog. 2005;24:592–602. (RSM). Green Proc Synth. 2019;8:808–13.
[4] Wang X, Tang L, Jiang Z. Numerical simulation of Venturi [22] Ma H, Yan C, Wang Y, Xie H. Statistical analysis and
ejector reactor in yellow phosphorus purification system. Nucl optimization of recovering indium from jarosite residue with
Eng Des. 2014;268:18–23. vacuum carbothermic reduction by response surface metho-
[5] Ma L, Ning P, Zang Y. Experimental and modeling of fixed-bed dology (RSM). Green Proc Synth. 2017;6:211–6.
reactor for yellow phosphorous tail gas purification over [23] Guo R, Li X, Huo W, Feng W, Liu X, Gao W. Optimization of
impregnated activated carbon. Chem Eng J. 2008;137: synthesis of bisphenol A formaldehyde phenolic resin by
471–9. response surface methodology. China Adhes. 2019;2:1–3.You can also read