Did the Countrywide Lockdown act like a catalyst in turning a cyclone into a Super-cyclone AMPHAN?

 
CONTINUE READING
Did the Countrywide Lockdown act like a catalyst in turning a cyclone into a Super-cyclone AMPHAN?
Did the Countrywide Lockdown act like a catalyst in turning a
                                                                                                                                                                            cyclone into a Super-cyclone AMPHAN?
                                                                                                                                                                            Amit Kumar Chowdhury1 , Arnab Mondal1 , Suvendu Manna1 , Paulami Ghosh1 , and
                                                                                                                                                                            Surajit Mondal1
                                                                                                                                                                            1
                                                                                                                                                                                Affiliation not available

                                                                                                                                                                            August 16, 2021

                                                                                                                                                                            Amit K. Chowdhury1 , Arnab Mondal2 , Suvendu Manna3 , Paulami Ghosh4 , Surajit Mondal5
Posted on Authorea 16 Aug 2021 — CC-BY 4.0 — https://doi.org/10.22541/au.162912528.89970116/v1 — This a preprint and has not been peer reviewed. Data may be preliminary.

                                                                                                                                                                            1
                                                                                                                                                                                Power System Operation Corporation Ltd.
                                                                                                                                                                            2
                                                                                                                                                                                CSIR-National Physical Laboratory, Dr. KS Krishnan Marg, New Delhi, India
                                                                                                                                                                            3
                                                                                                                                                                                Dept. of Heath Safety and Environment, School of Engineering, UPES, Dehradun
                                                                                                                                                                            4
                                                                                                                                                                                Dept. of Microbiology, School of Heath Science, UPES, Dehradun
                                                                                                                                                                            5
                                                                                                                                                                                Dept. of Electrical and Electronics Engineering, School of Engineering, UPES, Dehradun
                                                                                                                                                                            Abstract :
                                                                                                                                                                            Amid the CoVID-19 pandemic and country-wide lockdown, the super-cyclone Amphan collided with the
                                                                                                                                                                            eastern coast of India, hitting mainly the Indian state of West Bengal. This article tried to find an answer to
                                                                                                                                                                            such a devastating super cyclone during the pandemic-related lockdown. Although lockdown restricts almost
                                                                                                                                                                            all types of industrial emission known for increasing the average surface temperature, the temperature profile
                                                                                                                                                                            indicated no indication of temperature fall during the entire lockdown. Moreover, the temperature profile
                                                                                                                                                                            indicated that during the lockdown period the average sea surface temperature was much higher than the
                                                                                                                                                                            last five years. This suggested that this unexpected increase in sea-surface temperature might play a major
                                                                                                                                                                            role in the formation of super cyclone Amphan. This temperature increase could be attributed to the sudden
                                                                                                                                                                            lowering of criteria pollutants like aerosol concentration due to lockdown. This might have an indirect impact
                                                                                                                                                                            on the formation of a super-cyclone as it increased the radiative budget of the earth. The increment in the
                                                                                                                                                                            radiative budget might have increased sea surface temperature that caused the transformation of a cyclonic
                                                                                                                                                                            depression into a super-cyclonic storm Amphan.
                                                                                                                                                                            Keywords: CoVID-19; Lockdown; Pandemic; SuCS Amphan; Tropical Cyclone
                                                                                                                                                                            Introduction:
                                                                                                                                                                            The origin of tropical cyclones is one of the unexplained phenomena in dynamical metrology and climate
                                                                                                                                                                            (Dunkerton et al., 2009; K. Emanuel, 2003). Tropical cyclone primarily originates over the tropical ocean
                                                                                                                                                                            area and is driven by the heat transfer from the ocean (K. Emanuel, 2003). The formation of a tropical
                                                                                                                                                                            cyclone is due to the disturbance occurring near the center of a precursor disturbance in which the inner
                                                                                                                                                                            stability is high and flow is in near solid-body rotation. A typical tropical cyclone could be characterized by
                                                                                                                                                                            having a low-pressure center with a low level of atmospheric circulation, accompanied by rapidly rotating
                                                                                                                                                                            strong wind and spirally arranged thunderstorms that produce heavy rain or squalls. The study of the
                                                                                                                                                                            intensity of the cyclones is of paramount importance as it decides the area and number of people getting
                                                                                                                                                                            affected by its impact on the coast. Many concerns are raised on the probable impact of global warming

                                                                                                                                                                                                                                  1
Did the Countrywide Lockdown act like a catalyst in turning a cyclone into a Super-cyclone AMPHAN?
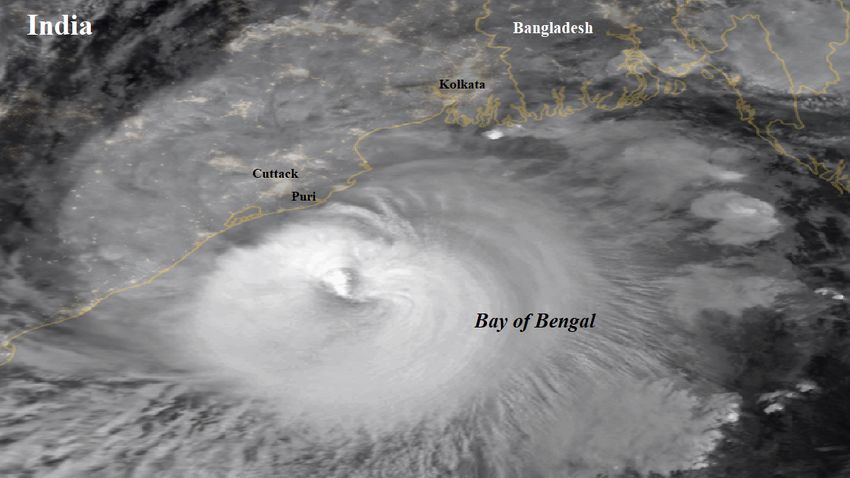
on the intensity of cyclones (K. Emanuel, 2005). The cyclones form over the oceans when the sea-surface
                                                                                                                                                                            temperature exceeds the threshold temperature of 25.5 o C below which the cyclone does not form (Tory &
                                                                                                                                                                            Dare, 2015). With an upsurge of about 1o C in tropical ocean surface temperature, the wind speed of the
                                                                                                                                                                            cyclone theoretically increases by ˜5% (K. A. Emanuel, 1987). Satheesh & Ramanathan (2000) estimated
                                                                                                                                                                            that the presence of aerosols over the Indian ocean surge the top of the atmosphere’s reflected radiation by
                                                                                                                                                                            ˜10 Wm-2 which results in the decrease of surface’s reaching radiation by ˜29 Wm-2 . The decrease in the
                                                                                                                                                                            aerosol concentration due to the effect of the pandemic has resulted in more solar radiation reaching the
                                                                                                                                                                            surface of the ocean which in turn triggered the ocean surface temperature to increase significantly. Figure
                                                                                                                                                                            1 shows the image of the tropical cyclone Amphan taken from space.
Posted on Authorea 16 Aug 2021 — CC-BY 4.0 — https://doi.org/10.22541/au.162912528.89970116/v1 — This a preprint and has not been peer reviewed. Data may be preliminary.

                                                                                                                                                                            Figure 1: Tropical cyclone Amphan image taken from Terra-MODIS (Source: NASA Earth Observatory;
                                                                                                                                                                            https://earthobservatory.nasa.gov)
                                                                                                                                                                            Cyclone Categories :
                                                                                                                                                                            The tropical cyclones are primarily classified based on their speed and the relative damage caused upon
                                                                                                                                                                            collision with the landmass. The eye of the cyclone is characterized by intense low-pressure areas with warm
                                                                                                                                                                            temperatures with the pressure gradually increasing on the outer side. The amount of pressure drop at the
                                                                                                                                                                            eye is directly proportional to the strength of the cyclone. The Indian Meteorological Department (IMD)
                                                                                                                                                                            classifies cyclones into 7 categories based on their associated wind speed (see Table 1 ).
                                                                                                                                                                            Table 1: Classification of tropical cyclones based on their associated wind speed

                                                                                                                                                                                        S. No.    Type of disturbances                  Associated wind speed (kmph)
                                                                                                                                                                                        1         Low pressure area (LPA)               < 31 kmph
                                                                                                                                                                                        2         Depression (D)                        31 – 49 kmph
                                                                                                                                                                                        3         Deep depression (DD)                  50 – 61 kmph
                                                                                                                                                                                        4         Cyclonic storm (CS)                   62 – 88 kmph
                                                                                                                                                                                        5         Severe cyclonic storm (SCS)           89 – 118 kmph
                                                                                                                                                                                        6         Very severe cyclonic storm (VSCS)     119 – 221 kmph
                                                                                                                                                                                        7         Super cyclonic storm (SuCS)           > 222 kmph

                                                                                                                                                                            Super-cyclone Amphan :
                                                                                                                                                                            SuCS Amphan was one of the most powerful and deadly tropical cyclones that had hit the eastern part of

                                                                                                                                                                                                                                 2
Did the Countrywide Lockdown act like a catalyst in turning a cyclone into a Super-cyclone AMPHAN?
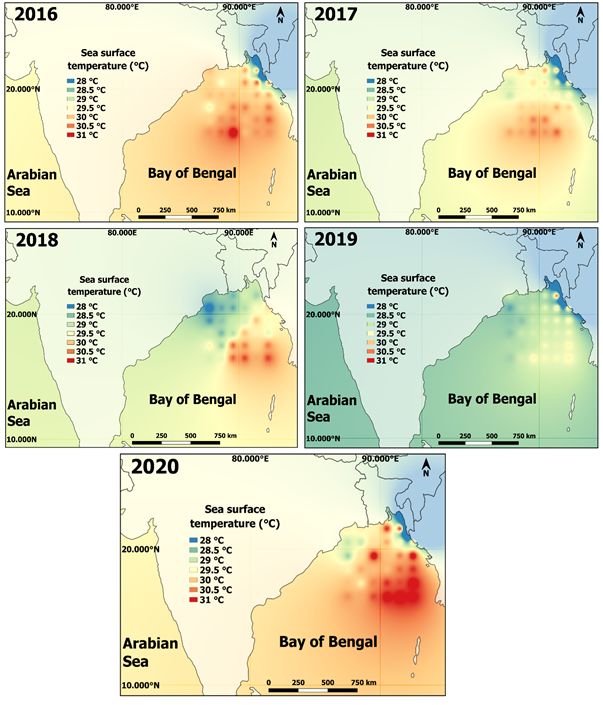
India causing havoc especially in West Bengal and parts of Bangladesh on 20th May 2020. It was estimated
                                                                                                                                                                            that the SuCS Amphan caused huge damages to the public and private properties. Amphan originated as a
                                                                                                                                                                            depression (D) over the south-eastern Bay of Bengal (BoB) on the early morning of 16th May 2020 and later
                                                                                                                                                                            transformed into a cyclonic storm (CS) by the evening. While moving north-northwestwards, it intensified
                                                                                                                                                                            as a severe cyclonic storm (SCS) over southeast BoB on 17th May 2020. The maximum speed of Amphan
                                                                                                                                                                            was recorded to be 260 kmph (SuCS) but the intensity gradually decreased to very severe cyclonic storm
                                                                                                                                                                            (VSCS) during the onset on the landmass of West Bengal. The Amphan had hit the coast of West Bengal
                                                                                                                                                                            at the speed of 155-165 kmph which gusted to 185 kmph.
                                                                                                                                                                            Discussion:
                                                                                                                                                                            Sea surface temperature (SST), vertical wind shear and humidity are the driving factors that trigger and
                                                                                                                                                                            enhance the formation of tropical cyclones (Tao & Zhang, 2014). The weaker wind movement over the BoB
                                                                                                                                                                            results in a sluggish oceanic circulation that keeps the SST relatively higher which aids in the formation of
                                                                                                                                                                            cyclones easily (Shenoi, 2002). In addition, higher precipitation and constant inflow of fresh water from the
                                                                                                                                                                            Indian rivers of the Ganges and the Brahmaputra results in strong near-surface stratification which results
                                                                                                                                                                            in the rapid increase of salinity with depth as compared to the surface (Shetye et al., 1996). These conditions
                                                                                                                                                                            make the conditions ideal for the formation of a depression over the sea surface.
Posted on Authorea 16 Aug 2021 — CC-BY 4.0 — https://doi.org/10.22541/au.162912528.89970116/v1 — This a preprint and has not been peer reviewed. Data may be preliminary.

                                                                                                                                                                            It is well-known that the energy of tropical cyclones comes from the constant supply of moisture which comes
                                                                                                                                                                            from the warm water below. Climate change and global warming are responsible for increasing the surface
                                                                                                                                                                            temperature of the water and this results in greater evaporation providing greater moisture supply to the
                                                                                                                                                                            cyclones that are formed over water.
                                                                                                                                                                            The sea-surface temperature of certain coordinates 16.5 ºN - 21.5 ºN and 87.5 ºE - 92.5 ºE which lay over the
                                                                                                                                                                            Bay of Bengal were taken from the NASA Earth Observatory (NEO). Table 2 lists different cyclones that
                                                                                                                                                                            originated in the past 5 years during the months of April-May. The sea-surface temperature profile of BoB
                                                                                                                                                                            during the years 2016-2020 for May is given in Table 3 . It is clear from the table below that the sea-surface
                                                                                                                                                                            temperature during May 2020 as compared to the preceding years of 2016-2019. The data provided in the
                                                                                                                                                                            table shows that the temperature profile of sea-surface during May 2020 is similar to that of May 2016.
                                                                                                                                                                            During the year 2016, the CS Roanu (˜85 kmph) had hit the coasts of Sri Lanka and Bangladesh. The mean
                                                                                                                                                                            recorded SST during May 2016 was 30.2 ºC (highest 31.65 ºC; lowest 29.32 ºC) while the mean recorded
                                                                                                                                                                            SST for May 2020 was 30.3 ºC (highest 31.5 ºC; lowest 28.74 ºC). Despite such similarities in the sea-surface
                                                                                                                                                                            temperature, the CS Roanu’s impact was limited and not much severe as compared to the CuCS Amphan.
                                                                                                                                                                            The mean sea-surface temperature for the years 2017, 2018 and 2019 remained below 30 during May and
                                                                                                                                                                            hence no significant cyclones of higher intensity were recorded.
                                                                                                                                                                            From Figure 2 , it is quite evident that the sea-surface temperature indeed increased during May 2020
                                                                                                                                                                            which might have resulted in the transformation of the SuCS from a normal depression being formed on the
                                                                                                                                                                            ocean surface. The figure also shows the concentration of sea-surface temperatures during May for the years
                                                                                                                                                                            2016-2019 which are of lesser values as compared to the higher values of SST during May 2020.
                                                                                                                                                                            Table 2: Pre-monsoon tropical cyclones originating in the Bay of Bengal during the months of April-May in
                                                                                                                                                                            past years (2016-2019)

                                                                                                                                                                            Year of Origin     Cyclone Name         Date of Formation – Date of Dissipation           Highest Wind Speed Reported
                                                                                                                                                                            2016               Roanu                19 May 2016 – 23 May 2016                         86.4 kmph
                                                                                                                                                                            2017               Mora                 28 May 2017 – 31 May 2017                         114 kmph
                                                                                                                                                                            2018               -                    -                                                 -
                                                                                                                                                                            2019               Fani                 26 April 2019 – 5 May 2019                        175 kmph

                                                                                                                                                                            Table 3: Mean sea-surface temperature profile of Bay of Bengal for the month of May 2016-2020 (Source:
                                                                                                                                                                            NASA Earth Observatuions)

                                                                                                                                                                                                                                  3
S. No.   Latitude    Longitude   2016 (ºC)   2017 (ºC)   2018 (ºC)   2019 (ºC)   2020 (ºC)
                                                                                                                                                                            1        21.5   ºN   87.5   ºE   30.05       29.61       28.44       29.03       29.61
                                                                                                                                                                            2        21.5   ºN   88.5   ºE   29.76       29.9        28.74       28.88       29.61
                                                                                                                                                                            3        21.5   ºN   89.5   ºE   29.76       29.46       28.44       28.88       29.61
                                                                                                                                                                            4        21.5   ºN   90.5   ºE   30.19       30.19       29.17       29.17       30.92
                                                                                                                                                                            5        21.5   ºN   91.5   ºE   30.19       30.05       28.74       30.48       30.78
                                                                                                                                                                            7        20.5   ºN   87.5   ºE   29.9        29.17       27.57       28.3        29.03
                                                                                                                                                                            8        20.5   ºN   88.5   ºE   29.46       29.46       28.3        28.88       29.03
                                                                                                                                                                            9        20.5   ºN   89.5   ºE   29.76       29.76       28.3        29.03       29.76
                                                                                                                                                                            10       20.5   ºN   90.5   ºE   30.34       29.76       28.88       29.32       30.19
                                                                                                                                                                            11       20.5   ºN   91.5   ºE   30.63       29.32       29.46       29.76       29.61
                                                                                                                                                                            12       20.5   ºN   92.5   ºE   30.34       29.76       29.76       29.9        29.9
                                                                                                                                                                            13       19.5   ºN   87.5   ºE   30.05       29.03       28.15       28.59       28.74
                                                                                                                                                                            14       19.5   ºN   88.5   ºE   30.05       29.46       28.59       28.59       29.76
                                                                                                                                                                            15       19.5   ºN   89.5   ºE   30.05       29.46       29.03       29.03       31.5
                                                                                                                                                                            16       19.5   ºN   90.5   ºE   29.9        29.61       29.17       29.32       30.05
                                                                                                                                                                            17       19.5   ºN   91.5   ºE   30.19       29.61       30.05       29.46       30.48
Posted on Authorea 16 Aug 2021 — CC-BY 4.0 — https://doi.org/10.22541/au.162912528.89970116/v1 — This a preprint and has not been peer reviewed. Data may be preliminary.

                                                                                                                                                                            18       19.5   ºN   92.5   ºE   30.19       29.61       29.46       29.61       31.36
                                                                                                                                                                            19       18.5   ºN   87.5   ºE   29.32       29.61       29.03       28.59       29.61
                                                                                                                                                                            20       18.5   ºN   88.5   ºE   29.9        29.9        28.44       29.03       30.19
                                                                                                                                                                            21       18.5   ºN   89.5   ºE   30.48       29.9        28.88       29.17       30.05
                                                                                                                                                                            22       18.5   ºN   90.5   ºE   30.48       29.9        30.05       29.32       30.05
                                                                                                                                                                            23       18.5   ºN   91.5   ºE   30.05       30.19       29.61       29.32       30.63
                                                                                                                                                                            24       18.5   ºN   92.5   ºE   30.48       29.9        29.32       29.46       30.92
                                                                                                                                                                            25       17.5   ºN   87.5   ºE   29.9        29.76       29.61       28.88       30.05
                                                                                                                                                                            26       17.5   ºN   88.5   ºE   30.34       30.05       28.74       28.88       29.61
                                                                                                                                                                            27       17.5   ºN   89.5   ºE   30.48       30.48       30.63       29.03       30.48
                                                                                                                                                                            28       17.5   ºN   90.5   ºE   30.05       30.48       30.48       29.46       30.92
                                                                                                                                                                            29       17.5   ºN   91.5   ºE   30.34       29.76       29.9        29.32       30.78
                                                                                                                                                                            30       17.5   ºN   92.5   ºE   30.63       29.76       30.48       29.61       31.5
                                                                                                                                                                            31       16.5   ºN   87.5   ºE   30.34       30.19       29.17       28.74       30.34
                                                                                                                                                                            32       16.5   ºN   88.5   ºE   30.63       30.19       29.32       29.17       30.19
                                                                                                                                                                            33       16.5   ºN   89.5   ºE   31.65       30.48       30.63       29.61       30.78
                                                                                                                                                                            34       16.5   ºN   90.5   ºE   30.05       30.34       30.78       29.46       31.36
                                                                                                                                                                            35       16.5   ºN   91.5   ºE   30.34       30.63       30.19       29.46       31.5
                                                                                                                                                                            36       16.5   ºN   92.5   ºE   30.34       29.9        30.78       29.61       31.21

                                                                                                                                                                                                                         4
Posted on Authorea 16 Aug 2021 — CC-BY 4.0 — https://doi.org/10.22541/au.162912528.89970116/v1 — This a preprint and has not been peer reviewed. Data may be preliminary.

                                                                                                                                                                            Figure 2: Variation in sea-surface temperature for the months of May during past 5 years
                                                                                                                                                                            A similar cyclone “Fani” (April-May 2019; 249.45 kmph; 932 hPa) that formed in the same region over the
                                                                                                                                                                            BoB could have intensified easily to super-cyclone (SuCS) if only such a large scale lockdown were imposed
                                                                                                                                                                            in the year 2019 (Zhao et al., 2020).
                                                                                                                                                                            Relationship between SuCS Amphan and Lockdown
                                                                                                                                                                            Apart from the natural factors mentioned above, the country-wide lockdown in India might have had an
                                                                                                                                                                            indirect impact on the formation of SuCS Amphan by increasing the average sea surface temperature as seen
                                                                                                                                                                            from Table 3. The lockdown had rendered the atmosphere over the Indian sub-continent and the neighboring
                                                                                                                                                                            ocean relatively clean. The depressions over the BoB are a natural phenomenon but the country-wide
                                                                                                                                                                            lockdown might have driven the transformation of Amphan into a super cyclone by changing the radiative
                                                                                                                                                                            budget of the earth’s surface. Due to the closure of the industries, factories and transportation, the inflow of
                                                                                                                                                                            particulate matter concentration load over the BoB reduced drastically (Karuppasamy et al., 2020; Mahato
                                                                                                                                                                            et al., 2020; Singh et al., 2020; Vadrevu et al., 2020). Particulate matters such as black carbons (BC) are
                                                                                                                                                                            those aerosols that can absorb heat from Sunlight thereby reducing the heating of the sea surface water
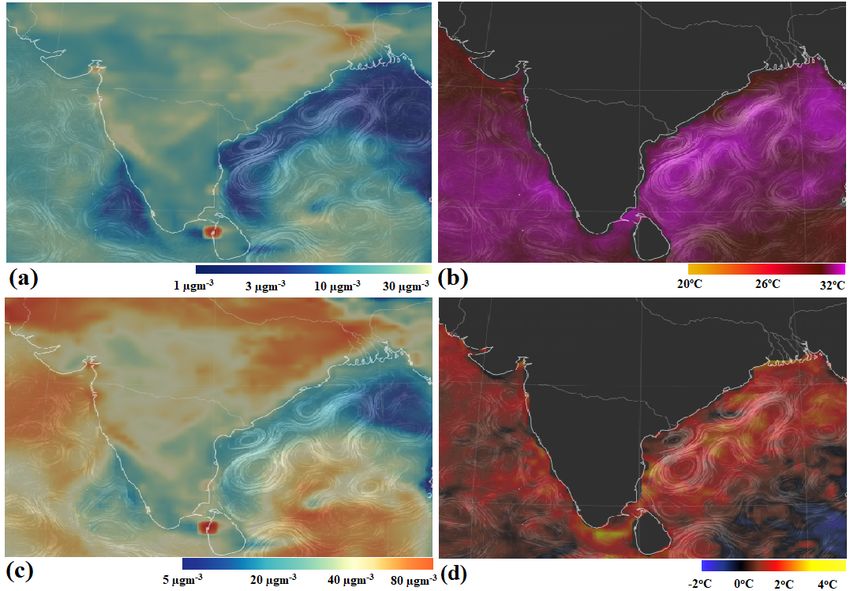
                                                                                                                                                                            (Ramanathan & Carmichael, 2008). Decreased amounts of particulate matter can be seen in figures 3(a)
                                                                                                                                                                            and (c), which might have triggered the increase of the average sea surface temperature due to the direct

                                                                                                                                                                                                                                   5
absorption of heat from the sunlight.
Posted on Authorea 16 Aug 2021 — CC-BY 4.0 — https://doi.org/10.22541/au.162912528.89970116/v1 — This a preprint and has not been peer reviewed. Data may be preliminary.

                                                                                                                                                                            Figure 3: (a) PM2.5 ; (b) SST; (c) PM10 ; (d) SST Anomaly on the day SuCS formation took place over the
                                                                                                                                                                            Bay of Bengal on 16th May 2020 (source: https://earth.nullschool.net)
                                                                                                                                                                            Figure 3 depicts the preconditions of particulate matters (PM2.5 and PM10 ) along with sea-surface temper-
                                                                                                                                                                            ature and SST anomaly over the Bay of Bengal on the day of origin of a depression (D) and simultaneously
                                                                                                                                                                            transforming into a cyclonic storm (CS) which later escalated into a super cyclonic storm (SuCS) Amphan.
                                                                                                                                                                            It is a well-known fact that the particulate matter which gets dissolved in water is known to have an
                                                                                                                                                                            impact on the formation of clouds (McNeill, 2015). Under normal conditions, a lot of particulate matter
                                                                                                                                                                            gets transported from the Indo-Gangetic plain to the Bay of Bengal (Sen et al., 2017). During regular
                                                                                                                                                                            conditions greater availability of particulate matter introduces more aerosols into the atmosphere which
                                                                                                                                                                            helps the formation of clouds but as a result of lockdown PM emissions have gone down hence fewer aerosols
                                                                                                                                                                            were available for cloud formation. Clouds having very high albedo (ability to reflect sunlight) which helps
                                                                                                                                                                            in keeping the water a little cooler which would restrict the constant supply of moisture to the cyclone.
                                                                                                                                                                            Therefore, the atmosphere over the BoB was rendered relatively clean due to the substantial decline in
                                                                                                                                                                            the anthropogenic activities and consequent lowering of aerosol loading by ˜30% while an increment of sea-
                                                                                                                                                                            surface temperature by ˜1–2 ºC as compared to the preceding year (Vinoj & Swain, 2020). The decline in the
                                                                                                                                                                            concentrations of both aerosols and the clouds combined effectively increased the sea-surface temperature
                                                                                                                                                                            which compounded the warming of oceans due to global warming. The conditions like pre-existing high
                                                                                                                                                                            summer SST, climate change enhanced Ocean Heat Content (OHC) and lockdown induced decline in aerosols
                                                                                                                                                                            & clouds perfectly blended for the potential subsequent intensification of the cyclonic activity (Vinoj & Swain,
                                                                                                                                                                            2020).
                                                                                                                                                                            Figure 4 shows the flow-chart depicting the probable formation of SuCS Amphan which might have resulted
                                                                                                                                                                            due to the impact of country-wide lockdown in India.

                                                                                                                                                                                                                                   6
Posted on Authorea 16 Aug 2021 — CC-BY 4.0 — https://doi.org/10.22541/au.162912528.89970116/v1 — This a preprint and has not been peer reviewed. Data may be preliminary.

                                                                                                                                                                            Figure 4: Flow chart depicting the probable formation of SuCS Amphan
                                                                                                                                                                            Conclusion
                                                                                                                                                                            Ideally, due to the CoVID-19 related, restrictions in anthropogenic activities decrease the average sea-surface
                                                                                                                                                                            temperature. However, it was noted that the average sea surface temperature increased in May 2020 which
                                                                                                                                                                            was much higher than the last five year’s average sea surface temperature. This could be one of the reasons
                                                                                                                                                                            for the formation of super cyclonic storm-Amphan. Sudden loss of particulate matter in the inflow air would
                                                                                                                                                                            have affects the normal functioning of the earth’s hydrological cycles by restricting the formation of clouds.
                                                                                                                                                                            Also, less particulate matter in the atmosphere might have had enhanced the surface temperature of the
                                                                                                                                                                            ocean. These factors might have played a vital role in accelerating the formation of low air pressure that
                                                                                                                                                                            eventually transformed into a super cyclone. The last five year’s data on average sea surface temperature
                                                                                                                                                                            indicated that during the 2020 monsoon session had the highest temperature. This could be one of the major
                                                                                                                                                                            reasons for the genesis of a super cyclone. This article also pointed that CoVID-19 related lockdown and
                                                                                                                                                                            related environmental changes would have boosted the cyclogenesis of a super-cyclone Amphan.
                                                                                                                                                                            Acknowledgement
                                                                                                                                                                            Authors gratefully acknowledge the Indian Meteorological Department (IMD), Ministry of Earth Sciences,
                                                                                                                                                                            Govt of India for the information on the tropical cyclones impacting India and neighboring nations through
                                                                                                                                                                            their website https://mausam.imd.gov.in/. Authors would also like to acknowledge theCAMS / Copernicus /
                                                                                                                                                                            European Commission + ECMWF for the particulate matter data and OSTIA / UK Met Office + GHRSST

                                                                                                                                                                                                                                  7
+ CMEMS for the SST and SSTA data obtained on the website https://earth.nullschool.net. The authors
                                                                                                                                                                            would also like to thank NASA Earth Observatory for the data of the sea-surface temperature and the image
                                                                                                                                                                            of SuCS Amphan taken from space on the website https://earthobservatory.nasa.gov/.
                                                                                                                                                                            Declaration of Competing Interests
                                                                                                                                                                            The authors declare that they have no competing interests. The concepts deliberated in this paper are
                                                                                                                                                                            the personal views of the authors, their respective organizations are in no way related to any of the points
                                                                                                                                                                            discussed.
                                                                                                                                                                            Funding Support:
                                                                                                                                                                            The authors declare that they have not received any funding for the present work.

                                                                                                                                                                            References
                                                                                                                                                                            Chauhan, A., Singh, R. P., Dash, P., & Kumar, R. (2021). Impact of tropical cyclone “Fani” on
                                                                                                                                                                            land, ocean, atmospheric and meteorological parameters. Marine Pollution Bulletin , 162 , 111844.
                                                                                                                                                                            https://doi.org/10.1016/j.marpolbul.2020.111844
Posted on Authorea 16 Aug 2021 — CC-BY 4.0 — https://doi.org/10.22541/au.162912528.89970116/v1 — This a preprint and has not been peer reviewed. Data may be preliminary.

                                                                                                                                                                            Dunkerton, T. J., Montgomery, M. T., & Wang, Z. (2009). Tropical cyclogenesis in a tropical wave critical
                                                                                                                                                                            layer: Easterly waves.Atmospheric Chemistry and Physics , 9 (15), 5587–5646. https://doi.org/10.5194/acp-
                                                                                                                                                                            9-5587-2009
                                                                                                                                                                            Emanuel, K. (2003). T ROPICAL C YCLONES. Annual Review of Earth and Planetary Sciences , 31 (1),
                                                                                                                                                                            75–104. https://doi.org/10.1146/annurev.earth.31.100901.141259
                                                                                                                                                                            Emanuel, K. (2005). Increasing destructiveness of tropical cyclones over the past 30 years. Nature , 436
                                                                                                                                                                            (7051), 686–688. https://doi.org/10.1038/nature03906
                                                                                                                                                                            Emanuel, K. A. (1987). The dependence of hurricane intensity on climate.Nature , 326 (6112), 483–485.
                                                                                                                                                                            https://doi.org/10.1038/326483a0
                                                                                                                                                                            Karuppasamy, M. B., Seshachalam, S., Natesan, U., Ayyamperumal, R., Karuppannan, S., Gopalakr-
                                                                                                                                                                            ishnan, G., & Nazir, N. (2020). Air pollution improvement and mortality rate during COVID-19 pan-
                                                                                                                                                                            demic in India: Global intersectional study. Air Quality, Atmosphere & Health ,13 (11), 1375–1384.
                                                                                                                                                                            https://doi.org/10.1007/s11869-020-00892-w
                                                                                                                                                                            Mahato, S., Pal, S., & Ghosh, K. G. (2020).        Effect of lockdown amid COVID-19 pandemic
                                                                                                                                                                            on air quality of the megacity Delhi, India.Science of The Total Environment , 730 , 139086.
                                                                                                                                                                            https://doi.org/10.1016/j.scitotenv.2020.139086
                                                                                                                                                                            Mandal, S., Sil, S., Shee, A., & Venkatesan, R. (2018). Upper Ocean and Subsurface Variability in the Bay
                                                                                                                                                                            of Bengal During Cyclone ROANU: A Synergistic View Using In Situ and Satellite Observations. Pure and
                                                                                                                                                                            Applied Geophysics , 175 (12), 4605–4624. https://doi.org/10.1007/s00024-018-1932-8
                                                                                                                                                                            McNeill, V. F. (2015).      Aqueous Organic Chemistry in the Atmosphere: Sources and Chemi-
                                                                                                                                                                            cal Processing of Organic Aerosols.   Environmental Science & Technology , 49 (3), 1237–1244.
                                                                                                                                                                            https://doi.org/10.1021/es5043707
                                                                                                                                                                            Ramanathan, V., & Carmichael, G. (2008). Global and regional climate changes due to black carbon. Nature
                                                                                                                                                                            Geoscience , 1 (4), 221–227. https://doi.org/10.1038/ngeo156
                                                                                                                                                                            Satheesh, S. K., & Ramanathan, V. (2000). Large differences in tropical aerosol forcing at the top of the
                                                                                                                                                                            atmosphere and Earth’s surface.Nature , 405 (6782), 60–63. https://doi.org/10.1038/35011039
                                                                                                                                                                            Sen, A., Abdelmaksoud, A. S., Nazeer Ahammed, Y., Alghamdi, M. iA., Banerjee, T., Bhat, M. A., Chat-
                                                                                                                                                                            terjee, A., Choudhuri, A. K., Das, T., Dhir, A., Dhyani, P. P., Gadi, R., Ghosh, S., Kumar, K., Khan, A.
                                                                                                                                                                            H., Khoder, M., Maharaj Kumari, K., Kuniyal, J. C., Kumar, M., . . . Mandal, T. K. (2017). Variations

                                                                                                                                                                                                                                 8
in particulate matter over Indo-Gangetic Plains and Indo-Himalayan Range during four field campaigns
                                                                                                                                                                            in winter monsoon and summer monsoon: Role of pollution pathways. Atmospheric Environment , 154 ,
                                                                                                                                                                            200–224. https://doi.org/10.1016/j.atmosenv.2016.12.054
                                                                                                                                                                            Sharma, D. C. (2017). Cyclone Mora devastates south Asia.             The Lancet , 389 (10086), 2273.
                                                                                                                                                                            https://doi.org/10.1016/S0140-6736(17)31580-5
                                                                                                                                                                            Shenoi, S. S. C. (2002). Differences in heat budgets of the near-surface Arabian Sea and Bay of
                                                                                                                                                                            Bengal: Implications for the summer monsoon.Journal of Geophysical Research , 107 (C6), 3052.
                                                                                                                                                                            https://doi.org/10.1029/2000JC000679
                                                                                                                                                                            Shetye, S. R., Gouveia, A. D., Shankar, D., Shenoi, S. S. C., Vinayachandran, P. N., Sundar, D.,
                                                                                                                                                                            Michael, G. S., & Nampoothiri, G. (1996). Hydrography and circulation in the western Bay of Ben-
                                                                                                                                                                            gal during the northeast monsoon. Journal of Geophysical Research: Oceans ,101 (C6), 14011–14025.
                                                                                                                                                                            https://doi.org/10.1029/95JC03307
                                                                                                                                                                            Singh, V., Singh, S., Biswal, A., Kesarkar, A. P., Mor, S., & Ravindra, K. (2020). Diurnal and temporal
                                                                                                                                                                            changes in air pollution during COVID-19 strict lockdown over different regions of India. Environmental
                                                                                                                                                                            Pollution , 266 , 115368. https://doi.org/10.1016/j.envpol.2020.115368
Posted on Authorea 16 Aug 2021 — CC-BY 4.0 — https://doi.org/10.22541/au.162912528.89970116/v1 — This a preprint and has not been peer reviewed. Data may be preliminary.

                                                                                                                                                                            Tao, D., & Zhang, F. (2014). Effect of environmental shear, sea-surface temperature, and ambient moisture
                                                                                                                                                                            on the formation and predictability of tropical cyclones: An ensemble-mean perspective. Journal of Advances
                                                                                                                                                                            in Modeling Earth Systems , 6 (2), 384–404. https://doi.org/10.1002/2014MS000314
                                                                                                                                                                            Tory, K. J., & Dare, R. A. (2015). Sea Surface Temperature Thresholds for Tropical Cyclone Formation.
                                                                                                                                                                            Journal of Climate ,28 (20), 8171–8183. https://doi.org/10.1175/JCLI-D-14-00637.1
                                                                                                                                                                            Vadrevu, K. P., Eaturu, A., Biswas, S., Lasko, K., Sahu, S., Garg, J. K., & Justice, C. (2020). Spatial and
                                                                                                                                                                            temporal variations of air pollution over 41 cities of India during the COVID-19 lockdown period.Scientific
                                                                                                                                                                            Reports , 10 (1), 16574. https://doi.org/10.1038/s41598-020-72271-5
                                                                                                                                                                            Vinoj, V., & Swain, D. (2020). Did COVID-19 Lockdown Brew “Amphan” into a Super Cyclone? [Preprint].
                                                                                                                                                                            EARTH SCIENCES. https://doi.org/10.20944/preprints202007.0033.v1
                                                                                                                                                                            Zhao, L., Simon Wang, S.-Y., Becker, E., Yoon, J.-H., & Mukherjee, A. (2020). Cyclone Fani: The tug-of-
                                                                                                                                                                            war between regional warming and anthropogenic aerosol effects. Environmental Research Letters ,15 (9),
                                                                                                                                                                            094020. https://doi.org/10.1088/1748-9326/ab91e7

                                                                                                                                                                                                                                9
You can also read