Vanuatu The contributions of Salesa Kaniaha and Philip Malsale from the Vanuatu Meteorology and Geo-hazard Department are gratefully acknowledged ...
←
→
Page content transcription
If your browser does not render page correctly, please read the page content below
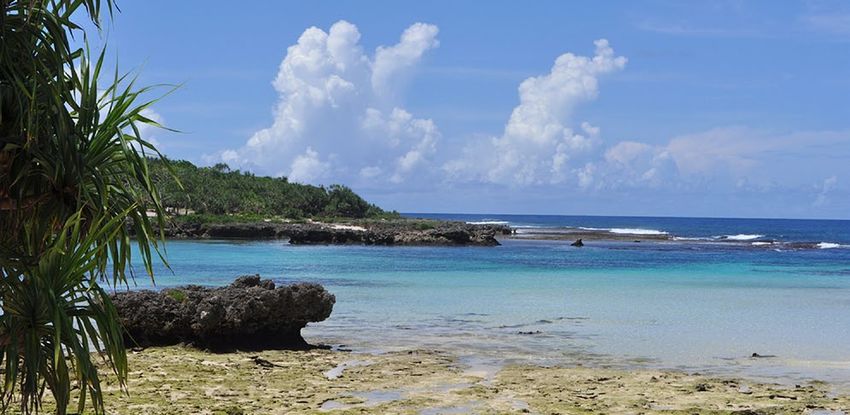
Eton Beach, West Efate

                                               Chapter 16
                                                 Vanuatu
The contributions of Salesa Kaniaha and Philip Malsale from the Vanuatu
  Meteorology and Geo-hazard Department are gratefully acknowledged

                                                                        243
Introduction
This chapter provides a brief                    (e.g. the El Niño-Southern Oscillation)            These projections are presented
description of Vanuatu, its past and             are analysed and discussed. Observed               along with confidence levels based on
present climate as well as projections           trends and analysis of air temperature,            expert judgement by Pacific Climate
for the future. The climate observation          rainfall, extreme events (including                Change Science Program (PCCSP)
network and the availability of                  tropical cyclones), sea-surface                    scientists. The chapter concludes
atmospheric and oceanic data records             temperature, ocean acidification, mean             with a summary table of projections
are outlined. The annual mean climate,           and extreme sea levels are presented.              (Table 16.4). Important background
seasonal cycles and the influences of            Projections for air and sea-surface                information including an explanation
large-scale climate features such as             temperature, rainfall, sea level, ocean            of methods and models is provided
the South Pacific Convergence Zone               acidification and extreme events                   in Chapter 1. For definitions of other
and patterns of climate variability              for the 21st century are provided.                 terms refer to the Glossary.

16.1 Climate Summary
16.1.1 Current Climate                           • The sea-level rise near Vanuatu                  • Little change is projected in annual
                                                   measured by satellite altimeters                   mean rainfall (low confidence).
• Temperatures in the                              since 1993 is about 6 mm per year.               • The intensity and frequency of days
  warmest months in Vanuatu
                                                 • Annual and seasonal rainfall trends                of extreme heat are projected to
  (January‑February) are about 4ºC
                                                   for Port Vila and Aneityum for                     increase (very high confidence).
  higher than those in the coolest
                                                   the period 1950–2009 are not                     • The intensity and frequency of days
  months (July-August).
                                                   statistically significant.                         of extreme rainfall are projected to
• Vanuatu has a marked wet season
                                                 • On average Port Vila experiences                   increase (high confidence).
  from November to April.
                                                   23 tropical cyclones per decade,                 • Little change is projected
• Vanuatu’s rainfall is strongly                   with most occurring in January                     in the incidence of drought
  influenced by the position and                   and February. The high interannual                 (low confidence).
  strength of the South Pacific                    variability in tropical cyclone
  Convergence Zone. During summer                                                                   • Tropical cyclone numbers are
                                                   numbers makes it difficult to identify
  the South Pacific Convergence                                                                       projected to decline in the
                                                   any long-term trends in frequency.
  Zone intensifies and moves further                                                                  south-west Pacific Ocean
  south, bringing the higher rainfall of                                                              basin (0–40ºS, 130ºE –170ºE)
  the wet season.                                16.1.2 Future Climate                                (moderate confidence).

• Rainfall in Vanuatu varies                     Over the course of the 21st century:               • Ocean acidification is projected to
  greatly from year-to-year due                                                                       continue (very high confidence).
                                                 • Surface air temperature and
  mainly to the influence of the                   sea‑surface temperature are                      • Mean sea-level rise is projected to
  El Niño-Southern Oscillation.                    projected to continue to increase                  continue (very high confidence).
• Warming trends are evident in                    (very high confidence).
  both annual and seasonal mean                  • Wet season rainfall is projected to
  air temperatures for Bauerfield                  increase (moderate confidence).
  Airport (Port Vila) for the period
                                                 • Dry season rainfall is projected to
  1950–2009.
                                                   decrease (moderate confidence).

244    Climate Change in the Pacific: Scientific Assessment and New Research | Volume 2: Country Reports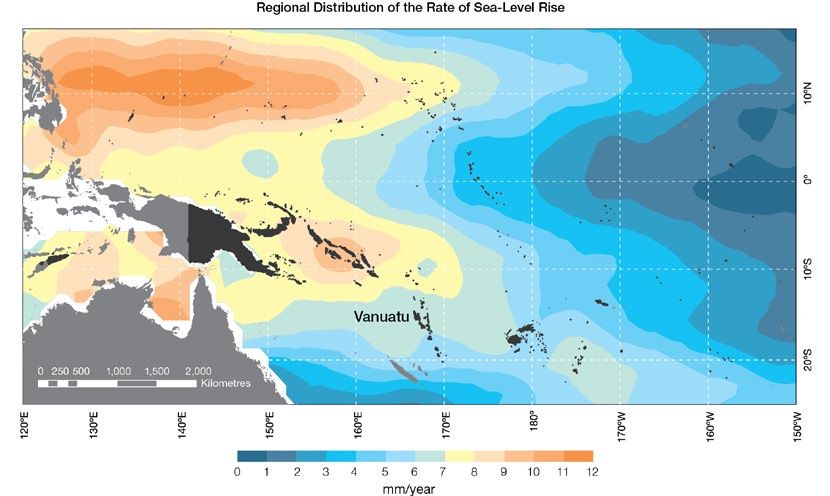
16.2 Country Description
The island archipelago of Vanuatu         are characterised by rugged volcanic   Most of Vanuatu’s population relies
lies between 13°S-21°S and                peaks and tropical rainforests. The    on subsistence agriculture. Cocoa,
166°E–171°E and includes over             highest peak, Mount Tabwemasana on     copra and coffee exports contribute
80 islands. The largest island is         Espiritu Santo, is 1877 m above mean   to Vanuatu’s economy alongside
Espiritu Santo while the island of        sea level.                             tourism, logging and fishing.
Efate is home to the capital, Port Vila                                          Revenue from mineral extraction is
                                          Vanuatu’s population in 2009 was
and the Vanuatu Government.                                                      relatively new to the economy and
                                          estimated at 234 023 of which
Vanuatu has an Economic Exclusion                                                may provide significant revenue in
                                          around 80% live in rural areas
Zone of 710 000 km2 which                                                        the future (Vanuatu Country Profile,
                                          (Vanuatu Country Profile, SOPAC,
encompasses Vanuatu’s total land                                                 SOPAC, 2000).
                                          2000; Vanuatu National Statistics
area of 12 190 km2. Larger islands
                                          Office, 2010).

Figure 16.1: Vanuatu

                                                                                                Chapter 16: Vanuatu   245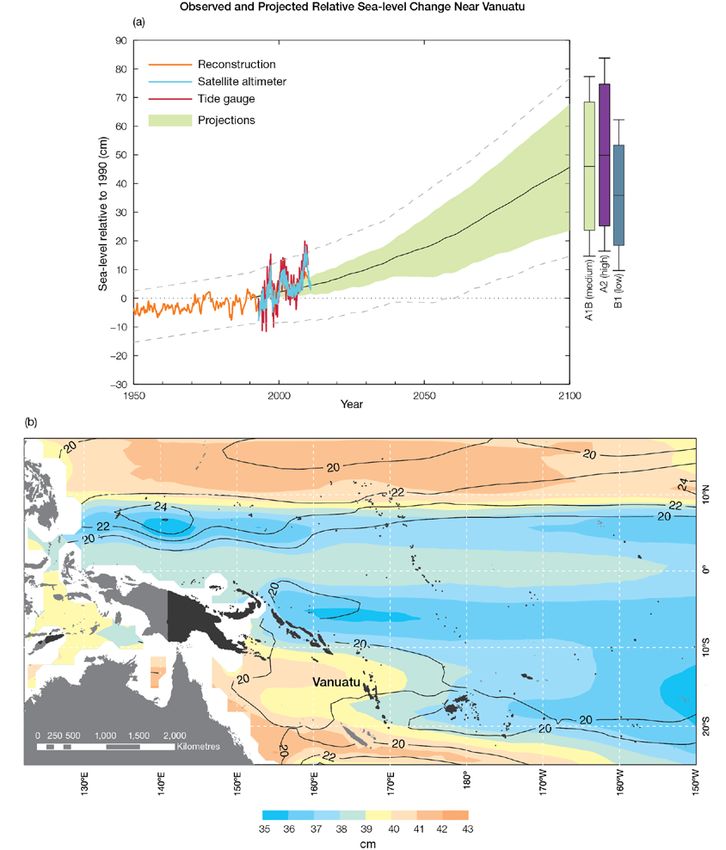
16.3 Data Availability
There are currently 47 operational                Records used include a composite                   years. Both satellite (from 1993) and in
meteorological stations in Vanuatu.               Iririki-Vila rainfall record, composite            situ sea-level data (1950–2009; termed
Multiple observations within a 24‑hour            air temperature Iririki-Vila‑Bauerfield            reconstructed sea level; Volume 1,
period are taken at Sola, Pekoa,                  record and single site record from                 Section 2.2.2.2) are available on a
Saratamata, Lamap, Bauerfield,                    Aneityum (southern Vanuatu)                        global 1° x 1° grid.
Whitegrass and Analguahat. At three               for the period 1950–2009.
                                                                                                     Long-term locally-monitored sea-
climate stations, Lambubu, Lamap                  The Iririki‑Vila‑Bauerfield and Aneityum
                                                                                                     surface temperature data are
and Aneityum, and at 39 rainfall                  records are homogeneous and more
                                                                                                     unavailable for Vanuatu, so large-scale
stations across the country a single              than 95% complete.
                                                                                                     gridded sea-surface temperature
observation is taken daily at 9.00 am
                                                  Oceanographic records do not                       datasets have been used (HadISST,
local time. The primary climate
                                                  cover such a long time period.                     HadSST2, ERSST and Kaplan
stations are located at Port Vila and
                                                  Monthly‑averaged sea-level data are                Extended SST V2; Volume 1,
Bauerfield Airport on the island of
                                                  available from Port Vila (1993–present).           Table 2.3).
Efate (Figure 16.1). Several stations,
                                                  A global positioning system instrument
including Iririki (Port Vila), have rainfall
                                                  to estimate vertical land motion was
data from the early 1900s. Iririki
                                                  deployed at Port Vila in 2002 and
also has the earliest air temperature
                                                  will provide valuable direct estimates
observations which began in the
                                                  of local vertical land motion in future
late 1940s.

Climate data management training, Vanuatu Meteorology and Geo-hazard Department

246     Climate Change in the Pacific: Scientific Assessment and New Research | Volume 2: Country Reports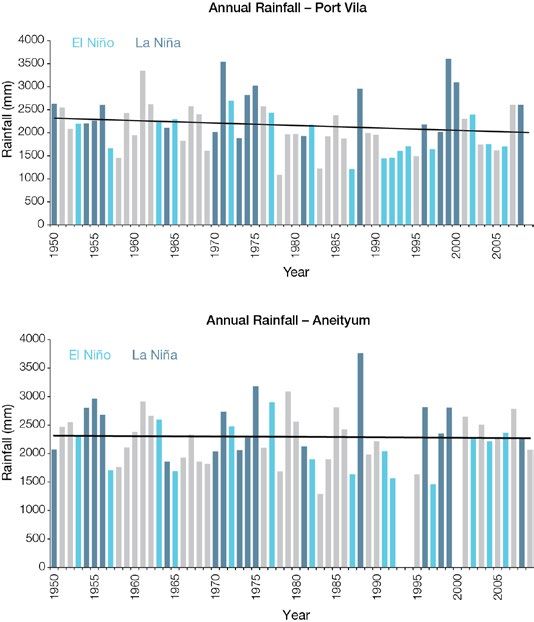
16.4 Seasonal Cycles
The seasonal variations in rainfall and       match those of air temperatures               (SPCZ), which lies north of the country
air temperature at both Port Vila (in         and have a strong influence on the            during the winter. During summer the
the central region of Vanuatu) and            air temperatures on the islands               SPCZ intensifies and moves further
Aneityum (in the south) are very similar      of Vanuatu.                                   south, bringing the higher rainfall
(Figure 16.2). Being further south,                                                         of the wet season. Low pressure
                                              Both sites have a marked wet season
mean monthly Aneityum temperatures                                                          systems embedded in the SPCZ often
                                              from November to April, with highest
are about 2ºC cooler than those in                                                          become tropical cyclones during the
                                              rainfall from January to March, and
Port Vila. Both sites have highest                                                          cyclone season. Topography also
                                              a dry season from May to October.
temperatures in January-February,                                                           plays a role in the variations in rainfall
                                              The difference between seasons is
with the coolest months (July‑August)                                                       across some islands. During the wet
                                              slightly more marked in Port Vila as
about 4ºC cooler than the warmest                                                           season, rainfall is particularly high
                                              Aneityum receives more rainfall from
months. The cooler winter air                                                               on the windward (south-east) side
                                              extra-tropical influences such as
temperatures are due to weaker solar                                                        of the mountain ranges of the bigger
                                              cold fronts during the dry season.
radiation and the influence of high                                                         islands, and scarce during the dry
                                              Vanuatu’s rainfall is strongly influenced
pressure cells bringing cold winds from                                                     season, especially on the leeward
                                              by the position and strength of the
higher latitudes. Seasonal variations                                                       (north‑west) sides.
                                              South Pacific Convergence Zone
in sea-surface temperatures closely

Figure 16.2: Mean annual cycle of rainfall (grey bars) and daily maximum, minimum and mean air temperatures at Port Vila (left) and
Aneityum (right), and local sea-surface temperatures derived from the HadISST dataset (Volume 1, Table 2.3).

                                                                                                            Chapter 16: Vanuatu   247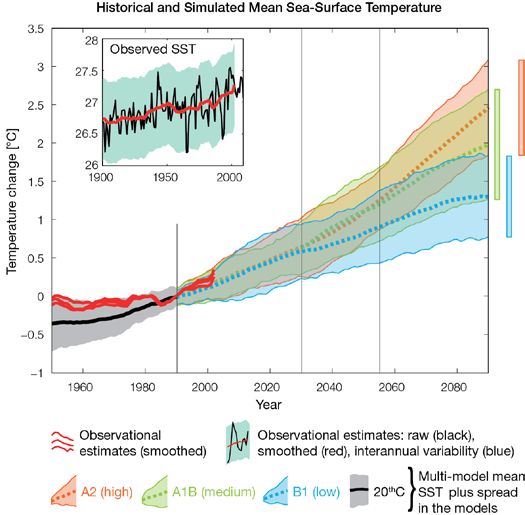
16.5 Climate Variability
Large variations in rainfall are                 Table 16.1: Correlation coefficients between indices of key large-scale patterns of
observed in Vanuatu from year‑to‑year            climate variability and minimum and maximum temperatures (Tmin and Tmax) and
(Figure 16.4). The wettest years                 rainfall at Port Vila. Only correlation coefficients that are statistically significant at the
receive up to three times more than              95% level are shown.
the driest years. Much of this variability
is linked to the El Niño‑Southern                                                                 Dry season                  Wet season
Oscillation (ENSO). There are                     Climate feature/index                          (May-October)               (November-April)
significant correlations between                                                             Tmin Tmax Rain                Tmin Tmax     Rain
                                                  ENSO      Niño3.4                           -0.41 -0.41 -0.45                           -0.49
ENSO indices and both rainfall and air
                                                            Southern Oscillation Index         0.36     0.41   0.36                        0.51
temperature in Vanuatu (Tables 16.1
                                                  Interdecadal Pacific Oscillation Index                      -0.28
and 16.2). The impact of ENSO on
                                                  Southern Annular Mode Index
climate in Port Vila and Aneityum
                                                  ENSO Modoki Index                           -0.40    -0.36       -0.26   -0.28             -0.45
are similar: El Niño events tend to
                                                  Number of years of data                     62       62          98      62      63       100
bring a late start to the wet season
and lower rainfall in both the wet
and dry seasons, as well as cooler
conditions in the dry season. Opposite           Table 16.2: Correlation coefficients between indices of key large-scale patterns of
impacts are usually observed during              climate variability and minimum and maximum temperatures (Tmin and Tmax) and
La Niña events. ENSO Modoki events               rainfall at Aneityum. Only correlation coefficients that are statistically significant at the
(Volume1, Section 3.4.1) are as                  95% level are shown.
important as canonical ENSO events
in Port Vila, and have much the same                                                                Dry season                 Wet season
impacts, but are less influential further         Climate feature/index                           (May-October)              (November-April)
south in Aneityum. Long-term ENSO                                                             Tmin Tmax Rain               Tmin Tmax Rain
variability, seen in the Interdecadal             ENSO      Niño3.4                            -0.51 -0.48 -0.43                          -0.33
Pacific Oscillation, appears to have                        Southern Oscillation Index          0.41     0.59   0.27                       0.39
a weak but significant influence on               Interdecadal Pacific Oscillation Index
decadal rainfall variability in Port Vila         Southern Annular Mode Index
during the dry season.                            ENSO Modoki Index                           -0.43        -0.45
                                                  Number of years of data                     59           58      61      55       53       60

248    Climate Change in the Pacific: Scientific Assessment and New Research | Volume 2: Country Reports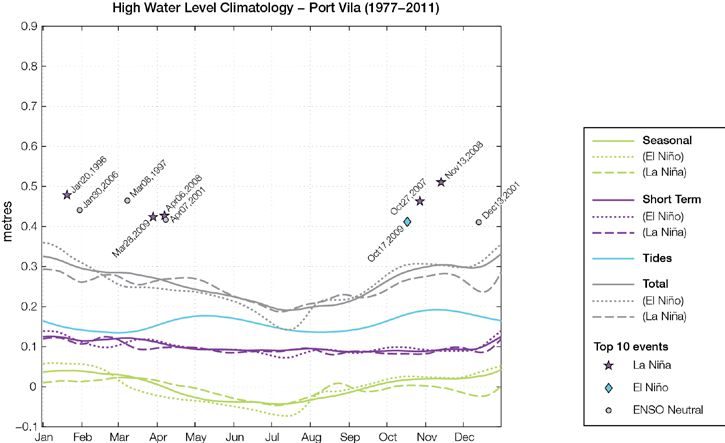
16.6 Observed Trends
16.6.1 Air Temperature
Warming trends are evident in both
annual and seasonal mean air
temperatures at Bauerfield Airport
(composite) and Aneityum for the
period 1950–2009. Air temperature
trends are stronger in the wet season
when compared with the dry season,
and minimum air temperatures
trends are stronger than maximum
air temperature trends at both sites
(Figure 16.3 and Table 16.3).

16.6.2 Rainfall
Annual and seasonal rainfall trends for
Port Vila (composite) and Aneityum
for the period 1950–2009 are not
statistically significant (Table 16.3 and
Figure 16.4).

                                               Figure 16.3: Annual mean air temperature at Bauerfield Airport (Port Vila) (top) and
                                               Aneityum (bottom). Light blue, dark blue and grey bars denote El Niño, La Niña and
                                               neutral years respectively.

Table 16.3: Annual and seasonal trends in maximum, minimum and mean air temperature (Tmax, Tmin and Tmean) and rainfall at
Bauerfield Airport/Port Vila (composite) and Aneityum for the period 1950–2009. Asterisks indicate significance at the 95% level.
Persistence is taken into account in the assessment of significance as in Power and Kociuba (in press). The statistical significance of
the air temperature trends is not assessed.

                Bauerfield      Bauerfield     Bauerfield      Port Vila      Aneityum        Aneityum       Aneityum        Aneityum
                 Airport         Airport        Airport          Rain           Tmax            Tmin          Tmean            Rain
                  Tmax            Tmin          Tmean          (mm per         (°C per         (°C per        (°C per        (mm per
                 (°C per         (°C per        (°C per         10 yrs)        10 yrs)         10 yrs)        10 yrs)         10 yrs)
                 10 yrs)         10 yrs)        10 yrs)
Annual             +0.17           +0.19          +0.17             -53          +0.18          +0.23           +0.21                 -7
Wet season         +0.21           +0.21          +0.21             -40          +0.17          +0.25           +0.21                 +4
Dry season         +0.13           +0.19          +0.15             -10          +0.16          +0.22           +0.19                -15

                                                                                                               Chapter 16: Vanuatu     249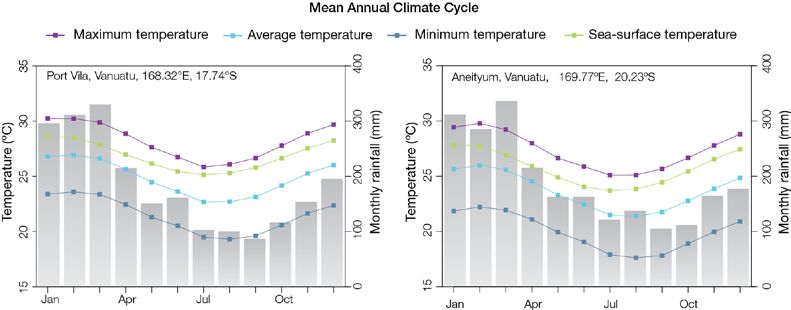
16.6.3 Extreme Events
                                                                                                       The tropical cyclone season in the
                                                                                                       Vanuatu region is between November
                                                                                                       and April. Occurrences outside this
                                                                                                       period are rare. The tropical cyclone
                                                                                                       archive for the Southern Hemisphere
                                                                                                       indicates that between the 1969/70
                                                                                                       and 2009/10 seasons, the centre of
                                                                                                       94 tropical cyclones passed within
                                                                                                       approximately 400 km of Port Vila
                                                                                                       making this site the most impacted
                                                                                                       capital city in the PCCSP Partner
                                                                                                       Countries (Nuku’alofa, Tonga follows
                                                                                                       with 71 cyclones over the same
                                                                                                       period). This represents an average
                                                                                                       of 23 cyclones per decade. Tropical
                                                                                                       cyclone occurrence in El Niño,
                                                                                                       La Niña and neutral years are fairly
                                                                                                       similar (averages of 23, 25 and 22
                                                                                                       cyclones per decade respectively).
                                                                                                       The interannual variability in the
                                                                                                       number of tropical cyclones in the
                                                                                                       vicinity of Port Vila is large, ranging
                                                                                                       from zero in some seasons to six in
                                                                                                       the 1971/72 season (Figure 16.5).
                                                                                                       This high variability makes it difficult
                                                                                                       to identify any long-term trends
                                                                                                       in frequency.
                                                                                                       Impacts of climate variability and
                                                                                                       change are evident on most of
                                                                                                       Vanuatu’s islands. ENSO-related
Figure 16.4: Annual rainfall at Port Vila (top) and Aneityum (bottom). Light blue, dark blue           drought and flooding are prevalent and
and grey bars denote El Niño, La Niña and neutral years respectively.                                  continue to impact the socio-economic
                                                                                                       livelihood of the people of Vanuatu.
                                                                                                       For example, a flood event during the
                                                                                                       2011 La Niña event washed through
                                                                                                       several villages on Emae Island,
                                                                                                       completely inundating agricultural
                                                                                                       land in Middle Bush, Tanna. Such
                                                                                                       occurrences are rare but the impacts
                                                                                                       can be devastating.

Figure 16.5: Tropical cyclones passing within 400 km of Port Vila per season.
The 11‑year moving average is in purple.

250     Climate Change in the Pacific: Scientific Assessment and New Research | Volume 2: Country Reports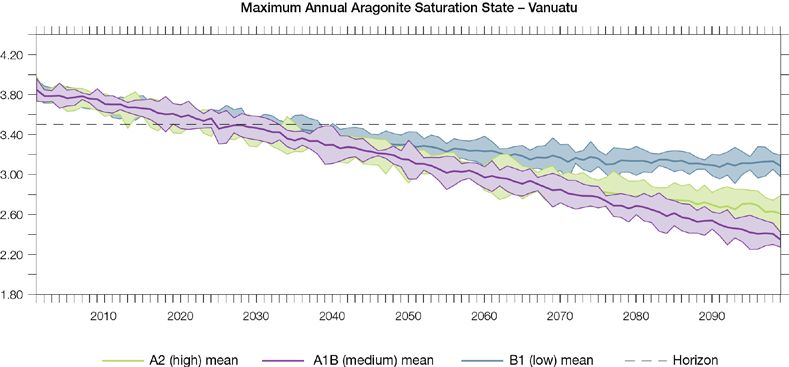
16.6.4 Sea-Surface                              16.6.5 Ocean                                    16.6.6 Sea Level
Temperature                                     Acidification                                   Monthly averages of the historical
                                                                                                tide gauge, satellite (since 1993) and
Historical changes around Vanuatu               Based on the large-scale distribution
                                                                                                gridded sea-level (since 1950) data
are consistent with the broad-scale             of coral reefs across the Pacific and
                                                                                                agree well after 1993 and indicate
sea‑surface temperature changes                 the seawater chemistry, Guinotte et
                                                                                                interannual variability in sea levels
of the PCCSP region. Water                      al. (2003) suggested that seawater
                                                                                                of about 18 cm (estimated 5–95%
temperatures remained relatively                aragonite saturation states above 4
                                                                                                range) after removal of the seasonal
constant from the 1950s to the late             were optimal for coral growth and
                                                                                                cycle (Figure 16.10). The sea-level rise
1980s. This was followed by a period            for the development of healthy reef
                                                                                                near Vanuatu measured by satellite
of more rapid warming (approximately            ecosystems, with values from 3.5 to 4
                                                                                                altimeters (Figure 16.6) since 1993
0.09°C per decade for 1970 to                   adequate for coral growth, and values
                                                                                                is about 6 mm per year, larger than
present). Figure 16.8 shows the                 between 3 and 3.5, marginal. Coral
                                                                                                the global average of 3.2 ± 0.4 mm
1950–2000 sea-surface temperature               reef ecosystems were not found at
                                                                                                per year. This rise is partly linked to
changes (relative to a reference year of        seawater aragonite saturation states
                                                                                                a pattern related to climate variability
1990) from three different large-scale          below 3 and these conditions were
                                                                                                from year to year and decade to
sea surface temperature datasets                classified as extremely marginal for
                                                                                                decade (Figure 16.10).
(HadSST2, ERSST and Kaplan                      supporting coral growth.
Extended SST V2; Volume 1, Table
                                                In the Vanuatu region, the aragonite
2.3). At these regional scales, natural
                                                saturation state has declined from
variability may play a large role in the
                                                about 4.5 in the late 18th century to
sea-surface temperature changes
                                                an observed value of about 3.9 ± 0.1
making it difficult to identify any
                                                by 2000.
long‑term trends.

Figure 16.6: The regional distribution of the rate of sea-level rise measured by satellite altimeters from January 1993 to December
2010, with the location of Vanuatu indicated. Further detail about the regional distribution of sea-level rise is provided in Volume 1,
Section 3.6.3.2.

                                                                                                                 Chapter 16: Vanuatu      251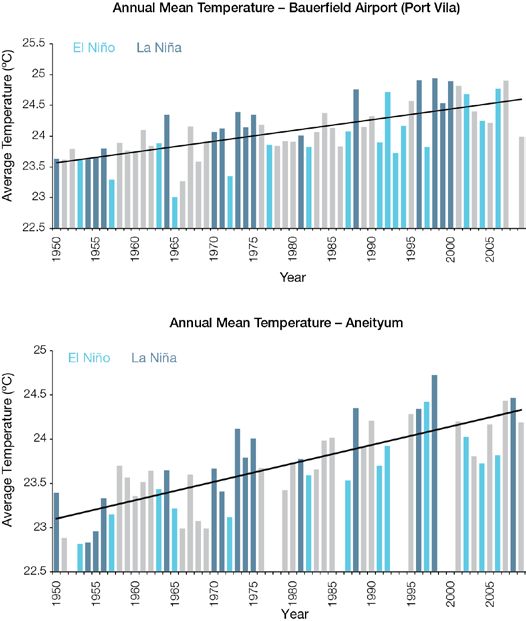
16.6.7 Extreme                                   water levels tend to be higher during              events. These tidal, seasonal and
                                                 La Niña years and slightly lower during            short-term components combine
Sea‑Level Events                                 El Niño years (Volume 1, Section 3.6.3             to produce a highest likelihood of
The annual climatology of the highest            and Figures 3.20 and 3.21). Short-term             extreme water levels from October
daily sea levels has been evaluated              variations show evidence of a seasonal             through March. The top 10 water level
from hourly measurements by the tide             cycle, with a generally higher likehood            events mostly occurred within this time
gauge at Port Vila (Figure 16.7). High           of high water levels in December to                frame during La Niña or ENSO-neutral
tides peak in November to January.               March, roughly corresponding to                    conditions. Several were associated
Seasonal variations throughout the               the cyclone season. ENSO does not                  with a cyclone or tropical disturbance
year are small. However, seasonal                strongly affect short-term water level             in the vicinity.

Figure 16.7: The annual cycle of high waters relative to Mean Higher High Water (MHHW) due to tides, short-term fluctuations (most
likely associated with storms) and seasonal variations for Port Vila. The tides and short-term fluctuations are respectively the 95%
exceedence levels of the astronomical high tides relative to MHHW and short-term sea-level fluctuations. Components computed only
for El Niño and La Niña months are shown by dotted and dashed lines, and grey lines are the sum of the tide, short-term and seasonal
components. The 10 highest sea-level events in the record relative to MHHW are shown and coded to indicate the phase of ENSO at
the time of the extreme event.

252    Climate Change in the Pacific: Scientific Assessment and New Research | Volume 2: Country Reports
16.7 Climate Projections
Climate projections have been derived weaker) rate of warming is projected Interannual variability in surface
from up to 18 global climate models for the surface ocean (Figure 16.8). air temperature and sea-surface
from the CMIP3 database, for up There is high confidence in this temperature over Vanuatu is strongly
to three emissions scenarios (B1 range and distribution of possible influenced by ENSO in the current
(low), A1B (medium) and A2 (high)) futures because: climate (Section 16.5). As there is no
and three 20-year periods (centred • There is generally close consistency in projections of future
on 2030, 2055 and 2090, relative to agreement between modelled ENSO activity (Volume 1, Section 6.4.1)
1990). These models were selected and observed temperature it is not possible to determine whether
based on their ability to reproduce trends over the past 50 years in interannual variability in temperature will
important features of the current the vicinity of Vanuatu, although change in the future. However, ENSO is
climate (Volume 1, Section 5.2.3), so observational records are limited expected to continue to be an important
projections arising from each of the (Figure 16.8). source of variability for the region.
models are plausible representations
of the future climate. This means there
is not one single projected future for
Vanuatu, but rather a range of possible
futures. The full range of these futures
is discussed in the following sections.
These projections do not represent a
value specific to any actual location,
such as a town or city in Vanuatu.
Instead, they refer to an average
change over the broad geographic
region encompassing the islands
of Vanuatu and the surrounding
ocean (Figure 1.1 shows the
regional boundaries). Section 1.7
provides important information about
interpreting climate model projections.
16.7.1 Temperature
Surface air temperature and sea-
surface temperature are projected to
continue to increase over the course
of the 21st century. There is very high
confidence in this direction of change
because:
• Warming is physically consistent
with rising greenhouse gas
concentrations.
• All CMIP3 models agree on this
direction of change. Figure 16.8: Historical climate (from 1950 onwards) and simulated historical and future
climate for annual mean sea-surface temperature (SST) in the region surrounding
The majority of CMIP3 models simulate Vanuatu, for the CMIP3 models. Shading represents approximately 95% of the range
a slight increase (16.7.2 Rainfall The majority of CMIP3 models simulate 16.7.3 Extremes
little change (-5% to 5%) in dry season
Wet Season (November-April) rainfall by 2030, however by 2090 Temperature
they tend to be approximately equally
Wet season rainfall is projected to The intensity and frequency of days of
divided between a decrease (5%)
in this direction of change because: There is very high confidence in this
(Table 16.4). There is low confidence in
• An increase in wet season rainfall is direction of change because:
this range and distribution of possible
consistent with the projected likely futures because: • An increase in the intensity and
increase in the intensity of the South frequency of days of extreme heat
• In simulations of the current climate,
Pacific Convergence Zone (SPCZ), is physically consistent with rising
some CMIP3 models have an SPCZ
which lies over Vanuatu in this greenhouse gas concentrations.
that extends too far east during the
season (Volume 1, Section 6.4.5). • All CMIP3 models agree on the
dry season, with too much rainfall
• The majority of CMIP3 models over Vanuatu (Brown et al., 2011). direction of change for both
agree on this direction of change intensity and frequency.
• The CMIP3 models are
by 2090.
unable to resolve many of the The majority of CMIP3 models simulate
The majority of CMIP3 models physical processes involved in an increase of approximately 1oC in
simulate little change (-5% to 5%) in producing rainfall. the temperature experienced on the
wet season rainfall by 2030, however 1-in-20-year hot day by 2055 under
by 2090 under the A2 (high) emissions Annual the B1 (low) emissions scenario, with
scenario the majority simulate an Total annual rainfall is projected to an increase of over 2.5°C simulated
increase (>5%), with the remainder increase over the course of the 21st by the majority of models by 2090
simulating little change (Table 16.4). century. There is low confidence in this under the A2 (high) emissions scenario
There is moderate confidence in this direction of change because: (Table 16.4). There is low confidence in
range and distribution of possible this range and distribution of possible
• Projections of annual mean rainfall
futures because: futures because:
tend to be equally divided between
• In simulations of the current climate, an increase (>5%) and little change • In simulations of the current
the CMIP3 models generally locate (-5% to 5%) by 2090, with only a climate, the CMIP3 models tend
the SPCZ in the correct location few models simulating a decrease to underestimate the intensity and
relative to Vanuatu in the wet (• Almost all of the CMIP3 models under the B1 (low) and A1B (medium) current climate, the CVP, CDD and
agree on this direction of change for emissions scenarios. For the A2 (high) GPI methods capture the frequency of
both intensity and frequency. emissions scenario, a small decline tropical cyclone activity reasonably well
from eight to nine times every 20 years (Volume 1, Section 5.4).
The majority of CMIP3 models
in 2030 to seven to eight times by
simulate an increase of at least 15 mm Despite this projected reduction in total
2090 is projected. The frequency
in the amount of rain received on the cyclone numbers, five of the six CCAM
of moderate and severe drought is
1-in‑20‑year wet day by 2055 under 60 km simulations show an increase
projected to remain approximately
the B1 (low) emissions scenario, in the proportion of the most severe
stable, at once to twice and once
with an increase of at least 25 mm cyclones. This increase in wind hazard
every 20 years, respectively.
simulated by 2090 under the A2 (high) coincides with a poleward shift in the
emissions scenario. The majority Tropical Cyclones latitude at which tropical cyclones
of models project that the current are most intense. Most models also
1-in-20-year extreme rainfall event Tropical cyclone numbers are indicate a reduction in tropical cyclone
will occur, on average, three to four projected to decline in the south‑west wind hazard north of 20ºS latitude.
times per 20-year period by 2055 Pacific Ocean basin (0–40ºS,
under the B1 (low) emissions scenario 130ºE– 170ºE) over the course of
and four times per 20-year period by the 21st century. There is moderate 16.7.4 Ocean
2090 under the A2 (high) emissions confidence in this direction of Acidification
scenario. There is low confidence in change because:
The acidification of the ocean will
this range and distribution of possible • Many studies suggest a decline in
continue to increase over the course
futures because: tropical cyclone frequency globally
of the 21st century. There is very
• In simulations of the current (Knutson et al., 2010).
high confidence in this projection
climate, the CMIP3 models tend • Tropical cyclone numbers decline in as the rate of ocean acidification is
to underestimate the intensity the south-west Pacific Ocean in the driven primarily by the increasing
and frequency of extreme rainfall majority assessment techniques. oceanic uptake of carbon dioxide, in
(Volume 1, Section 5.2.4). Based on the direct detection response to rising atmospheric carbon
• The CMIP3 models are unable methodologies (Curvature Vorticity dioxide concentrations.
to resolve many of the physical Parameter (CVP) and the CSIRO Direct Projections from all analysed CMIP3
processes involved in producing Detection Scheme (CDD) described models indicate that the annual
extreme rainfall. in Volume 1, Section 4.8.2), 55% maximum aragonite saturation
of projections show no change or a state will reach values below 3.5 by
Drought
decrease in tropical cyclone formation about 2035 and continue to decline
Little change is projected in the when applied to the CMIP3 climate thereafter (Figure 16.9; Table 16.4).
incidence of drought over the models for which suitable output is There is moderate confidence in this
course of the 21st century. There is available. When these techniques are range and distribution of possible
low confidence in this direction of applied to CCAM, 100% of projections futures because the projections are
change because: show a decrease in tropical cyclone based on climate models without an
• There is only low confidence in formation. In addition, the Genesis explicit representation of the carbon
the range of dry season rainfall Potential Index (GPI) empirical cycle and with relatively low resolution
projections (Section 16.7.2), which technique suggests that conditions for and known regional biases.
directly influences projections of tropical cyclone formation will become
less favourable in the south-west The impact of acidification change on
future drought conditions.
Pacific Ocean basin, for the majority the health of reef ecosystems is likely
The majority of CMIP3 models project (80%) of analysed CMIP3 models. to be compounded by other stressors
that the frequency of mild drought There is moderate confidence in this including coral bleaching, storm
will remain approximately stable from range and distribution of possible damage and fishing pressure.
2030 throughout the 21st century at futures because in simulations of the
seven to eight times every 20 years,
Chapter 16: Vanuatu 255Figure 16.9: Multi-model projections, and their associated uncertainty (shaded area represents two standard deviations), projections of
the maximum annual aragonite saturation state in the sea surface waters of the Vanuatu region under the different emissions scenarios.
The dashed black line represents an aragonite saturation state of 3.5.
16.7.5 Sea Level Figure 16.10; Table 16.4). There Interannual variability of sea level will
is moderate confidence in this lead to periods of lower and higher
Mean sea level is projected to continue range and distribution of possible regional sea levels. In the past, this
to rise over the course of the 21st futures because: interannual variability has been about
century. There is very high confidence 18 cm (5–95% range, after removal
• There is significant uncertainty
in this direction of change because: of the seasonal signal; dashed lines
surrounding ice-sheet contributions
• Sea-level rise is a physically to sea-level rise and a rise larger in Figure 16.10 (a)) and it is likely that
consistent response to increasing than projected above cannot be a similar range will continue through
ocean and atmospheric excluded (Meehl et al., 2007b). the 21st century. In addition, winds
temperatures, due to thermal However, understanding of the and waves associated with weather
expansion of the water and the processes is currently too limited to phenomena will continue to lead to
melting of glaciers and ice caps. provide a best estimate or an upper extreme sea-level events.
• Projections arising from all CMIP3 bound (IPCC, 2007). In addition to the regional variations
models agree on this direction • Globally, since the early 1990s, in sea level associated with ocean
of change. sea level has been rising near the and mass changes, there are
The CMIP3 models simulate a upper end of the above projections. ongoing changes in relative sea level
rise of between approximately During the 21st century, some associated with changes in surface
5–15 cm by 2030, with increases of studies (using semi-empirical loading over the last glacial cycle
20–60 cm indicated by 2090 under models) project faster rates of (glacial isostatic adjustment) and local
the higher emissions scenarios sea‑level rise. tectonic motions. The glacial isostatic
(i.e. A2 (high) and A1B (medium); motions are relatively small for the
PCCSP region.
256 Climate Change in the Pacific: Scientific Assessment and New Research | Volume 2: Country ReportsFigure 16.10: Observed and projected relative sea-level change near Vanuatu. (a) The observed in situ relative sea-level records are
indicated in red, with the satellite record (since 1993) in light blue. The gridded sea level at Vanuatu (since 1950, from Church and
White (in press)) is shown in orange. The projections for the A1B (medium) emissions scenario (5–95% uncertainty range) are shown by
the green shaded region from 1990–2100. The range of projections for the B1 (low), A1B (medium) and A2 (high) emissions scenarios
are also shown by the bars on the right. The dashed lines are an estimate of interannual variability in sea level (5–95% range about
the long-term trends) and indicate that individual monthly averages of sea level can be above or below longer-term averages. (b)
The projections (in cm) for the A1B (medium) emissions scenario in the Vanuatu region for the average over 2081–2100 relative to
1981–2000 are indicated by the shading, with the estimated uncertainty in the projections indicated by the contours (in cm).
Chapter 16: Vanuatu 25716.7.6 Projections Table 16.4: Projected change in the annual and seasonal-mean climate for Vanuatu,
under the B1 (low; blue), A1B (medium; green) and A2 (high; purple) emissions scenarios.
Summary Projections are given for three 20-year periods centred on 2030 (2020–2039), 2055
(2046–2065) and 2090 (2080–2099), relative to 1990 (1980–1999). Values represent the
The projections presented in Section
multi-model mean change ± twice the inter-model standard deviation (representing
16.7 are summarised in Table 16.4. approximately 95% of the range of model projections), except for sea level where the
For detailed information regarding estimated mean change and the 5–95% range are given (as they are derived directly
the various uncertainties associated from the Intergovernmental Panel on Climate Change Fourth Assessment Report
with the table values, refer to the values). The confidence (Section 1.7.2) associated with the range and distribution of the
preceding text in Sections 16.7 and projections is also given (indicated by the standard deviation and multi-model mean,
1.7, in addition to Chapters 5 and respectively). See Volume 1, Appendix 1 for a complete listing of CMIP3 models used to
6 in Volume 1. When interpreting derive these projections.
the differences between projections
for the B1 (low), A1B (medium) and Variable Season 2030 2055 2090 Confidence
A2 (high) emissions scenarios, it Surface air Annual +0.6 ± 0.4 +1.0 ± 0.5 +1.4 ± 0.7 High
is also important to consider the temperature (°C) +0.7 ± 0.4 +1.4 ± 0.6 +2.2 ± 0.9
emissions pathways associated with +0.7 ± 0.3 +1.4 ± 0.3 +2.6 ± 0.6
each scenario (Volume 1, Figure 4.1) Maximum 1-in-20-year N/A +1.0 ± 0.6 +1.3 ± 0.5 Low
and the fact that a slightly different temperature (oC) event +1.5 ± 0.7 +2.1 ± 0.9
subset of models was available for +1.5 ± 0.5 +2.6 ± 1.2
each (Volume 1, Appendix 1). Minimum 1-in-20-year N/A +1.2 ± 1.8 +1.5 ± 1.8 Low
temperature (oC) event +1.5 ± 1.9 +2.0 ± 1.9
+1.5 ± 1.7 +2.3 ± 1.8
Total rainfall (%)* Annual +3 ± 9 +1 ± 12 +1 ± 16 Low
+2 ± 11 +3 ± 15 +3 ± 19
+1 ± 17 +3 ± 16 +8 ± 20
Wet season November- +5 ± 8 +3 ± 12 +3 ± 15 Moderate
rainfall (%)* April +3 ± 11 +5 ± 15 +7 ± 19
+3 ± 17 +5 ± 15 +11 ± 18
Dry season May-October 0 ± 16 -4 ± 20 -2 ± 23 Low
rainfall (%)* +1 ± 20 -1 ± 24 -4 ± 25
-2 ± 22 -1 ± 27 +2 ± 31
Sea-surface Annual +0.6 ± 0.4 +0.9 ± 0.5 +1.3 ± 0.5 High
temperature (°C) +0.6 ± 0.3 +1.2 ± 0.5 +2.0 ± 0.7
+ 0.6 ± 0.4 +1.3 ± 0.4 +2.5 ± 0.6
Aragonite Annual +3.5 ± 0.1 +3.2 ± 0.1 +3.1 ± 0.1 Moderate
saturation state maximum +3.4 ± 0.1 +3.0 ± 0.1 +2.6 ± 0.1
(Ωar)
+3.4 ± 0.1 +3.0 ± 0.1 +2.5 ± 0.1
Mean sea level Annual +10 (5–16) +19 (10–27) +32 (17–47) Moderate
(cm) +10 (5–16) +20 (8–31) +40 (20–59)
+10 (3–17) +19 (7–31) +42 (21–63)
*The MIROC3.2(medres) and MIROC3.2(hires) models were eliminated in calculating the
rainfall projections, due to their inability to accurately simulate present-day activity of the South
Pacific Convergence Zone (Volume 1, Section 5.5.1).
258 Climate Change in the Pacific: Scientific Assessment and New Research | Volume 2: Country ReportsYou can also read