The CSIRO-Mk3.6.0 Atmosphere-Ocean GCM: participation in CMIP5 and data publication
←
→
Page content transcription
If your browser does not render page correctly, please read the page content below
19th International Congress on Modelling and Simulation, Perth, Australia, 12–16 December 2011
http://mssanz.org.au/modsim2011

           The CSIRO-Mk3.6.0 Atmosphere-Ocean GCM:
            participation in CMIP5 and data publication
       M.A. Colliera, S.J. Jeffreyb, L.D. Rotstayna, K.K-H. Wongb, S. M. Dravitzkia ,C. Moesenederc,
             C. Hamalainenb, J.I. Syktusb, R. Suppiaha, J. Antonyd, A. El Zeind and M. Atifd
   a
      The Centre for Australian Weather and Climate Research, CSIRO Marine and Atmospheric Research,
                                            Aspendale, Victoria
   b
     The Queensland Climate Change Centre of Excellence, Ecosciences Precinct, Dutton Park, Queensland
         c
           CSIRO Marine and Atmospheric Research, Ecosciences Precinct , Dutton Park, Queensland
 d
   National Computation Infrastructure National Facility, Australian National University, Australian Capital
                                                 Territory
                                        Email: mark.collier@csiro.au

Abstract: The participation of the CSIRO-Mk3.6.0 Atmosphere Ocean Global Climate Model (AOGCM)
in the Coupled Model Intercomparison Project Phase 5 (CMIP5) is a joint initiative between the Queensland
Climate Change Centre of Excellence and the Commonwealth Scientific and Industrial Research
Organisation (CSIRO). It now has approximately 10 research and support scientists working on this project
which first began in 2009. This on-going project consists of the following four main components:
       •   A model design and testing period to ensure that the model had acceptable configuration for
           participation in CMIP5, in particular, exhibiting a realistic present-day climate and a stable pre-
           industrial climate;
       •   A model integration phase where CMIP5 experiments were performed. These were to include the
           so-called “core” experiments plus a number of “tier1” and “tier2” experiments, which will constitute
           a significant submission to CMIP5 and to address local climate modelling needs and applications;
       •   Post-processing of the raw CSIRO-Mk3.6.0 model output into internationally recognised and
           standardized CMIP5 form; and
       •   Quality control and publication phase of the CSIRO-Mk3.6.0 data to ensure entry into the Earth
           System Grid (ESG) Federation, allowing it to be disseminated to the CMIP5 international
           community.
In this paper the four phases of this climate modelling project will be discussed in detail. The main emphasis
is to make potentially interested researchers aware of the CSIRO-Mk3.6.0 climate model submission and to
elucidate the range and features of the datasets that are now available. The CMIP5 datasets are being hosted
on the ESG which consists of international data nodes and gateways, including Australia’s own node hosted
by the National Computing Infrastructure (NCI) National Facility in Canberra. A key outcome of our efforts
is the generation of over 150, mostly high priority, uniquely defined parameters from the list of requested
model output to understand climate processes and also produce new climate change projection data for
impact assessment. Some preliminary results of the CSIRO-Mk3.6.0 model are presented to illustrate the
usefulness of this dataset in this research area.

Keywords: CMIP5, AR5, AOGCM, climate change simulations, Earth System Grid

                                                    2691
Collier et al., The CSIRO Mk 3-6-0 Atmosphere-Ocean GCM: participation in CMIP5 and data publication

1.   INTRODUCTION
The partnership between the Commonwealth Scientific and Industrial Research Organisation (CSIRO) and
Queensland Climate Change Centre of Excellence (QCCCE) in the Coupled Model Intercomparison Project
Phase 5 (CMIP5) has quite possibly delivered the largest and scientifically most comprehensive set of
Atmosphere-Ocean Global Climate Model data ever generated in Australia. Although there is a need to make
these datasets available to climate analysts around the world, there is a particular need in Australia for a
comprehensive set of climate experiments. This will facilitate research into the important drivers of Australian
climate. CSIRO has participated in the CMIP modelling activity before (Collier et al., 2007) however the data
volume is an order of magnitude greater than the previous model intercomparison (Collier et al., 2011a,b).

2.   WHAT IS CMIP5?
CMIP5 is an internationally coordinated effort to use state-of-the-art Global Climate Models (GCMs) and Earth
System Models (GCMs which include interactive carbon and/or ocean biogeochemistry) to perform a set of pre-
defined experiments (Taylor et al., 2011). Scientific publications arising from analysis of CMIP5 data will be
used to assess climate change science, most directly through the publication of the Intergovernmental Panel on
Climate Change (IPCC) Fifth Assessment Report (AR5) due to be published in 2013. CMIP5 has taken datasets
from a range of internationally recognised climate models and has built an archive that can be readily analysed
because all datasets have a consistent format. The strict formatting requirements also necessitated an
unprecedented approach to quality control (see Sec. 5 for details). To end-users, the CMIP5 data archive will
provide an efficient means for locating and obtaining datasets for local analysis. CMIP5 datasets are being made
publicly available via the Earth System Grid (ESG) federation of services. Users will identify the desired
dataset(s) through a series of ESG gateways and will then be directed to the appropriate data node to download
the desired dataset(s) to their local machine.

3.   CSIRO-MK3.6.0 AOGCM
The CSIRO-Mk3.6.0 model, hereafter called Mk3.6, is an upgrade from the CSIRO-Mk3.5 GCM (Gordon et al.,
2010). Details of the model are given by Rotstayn et al. (2010). The atmospheric component has a horizontal
resolution of approximately 1.9°x1.9° and every atmospheric grid-point is coupled to two ocean grid-points.
This enhanced north-south resolution in the ocean component is expected to increase the capacity for the ocean
to simulate important tropical and extra-tropical seasonal interactions. The atmosphere has 18 vertical levels
whereas the ocean has 30 levels with most found in the upper 1500m. By far the most important improvement
of the Mk3.6 model from its predecessor is the inclusion of an interactive aerosol scheme that also required an
update to the radiation scheme used in the model (Rotstayn et al., 2010). This allows for the investigation of the
impact of a number of aerosol agents on climate. For example, a recent study by Rotstayn et al. (2011a)
investigated the impact of mineral dust on Australian rainfall by turning it on and off in two experiments. The
study found that an accurate simulation of the El Niño-Southern oscillation (ENSO)-rainfall relationship over
Australia might require realistic representation of processes associated with sources and deposition of Australian
dust.

      Figure 1. Global average surface air                    Figure 2. Global average volume weighted a)
 temperature (°C) for the CSIRO-Mk3.6.0 pre-                 ocean potential temperature (°C) and b) salinity
industrial control experiment. The dashed line is                (psu-34.0) for the CSIRO-Mk3.6.0 pre-
              the 500 year average.                                  industrial control experiment.
To have confidence in a climate model’s ability to realistically simulate present and future climate conditions it
is necessary for it to be able to respond in a satisfactory manner when driven by pre-industrial (year 1850)
forcings. An important indicator of this is the stability of the model solution which includes negligible drift in
important climate indices and one devoid of irregular behavior. Figure 1 shows globally averaged annual

                                                    2692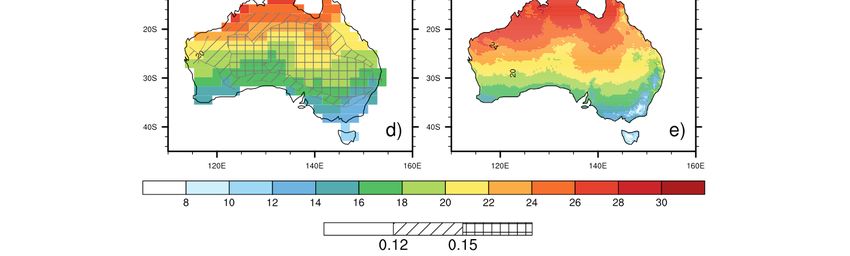
Collier et al., The CSIRO Mk 3-6-0 Atmosphere-Ocean GCM: participation in CMIP5 and data publication

surface temperature from the pre-industrial control experiment, which appears to be stable during the 500 year
long experiment. Figure 2 shows the ocean potential temperature and salinity (practical salinity units). The
ocean temperature drift in the Mk3.6 is 0.02°C/century, which is comparable to other coupled climate models.
The salinity drift is also and indicates the global precipitation and evaporation are not perfectly balanced in the
model, at least on these time-scales.

4.     CSIRO-MK3.6.0 MODEL INTEGRATION
In this section we describe the computing facilities that were used for the integration of the Mk3.6 AOGCM for
CMIP5. In addition the list of experiments will be presented with essential details on their characteristics,
including their name, the number of ensembles and the output model years.

4.1.     QCCCE Computing Facility
The complete set of Mk3.6 experiments was run on the Queensland Government Department of Environment
and Resource Management’s High Performance Computing facilities. Original experimentation began in
January 2010 and most of the key experimentation finished in July 2011, however, the long model integrations
out to the year 2300 are expected to be finished in late 2011. Although the computing resources were adequate
for this project the model output needed to be transferred to the National Computing Infrastructure (NCI)
National Facility (NF) in Canberra for data hosting.
The CMIP5 experiments conducted with the Mk3.6 climate model are listed in Table 1. Most of the experiments
were performed using a fully coupled (AOGCM) whereas some with an atmosphere/land/sea-ice only (AGCM).
See          http://cmip-pcmdi.llnl.gov/cmip5/docs/Taylor_CMIP5_design.pdf          and          http://cmip-
pcmdi.llnl.gov/cmip5/docs/cmip5_data_reference_syntax.pdf for details of experimental design and on standard
naming                                                                                          conventions.
     Table 1. CSIRO-Mk3.6.0 CMIP5 experiments. See text for details. Notes: † ensemble members 1-3 are
         extended to 2300; †† ensemble members 2-12 are 5 years in length consistent with the CMIP5
     specification; and ††† experiment commenced in 1950 as ozone changes prior to 1950 were considered
                                                 negligible.

           Experiment                 CMIP5 Experiment        Type            Ensemble size        Years

           piControl                  3.1                     AOGCM           1                    1-500
           historical                 3.2                     AOGCM           10                   1850-2005
           amip                       3.3                     AGCM            10                   1979-2009
           midHolocene                3.4                     AOGCM           1                    1-100
           rcp45                      4.1                     AOGCM           10                   2006-2100†
           rcp85                      4.2                     AOGCM           10                   2006-2100†
           rcp26                      4.3                     AOGCM           10                   2006-2100
           rcp60                      4.4                     AOGCM           10                   2006-2100
           1pctCO2                    6.1                     AOGCM           1                    1-140
           sstClim                    6.2a                    AGCM            1                    30
           sstClim4xCO2               6.2b                    AGCM            1                    30
           abrupt4xCO2                6.3                     AOGCM           12                   1-150††
           sstClimAerosol             6.4a                    AGCM            1                    1-30
           sstClimSulfate             6.4b                    AGCM            1                    1-30
           historicalNat              7.1                     AOGCM           10                   1850-2012
           historicalGHG              7.2                     AOGCM           10                   1850-2005
           historicalAnt              7.3a                    AOGCM           10                   1850-2005
           historicalNoOz             7.3b                    AOGCM           10                   1950-2012†††
           historicalNoAA             7.3c                    AOGCM           10                   1850-2005
           historicalAA               7.3d                    AOGCM           10                   1850-2012
           historicalAntNoAA1         7.3e                    AOGCM           10                   1850-2012

5.     POST-PROCESSING INTO CMIP5 FORM
The model development and experimentation was a significant challenge: Mk3.6 is the culmination of over 30
years of model development (Smith, 2007). Once the experimentation was complete, the post-processing and
publishing cycles also required a substantial amount of work and data processing. Post-processing of model

1
    This experiment was designed to isolate the effect of Asian aerosols, in the manner of Rotstayn et al. (2007).

                                                       2693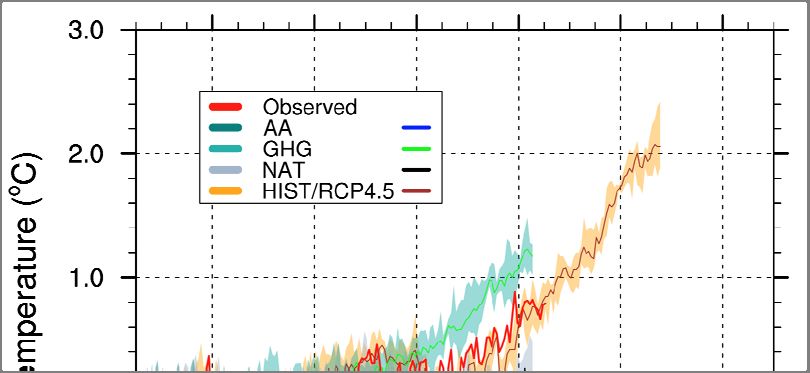
Collier et al., The CSIRO Mk 3-6-0 Atmosphere-Ocean GCM: participation in CMIP5 and data publication

output was done using the Coupled Model Output Rewriter (CMOR, http://www2-pcmdi.llnl.gov/cmor), and
publishing of model data was partially automated by the Earth System Grid data hosting infrastructure.
CMOR is a library that can be used to reformat datasets to a standard prescribed in user-defined tables. By
adopting CMOR, the task of reformatting the raw model output to CMIP5 specifications was reduced to writing
customised software to load the raw datasets and perform any required derivations or modifications of data. The
model data was converted to CMIP5 form using CMOR format-specification tables provided by CMIP5. In
addition to reducing the complexity of the post-processing task, the use of CMOR is also expected to improve
the quality of the data because CMOR: (i) performs some rudimentary error checking; and (ii) automatically
formats the metadata to CMIP5 standards.
The in-house software package can become extremely complicated and sophisticated in itself, as it has to
consider technical issues associated with the raw model output and supply the necessary objects to CMOR.
Necessary inputs can be simple text strings like the institution name but could also involve complex
calculations, for example the derivations of parameters or interpolation from model hybrid coordinates to
standard pressure levels.

6.     QUALITY CONTROL AND PUBLISHING ON THE NCI NF ESG
This section gives details of the Quality Control (QC) approach taken to ensure that the Mk3.6 model output
satisfy the CMIP5 standard. An explanation of how the final submitted data were published is also provided.

6.1.    The QC and QCWrapper utilities
One of the most significant shortcomings of the previous activity CMIP3 was the inadequate level of QC
conducted on datasets. CMIP5 has a range of QC Levels (QCLs) which are performed at different stages of the
post-processing and publishing cycle. By adopting the CMOR interface QCL1 and QCL2 standards are
essentially achieved (see http://purl.org/org/cmip5/qc for background information). For more comprehensive
checking, the QC tool was used to check all Mk3.6 datasets that were submitted. QC uses a wrapper to impose
project-specific requirements; in this case the CMIP5 wrapper was used. When examining a file, QC checks the
time coordinate, metadata and data block. The data are scanned to detect values that are missing or replicated,
and some statistical properties, such as the global maximum, minimum, mean and standard deviation are
computed. While the information from the QC tool is very useful, it is still nevertheless at the discretion of the
modeling centre to act on any warnings or errors provided. One extremely useful output from the QC tool is a
NetCDF file containing the global mean and standard deviation for each time slice in the input file that was
examined. Plotting the mean and standard deviation can be useful in detecting gross errors in the model data
and/or processing system. While there may be hundreds of plots for each experiment, these can be scanned
through quite quickly. Final QCL3 checks will eventually be performed by the ESG community on the archived
datasets allowing the allocation of a Digital Objective Identifier (DOI) in essence giving the datasets persistence
and citable credentials in the digital environment.

7.     SIMULATNG PRESENT CLIMATE
In this section we will present some results based on annual average conditions, particularly focusing on near
(2m) surface air temperature and rainfall. In the future we expect to expand this work focusing on seasonally
based temperature, mean sea-level pressure and rainfall projections over Australia.
 By the end of August 2011 the processed output from the CSIRO-Mk3.6.0 model for a number of key CMIP5
experiments had been published on the NCI ESG gateway. It is expected that the research community both in
Australia and abroad will undertake extensive analysis of these datasets. Prior to peer-review publications,
preliminary results based on the raw model output have been published elsewhere (see for example, Syktus et al.
2011).
In this section we present some results based on annual average conditions, particularly focusing on near (2m)
surface air temperature and rainfall.
                                                              presented: (i) the historical run with all forcings
7.1.    GLOBAL TEMPERATURE RESPONSE
                                                              extended to 2100 by using forcing data from
The model simulated global average near-surface               Representative Concentration Pathway (RCP) 4.5
air temperature for the period 1850-2055 and                  (HIST/RCP4.5); (ii) natural forcings only (NAT);
observed (Brohan et al., 2006) data from 1850 to              (iii) greenhouse gas forcings only (GHG); and (iv)
2010 are shown in Figure 3. The data are presented            anthropogenic aerosol forcings only (AA). The
as anomalies relative to the 1850-1879 base period.           NAT, GHG and AA experiments are driven by the
The results for four historical experiments are               observed values for the relevant forcing (natural,

                                                      2694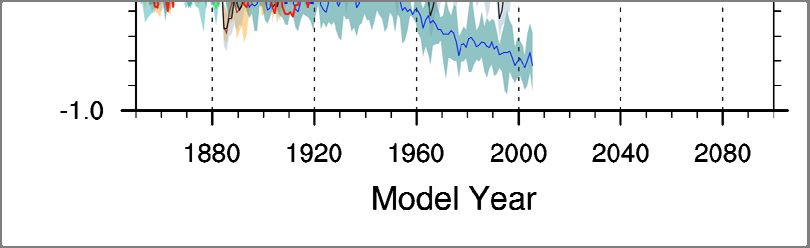
Collier et al., The CSIRO Mk 3-6-0 Atmosphere-Ocean GCM: participation in CMIP5 and data publication
greenhouse gases and anthropogenic aerosols,
respectively), with all other forcings held constant
at pre-industrial (1850) levels. All model Table 2. Summary of statistics for near surface
experiment data are based on a 5 member ensemble air temperature (Tsc) and annual average
average. The HIST experiment shows the best precipitation (Pr) for the period 1980-2005 for
agreement with the observations, as also seen in the all-forcings (HIST) experiment 5 member
earlier simulations that include aerosol forcing. ensemble. Average (ave), standard-devation (sd),
root-mean-square (rms) error and pattern
correlation (corr) are shown. Minimum and
maximum ensemble values are shown by
subscripts min and max respectively.
Observations have been interpolated onto the
model grid for calculating these statistics.
AWAP observational values are shown in
parentheses.
ave avemin avemax sd rms corr
(°C)
Tsc 21.02 20.96 21.13 0.066 1.52 0.95
(22.04)
Pr 1.37 1.31 1.40 0.036 0.58 0.78
(1.30)
Figure 3. Global average surface air
temperature (°C) for four CSIRO-Mk3.6.0
experiments and HadCRUT observations. Filled
areas show the range based on the 5 member
ensemble and solid lines are ensemble means.
7.2. PRESENT DAY CLIMATE AND ATTRIBUTION STUDY
The model simulated and observed AWAP (Australian Water Availability Project, Jones et al., 2009) near-
surface air temperature and precipitation for Australia are shown in Figure 4. The 5 member ensemble mean for
the period 1980-2005 is presented, with the ensemble standard deviation indicated by hatching. Regions
exhibiting a relatively high standard deviation indicate a wide range in the ensemble members, indicating the
potential for more uncertainty in the ensemble mean due to different forcings. A comparison of spatial patterns
of simulated temperature for the HIST experiment (Figure 4a) and observations (Figure 4e) indicates the Mk3.6
model reproduces the observed pattern, although the model underestimates the mean in the south and
continental interior. The historical experiment driven only by natural forcings (NAT) (Figure 4b) shows slightly
lower temperatures compared to the all forcings experiment (Figure 4a), while the experiment driven only by
greenhouse gases (GHG) (Figure 4c) overestimates the temperature over the continent. In contrast, the
experiment driven only by anthropogenic aerosols (AA) (Figure 4d) slightly underestimates the observed
pattern, consistent with the net cooling effect expected of such aerosols. Maps showing the differences between
the results of the various attribution experiments would enable greater differentiation between the impacts of the
various drivers, and will be the topic of further investigation. Standard deviations based on ensemble members
are higher over marginal areas of southeast and central northwest.
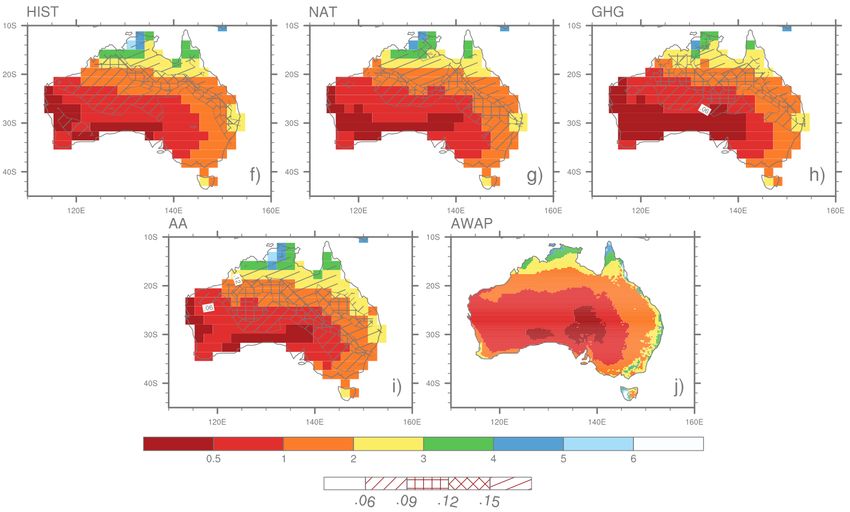
The model simulated precipitation is shown by panels f-j of Figure 4 indicating good agreement with the
observed spatial pattern, although there appears to be a dry bias, particularly in the south-west and south-east. It
should be noted that the annual average rainfall does not reflect the important characteristics of the seasonal
rainfall distribution and therefore an analysis of the seasonal rainfall distribution will be required for a better
assessment of model skill in simulating the Australian rainfall.
An analysis of attribution experiments can provide important assessment potential roles of various climate
forcing factors that affect Australian climate. A recent study by Rotstayn et al (2011b) provides an insightful
example of the technique.
The model performance in the Australian region for the all-forcings HIST experiment is summarised in Table 2.
The ensemble mean near surface air temperature is 21.03 °C for the period 1980-2005, compared to an observed
value of 22.04 °C. The root mean square error is 1.52 °C and the pattern correlation is 0.95. The ensemble mean
annual average precipitation is 1.37 mm/day for the period 1980-2005, compared to an observed value of 1.30
mm/day. The root mean square error is 0.58 mm/day and the pattern correlation is 0.78. The statistics for both
2695Collier et al., The CSIRO Mk 3-6-0 Atmosphere-Ocean GCM: participation in CMIP5 and data publication
near surface air temperature and precipitation indicate sound model performance using the demerit point system
of Suppiah et al. (2007). Standard deviations based on the 5-member ensemble are higher over central and
eastern Australia.
Figure 4. Annual average near surface air temperature (panels a-e, °C) and precipitation (panels f-j,
mm/day) simulated by the CSIRO-Mk3.6.0 and observations (AWAP). The hatching indicates the 5
member ensemble standard deviation (°C and mm/day, respectively). HIST, NAT, GHG, AA refer to
experiments historical, historicalNat, historicalGHG and historicalAA from Table 1.
2696Collier et al., The CSIRO Mk 3-6-0 Atmosphere-Ocean GCM: participation in CMIP5 and data publication
8. DISCUSSION AND CONCLUSIONS
In this paper we have described the experimentation, post-processing, quality control and publishing phases
involved in preparing the Mk3.6 datasets for submission to the CMIP5 data archive. The most novel aspects of
the submission are the relatively large ensemble sizes used in the experiments, and the range of historical
experiments undertaken. The attribution experiments will provide a rich dataset for elucidating the key drivers
of change in Australia’s climate. It is envisaged that the submission will be used in many climate change
detection and attribution studies that will be used to prepare the IPCC 5th Assessment Report, due for release in
2013. Moreover, the datasets will be of great interest to the Australian scientific community well beyond AR5,
providing the agencies that supported this work with a significant return on investment. Our early analysis
suggests that the Mk3.6 model soundly simulates present day screen temperature and precipitation over
Australia, lending credence to the future projections generated by the model.
REFERENCES
Brohan, P., J. J.Kennedy, I. Harris, S. F. B. Tett, and P. D. Jones (2006), Uncertainty estimates in regional and
global observed temperature changes: A new data set from 1850, J. Geophys. Res., 111, D12106,
doi:10.1029/2005JD006548
Collier, M.A., Dix, M.R. and A.C. Hirst (2007). CSIRO Mk3 Climate System Model and Meeting the Strict
IPCC AR4 Data Requirements. MODSIM08 Extended Abstract, Christchurch, New Zealand.
Collier, M.A., Jeffrey, S., Dix, M.R., Hirst, A.C and L.D. Rotstayn (2011a). Dealing with and contributing to
the CMIP5 data ‘tsunami’ and beyond from an Australian perspective. Greenhouse 2001, Cairns, 4-18th April
2011.
Collier, M.A., Jeffrey, S. and L.D. Rotstayn (2011b). The latest Australian CMIP climate model submission.
BAMOS, October edition, in press.
Gordon, H.B. and co-authors (2010). The CSIRO Mk3.5 Climate Model. CAWCR Technical Report No. 21,
74pp.
Jones, D. A., Wang, W., and Fawcett, R. (2009) High-quality spatial climate data-sets for Australia, Aust.
Meteorol. Oceanogr. J., 58, 233–248.
Rotstayn, L.D., Collier, M.A., Dix, M.R., Feng, Y., Gordon, H.B., O’Farrell, S.P., Smith, I.N. and J.I. Syktus
(2010). Improved Simulation of Australian Climate and ENSO-related rainfall variability in a global climate
model with interactive aerosol treatment. Int. J. Climatol. 30: 1067-1088. doi: 10.1002/joc.1952.
Rotstayn, L.D., Collier, M.A., Mitchell, R.M., Qin, Y., S.K. Campbell and S. M. Dravitzki (2011a). Simulated
enhancement of ENSO-related rainfall variability due to Australian dust. Atmos. Chem. Phys., 11, 6575–6592,
doi: 10.5194/acp-11-6575-2011.
Rotstayn, L.D., Jeffrey, S.J., Syktus, J.I., Collier, M.A., Dravitzki, S.M., Hirst, A.C. and K.K-H. Wong (2011b).
Have anthropogenic aerosols delayed greenhouse gas-induced changes in Indo-Pacific regional circulation and
rainfall? Atmospheric Science Letters, submitted.
Smith, I. (2007). Global climate modelling within CSIRO: 1981 to 2006, Aust. Meteorol. Mag., 56, 153-166.
Suppiah, R., Hennessy, K.J., Whetton, P.H., McInnes, K., Macadam, I, Bathols, J., Ricketts, J. and C.M. Page
(2007). Australian climate change projections derived from simulations performed for the IPCC 4th Assessment
Report, Aust. Met. Mag., 56, 131-152.
Syktus, J., Wong, K.K-H., Rotstayn, L.D., Jeffrey, S., Zhang, H., Toombs, N.R. and M.A. Collier (2011).
Australia’s hotter and drier future: Climate change projections using CMIP5 experimental design and the
CSIRO Mk3.6 climate model. Greenhouse 2011, Cairns, 4-18th April 2011.
Taylor, K.E., Stouffer, R.J. and G.A. Meehl (2011). A Summary of the CMIP5 Experiment Design. Available in
electronic form: http://cmip-pcmdi.llnl.gov/cmip5/docs/Taylor_CMIP5_design.pdf.
2697You can also read