Joint Venture with Mapletree Investments to Acquire US$750 million Data Centre Portfolio in the United States - 24 October 2017
←
→
Page content transcription
If your browser does not render page correctly, please read the page content below
Joint Venture with Mapletree Investments to
Acquire US$750 million Data Centre Portfolio in
the United States
24 October 2017
Important Notice
This presentation has been prepared by Mapletree Industrial Trust Management Ltd., as the manager of Mapletree Industrial Trust (“MIT”, and the manager of MIT, the “Manager”) for the
sole purpose of use at this presentation and should not be used for any other purposes. The information and opinions in this presentation are provided as at the date of this document
(unless stated otherwise), are subject to change without notice, its accuracy is not guaranteed and it may not contain all material information concerning MIT. Neither the Manager, MIT nor
any of their respective affiliates, advisors and representatives or any of their respective holding companies, subsidiaries, affiliates, associated undertakings or controlling persons, or any of
their respective directors, officers, partners, employees, agents, representatives, advisers (including any book runner and underwriter in respect of any equity fund raising that may be
undertaken by the Manager) or legal advisers make any representation or warranty, express or implied and whether as to the past or the future regarding, and assumes no responsibility or
liability whatsoever (in negligence or otherwise) for, the fairness, accuracy, completeness or correctness of, or any errors or omissions in, any information contained herein or as to the
reasonableness of any assumption contained herein or therein, nor for any loss howsoever arising whether directly or indirectly from any use, reliance or distribution of these materials or its
contents or otherwise arising in connection with this presentation. Further, nothing in this document should be construed as constituting legal, business, tax or financial advice. None of
Mapletree Investments Pte Ltd (the "Sponsor"), MIT, the Manager, DBS Trustee Limited (as trustee of MIT) or their respective subsidiaries, affiliates, advisors, agents or representatives
have independently verified, approved or endorsed the material herein.
The information contained in this presentation includes historical information about and relevant to the assets of MIT that should not be regarded as an indication of the future performance
or results of such assets. This presentation contains forward-looking statements that may be identified by their use of words like “plans”, “expects”, “will”, “anticipated”, “believes”, “intends”,
“depends”, “projection”, “estimates” or other words of similar meaning and that involve assumptions, risks and uncertainties. All statements that address expectations or projections about
the future and all statements other than statements of historical facts included in this presentation, including, but not limited to, statements about the strategy for growth, product
development, market position, expenditures, and financial results, are forward-looking statements. Such forward-looking statements are based on certain assumptions and expectations of
future events regarding MIT's present and future business strategies and the environment in which MIT will operate, and must be read together with those assumptions. The Manager does
not guarantee that these assumptions and expectations are accurate or will be realised. Actual future performance, outcomes and results may differ materially from those expressed in
forward-looking statements as a result of a number of risks, uncertainties and assumptions. Although the Manager believes that such forward-looking statements are based on reasonable
assumptions, it can give no assurance that such expectations will be met. Representative examples of these risks, uncertainties and assumptions include (without limitation) general industry
and economic conditions, interest rate trends, cost of capital and capital availability, competition from other companies, shifts in customer demands, customers and partners, changes in
operating expenses including employee wages, benefits and training, governmental and public policy changes and the continued availability of financing in the amounts and the terms
necessary to support future business. Predictions, projections or forecasts of the economy or economic trends of the markets are not necessarily indicative of the future or likely
performance of MIT. Past performance is not necessarily indicative of future performance. The forecast financial performance of MIT is not guaranteed. You are cautioned not to place
undue reliance on these forward-looking statements, which are based on the Manager’s current view of future events. No assurance can be given that the future events will occur or that
projections will be achieved. The Manager does not assume any responsibility to amend, modify or revise any forward-looking statements, on the basis of any subsequent developments,
information or events, or otherwise. You should conduct your own independent analysis of the Sponsor, the Manager and MIT, including consulting your own independent legal, business,
tax and financial advisers and other advisers in order to make an independent determination of the suitability, merits and consequences of investment in MIT.
These materials contain a summary only and do not purport to contain all of the information that may be required to evaluate any potential transaction mentioned in this presentation,
including the acquisition by Mapletree Redwood Data Centre Trust of 14 data centres in the United States of America, which may or may not proceed. The information set out in this
presentation is for information only and is not intended to form the basis of any contract. By attending this presentation, you agree that you will not rely on any representation or warranty
implied herein or the information contained herein in any action or decision you may take or make. This presentation does not constitute or form part of an offer, solicitation, recommendation
or invitation for the sale or purchase of securities or of any of the assets, business or undertakings described herein. No part of it nor the fact of its presentation shall form the basis of or be
relied upon in connection with any investment decision, contract or commitment whatsoever.
This presentation is being provided to you for the purpose of providing information in relation to the forthcoming transaction by MIT. Therefore, this presentation is not being distributed by,
nor has it been approved for the purposes of section 21 of the Financial Services and Markets Act 2000 (“FSMA”) by, a person authorised under FSMA. This presentation is being
communicated only to persons in the United Kingdom who are (i) authorised firms under the FSMA and certain other investment professionals falling within article 19 of the FSMA (Financial
Promotion) Order 2005 (the "FPO") and directors, officers and employees acting for such entities in relation to investment; (ii) high value entities falling within article 49 of the FPO and
directors, officers and employees acting for such entities in relation to investment; (iii) certified sophisticated investors falling within article 50 of the FPO; or (iv) persons to whom it may
otherwise lawfully be communicated.
Nothing in this presentation constitutes or forms a part of any offer to sell or solicitation of any offer to purchase or subscribe for securities for sale in the United States, the European
Economic Area, Japan, Australia, Singapore or any other jurisdiction. The securities of MIT will not be registered under the U.S. Securities Act of 1933, as amended (the "Securities Act") or
under the securities laws of any state or other jurisdiction of the United States, and may not be offered or sold within the United States except pursuant to an exemption from, or transactions
not subject to, the registration requirements of the Securities Act and in compliance with any applicable state securities laws. The Manager does not intend to conduct a public offering of
any securities of MIT in the United States. Neither this presentation nor any part thereof may be (a) used or relied upon by any other party or for any other purpose, (b) copied, photocopied,
duplicated or otherwise reproduced in any form or by any means, or (c) forwarded, published, redistributed, passed on or otherwise disseminated or quoted, directly or indirectly, to any
other person either in your organisation or elsewhere
2
Contents

    1      Overview

    2      Co-investment with Mapletree Investments

    3      Rationale for Proposed Acquisition

    4      Funding Structure and Financial Impact

    5      Conclusion

    6      Appendix: Details of Target Portfolio

3
OVERVIEW
7337 Trade Street, San Diego
Overview of the Co-investment and Proposed Acquisition
MIT’s first overseas acquisition of 14 data centres in United States
Co-investment with its Sponsor, Mapletree Investments Pte Ltd (“MIPL”), with MIT taking 40%
interest in Mapletree Redwood Data Centre Trust (“MRDCT”)
Sponsor granted MIT the right of first refusal to acquire remaining 60% interest in MRDCT
Description Portfolio of 14 data centres in United States
Purchase consideration US$750.0 million (S$1,020.0 million)1
Total valuation2 US$776.4 million (S$1,055.9 million)
Total acquisition cost US$754.2 million (S$1,025.7 million)
Vendor Carter Validus Mission Critical REIT, Inc.
Land area 8.2 million sq ft
Land tenure Freehold3
Total net lettable area (“NLA”)4 2.3 million sq ft
Weighted average lease to expiry (“WALE”)5 6.7 years (by gross rental income)
Occupancy rate5 97.4%
Target Completion date 4Q2017
1 Unless otherwise stated, an illustrative exchange rate of US$1.00 to S$1.36 is used in this presentation.
2 Independent valuation by Cushman & Wakefield Western, Inc (“C&W”) conducted in Aug and Sep 2017, using the sales comparison and income capitalisation approach.
3 All properties are sited on freehold land, except for the parking deck (150 Carnegie Way) at 180 Peachtree. As at 30 Sep 2017, the parking deck has a remaining land lease
tenure of approximately 38.2 years, with an option to renew for an additional 40 years.
4 Excludes the parking decks (150 Carnegie Way and 171 Carnegie Way) at 180 Peachtree.
5 5 As at 30 Sep 2017.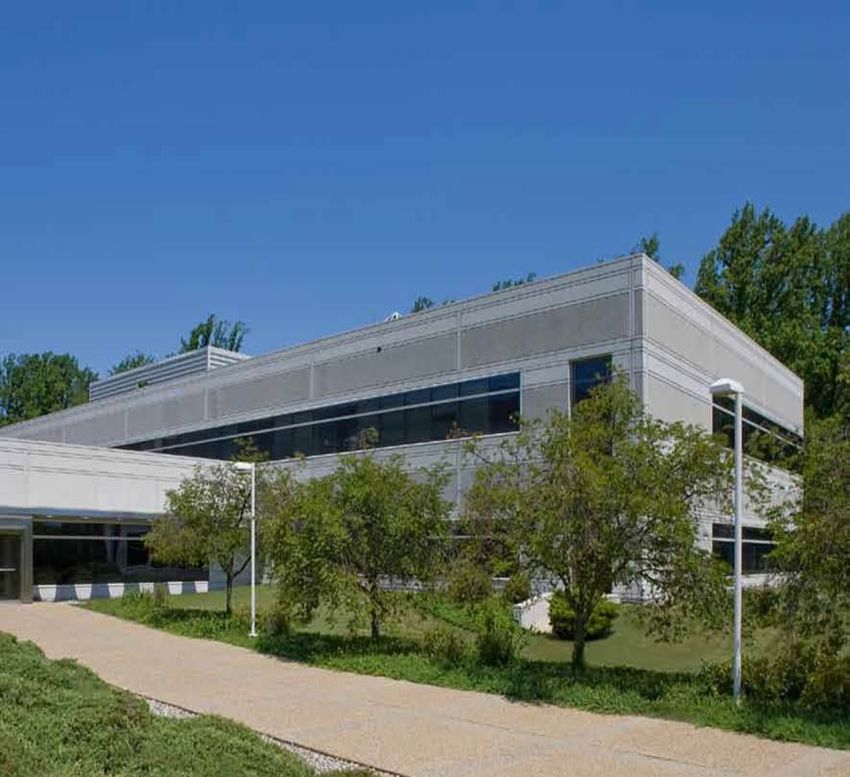
14 Data Centres Across 9 States in United States
Purchase Total WALE Weighted Average Unexpired Occupancy
Consideration NLA1 (By GRI)2 Lease Term of Underlying Land Rate4
US$750m 2.3m sq ft 6.7 years Freehold3 97.4%
Wisconsin
N15W24250 Riverwood Drive,
1 Pewaukee
Wisconsin Michigan
Michigan
1 2 19675 W Ten Mile Road , Southfield
2
New Jersey New Jersey
3
4 3 2 Christie Heights, Leonia
Pennsylvania
Pennsylvania
Tennessee 4 2000 Kubach Road, Philadelphia
California
7 5 6 North Carolina
9 North Carolina
14 11 5 1805 Center Park Drive, Charlotte
12 8 10
13 5150 McCrimmon Parkway,
Texas Georgia 6 Morrisville
Texas Tennessee
11 1221 Coit Road, Plano 7 402 Franklin Road, Brentwood
12 3300 Essex Drive, Richardson Georgia
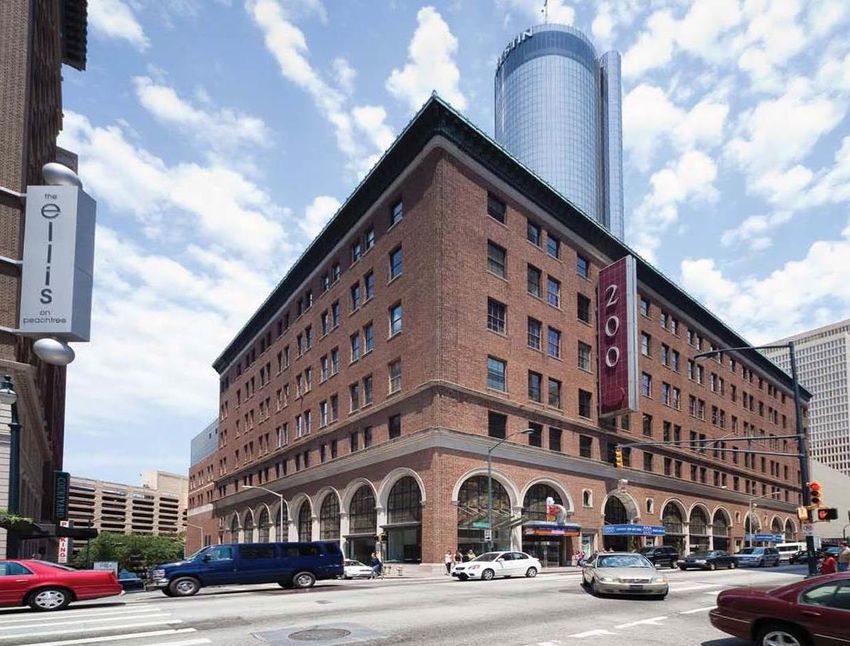
13 5000 Bowen, Arlington 8 180 Peachtree, Atlanta
California 1001 Windward Concourse,
9 Alpharetta
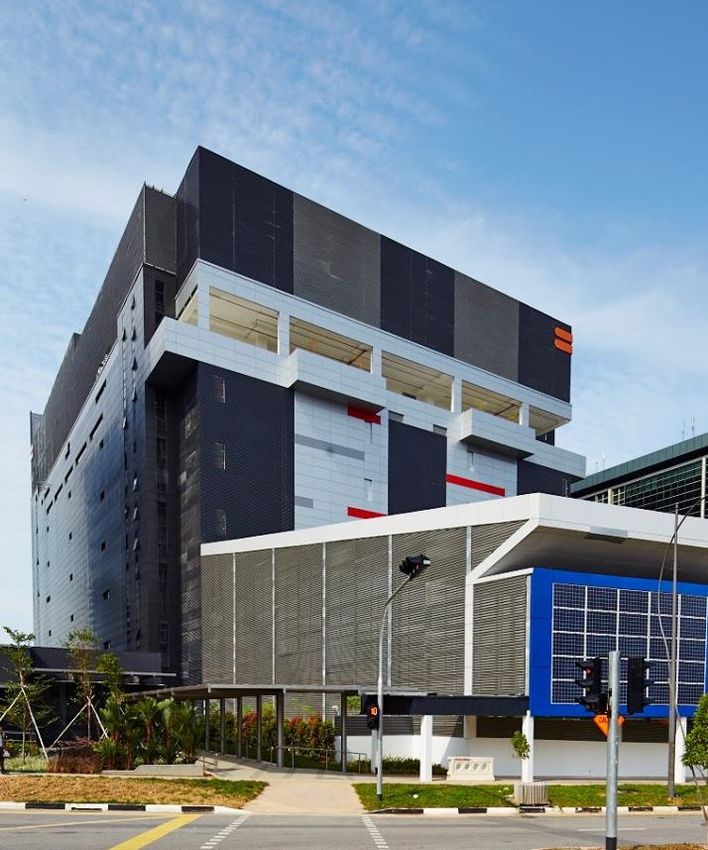
14 7337 Trade Street, San Diego
10 2775 Northwoods Parkway, Atlanta
1 Excluded the parking decks (150 Carnegie Way and 171 Carnegie Way) at 180 Peachtree.
2 Refer to the Target Portfolio’s WALE by gross rental income (“GRI”) as at 30 Sep 2017.
3 All properties are sited on freehold land, except for the parking deck (150 Carnegie Way) at 180 Peachtree. As at 30 Sep 2017, the parking deck has a remaining land lease
6 tenure of approximately 38.2 years, with an option to renew for an additional 40 years.
4 As at 30 Sep 2017.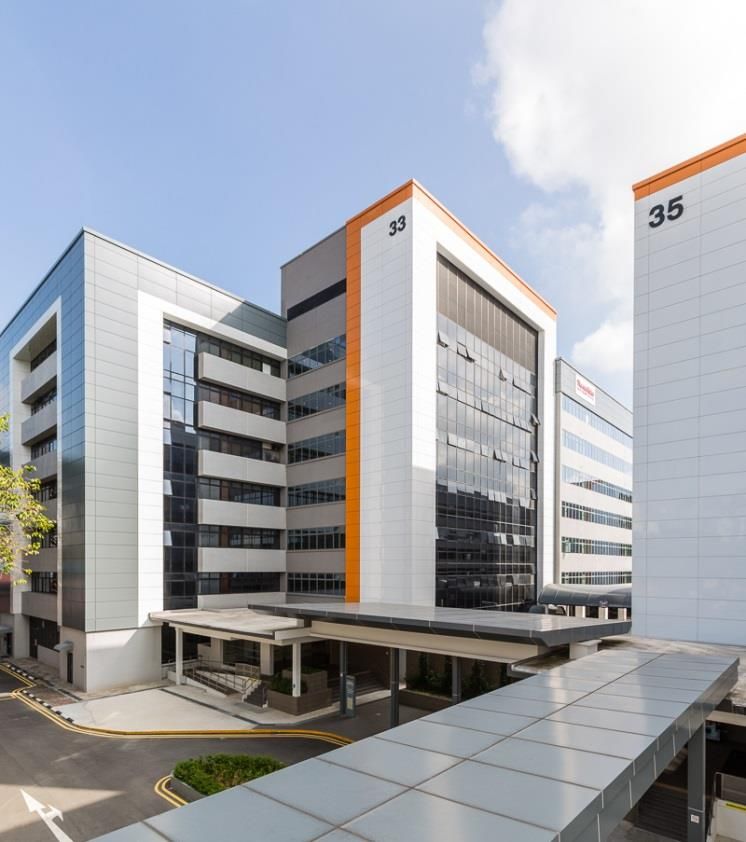
JOINT VENTURE WITH
                         MAPLETREE INVESTMENTS
180 Peachtree, Atlanta
Joint Venture Structure

                   40%                                                                    60%                                 Mapletree Trustee
                                                                                                                                  Pte. Ltd.
                                                                                        Trustee and Manager                 • Trustee-Manager to
                                                                                              Services                        manage portfolio1
                                         Mapletree Redwood                                                                  • Key operational and
                                          Data Centre Trust                                                                   management issues to
                                                                                          Asset Management
                                                                                                                              require unanimous
                                                                                                Fees                          approval of the
                                                                                                                              unitholders of MRDCT
                                       Singapore Holding
                                          Companies
Singapore

United States                                                                           Property Management
                                                                                              Services
                                                                                                                                Mapletree US
                                               US REITs                                                                       Management LLC2
                                                                                        Property Management
                                                                                                Fees

                                           Target Portfolio of
                                            14 Data Centres

    1   Asset management fees will be paid to Mapletree Trustee Pte. Ltd., who in turn shall pay the Manager and MIPL (and/or their respective nominee(s)) in
        accordance with the proportion of MIT and MIPL SPV’s respective interests in MRDCT.
    2   A wholly-owned US subsidiary of MIPL, which provides property management, lease management, project management and marketing services.
8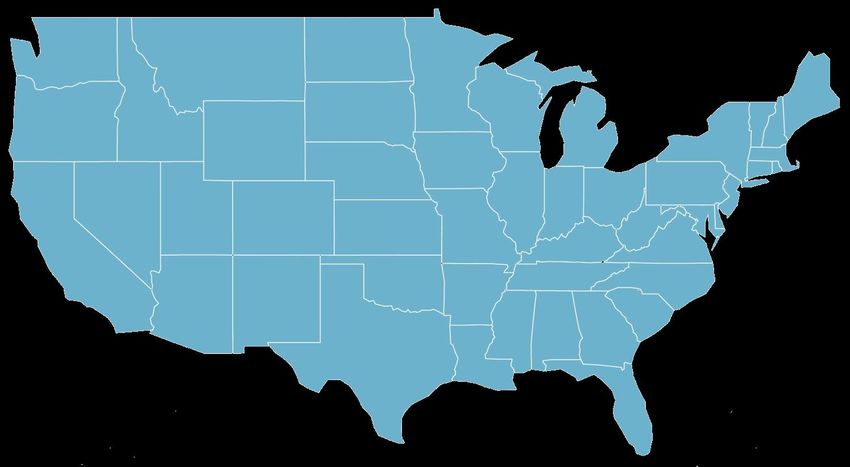
Joint Venture – Prudent and Measured Approach
Leverages on Sponsor’s local market experience and resources
Total Assets Under Management
(as at 31 Mar 2017) Sponsor granted MIT the right of first refusal to acquire
the remaining 60% interest in MRDCT
S$39.5b
United Kingdom Hong Kong SAR South Korea
S$2.5b S$7.5b S$0.4b
China Japan
Germany S$5.4b S$3.4b
S$0.2b
United States
S$1.7b1
India Vietnam
S$0.2b S$1.3b
Malaysia
S$0.6b
Singapore
S$15.2b Australia
1 As at 30 Sep 2017, the Sponsor’s investments
S$1.1b
in the United States has increased to S$3.0
billion
9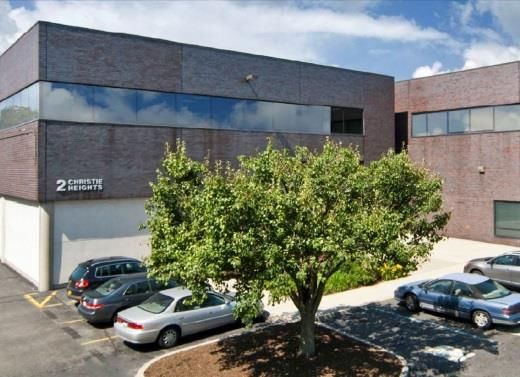
RATIONALE FOR
                               PROPOSED ACQUISITION
402 Franklin Road, Brentwood
Rationale for the Acquisition
1 Good Quality Portfolio of Data Centres
2 Strategic Entry into the World’s Largest Data Centre Market
3 Strengthens MIT Portfolio
4 Attractive Valuation
111 Good Quality Portfolio of Data Centres
Primarily leased on core-and-shell basis with triple net leases and minimal leasing risk
90.6% of the Target Portfolio1 (by Gross Rental Income) is leased on core-and-shell basis
All tenants are on triple net lease structures whereby all outgoings2 are borne by tenants
Well-staggered lease expiry profile with only 1.3% of leases expiring within next 3 years
Low leasing and operating risks with minimal capital expenditure commitments, easing entry into a new
geographical market
Breakdown of Lease Expiries3
Breakdown of Lease Types (By Gross Rental Income)3 By Gross Rental Income
Tenants are responsible for fit-out Up to 3 years
Fitted Out4
9.4%
replacements until the end of their More than 8 1.3%
respective lease terms years > 3 to 5 years
12.8% 23.8%
Non-fitted > 5 to 8 years
out 62.1%
90.6%
1 Refers to the proposed portfolio acquisition of 14 data centres in the United States.
2 Refers to maintenance, tax and insurance.
3 As at 30 Sep 2017.
4 Includes uninterruptible power supply, generator, computer room air conditioning system, chillers and raised floor.
122 Strategic Entry into the World’s Largest Data Centre Market
Drivers for Data Centre Growth in North America
Growing Data Adoption of Proliferation of Need for Geographical
Creation and Storage Cloud Services Internet of Things Diversity
Driven by increased take- Driven by need for cost Growth of connected Need for backup data
up of digital technologies effective, reliable and devices will generate centres for disaster
among businesses and secure data centre large quantities of data to recovery planning,
consumers as well as solutions be processed and creating demand for
enterprises’ requirement analysed in real time, multiples data centres
to backup data more which will increase the and across various
frequently workload of data centres locations
Source: 451 Research, LLC.
132 Strategic Entry into the World’s Largest Data Centre Market
United States is the largest data centre market in the world with continued growth
Worldwide insourced and outsourced data centre demand is expected to grow at a CAGR of 5.3% (by
net operational sq ft) between 2015 and 2020F
United States comprises 28% of the global insourced and outsourced data centre market with a CAGR
of 3.1% (by net operational sq ft)
Supported by its highly developed infrastructure and favourable business environment
Worldwide Insourced and Outsourced Data Centre Space in 2Q2017 Insourced and Outsourced Data Centres in 2Q2017
(By Net Operational Sq Ft in million) (By Net Operational Sq Ft)
United States is the world’s largest data centre market
Latin
America
Middle East 4.8%
and Africa
189 8.2% Asia Pacific
176 32.7%
147 162
119 132
920 Europe
794 831 873 22.7%
737 762
2015 2016 2017F 2018F 2019F 2020F Rest of
North United
Insourced Outsourced America States
3.6% 28.0%
14 Source: 451 Research, LLC.2 Strategic Entry into the World’s Largest Data Centre Market
Strong demand for data centre space in
established cities
Established Cities Secondary Cities
Driven by their strategic proximity to
large businesses, robust connectivity Northern Virginia Las Vegas
and strong government support
New York/New Jersey Denver
Dallas Miami
Interest in secondary cities
Silicon Valley Houston
Due to proliferation of Internet of Things
and growth of high-bandwidth content, Chicago Philadelphia
service providers are moving closer to
Atlanta Minneapolis
users to minimise latency
Tightening of supply in established cities Los Angeles Cincinnati
also create interest in secondary cities Phoenix Montreal
with lower cost of operations
The above table is sorted by market size (net operational sq ft).
Source: 451 Research, LLC.
153 Strengthens MIT Portfolio
Strong Tenant Base with Established Tenants
% of Gross
Top 5 Tenants Rental Income Leased to 15 high-quality
As at 30 Sep 2017 tenants, including Fortune
AT&T 43.5%
Global 500 corporations and
NYSE-listed/Nasdaq-listed
The Vanguard Group 10.0% companies
General Electric 8.3%
Extends across a diverse
Level 3 Communications 6.3% range of industries such as
Equinix 5.9% telecommunications, IT and
TOTAL 74.0% financial services
As at 30 Sep 2017, the Target
Portfolio had an occupancy of
97.4%
163 Strengthens MIT Portfolio
Reduces Maximum Risk Exposure to Any Single Tenant From 10.5% to 9.7%
TOP 10 TENANTS BY GROSS RENTAL INCOME1
As at 30 September 2017
10.5%
9.7%
Pre-Acquisition Post-Acquisition
3.3%
3.0% 2.8% 2.7%
2.5%
2.1% 1.9%
1.5% 1.4% 1.4%1.3% 1.4% 1.3%
1.2% 1.2% 1.2% 1.1%
AT&T
1 Based on MIT’s 40% interest in the joint venture.
173 Strengthens MIT Portfolio
Enhances Income Stability and Provides Organic Growth
Pre-Acquisition: Lease Expiry Profile1 Post-Acquisition: Lease Expiry Profile2
31.2%
26.7%
23.2%
20.4% 21.3%
21.3% 21.0%
18.8%
8.4% 7.7%
FY17/18 FY18/19 FY19/20 FY20/21 FY21/22 & FY17/18 FY18/19 FY19/20 FY20/21 FY21/22 &
Beyond Beyond
Portfolio WALE = 3.7 years Portfolio WALE = 3.9 years
Flatted Factories Hi-Tech Buildings Business Park Stack-up / Ramp-up Light Industrial Target Portfolio
Buildings Buildings Buildings
Income stability from the Target Portfolio WALE of 6.7 years2
97.6%2 of Target Portfolio have annual rental escalations of more than 2%
1 Expiring leases by gross rental income as at 30 Sep 2017.
2 Expiring leases by gross rental income as at 30 Sep 2017 and based on MIT’s 40% interest in the joint venture.
183 Strengthens MIT Portfolio
24.4% of Enlarged Portfolio (By Land Area) Will Be on Freehold Land
REMAINING YEARS TO EXPIRY ON UNDERLYING LAND LEASES1 (BY LAND AREA)
As at 30 September 2017
WALE of Underlying Leasehold Land = 38.8 years2
55.0%
41.5%
28.5%
24.4%
21.5%
9.6%
5.9% 4.5% 7.4%
1.0% 0.7%
0 to 20 years >20 to 30 years >30 to 40 years >40 to 50 years More than 50 Freehold
years
Pre-Acquisition Post-Acquisition
1 Excludes the options to renew and based on MIT’s 40% interest in the joint venture.
2 Excludes freehold land.
193 Strengthens MIT Portfolio
In Line with Expansion of Investment Strategy to Acquire Data Centres
Worldwide Beyond Singapore
Pre-Acquisition1 Post-Acquisition2
MIT has 4 data centres in Singapore, of which Hi-Tech Buildings segment expected to
one is under development, comprising 6.7% of increase to 36.6%2 of portfolio (from 29.6%)
MIT’s portfolio value1 Data centres expected to comprise 16.0%2
100.0% Singapore of enlarged portfolio (from 6.7%)
90.1% Singapore, 9.9% United States
Light Industrial Light Industrial
Buildings Buildings
2.1% Stack-up/Ramp- 1.9%
Stack-up/Ramp- Flatted up Buildings
up Buildings Factories 10.9%
12.0% 41.2% Flatted
Factories
Business Park 37.1%
Business Park Buildings
Buildings 13.5%
15.1% Portfolio Value Portfolio Value
S$3.78 billion1 S$4.19 billion2
6.7% 9.9%
Data Centres Target Portfolio (US)
6.1%
Hi-Tech Data Centres (SG)
Buildings Hi-Tech
29.6% Buildings
1 Based on MIT’s book value of investment properties and investment properties under development as at 30 Sep 2017. 36.6%
20 2 Based on MIT’s 40% interest in the joint venture.4 Attractive Valuation
Purchase Consideration Relative to Independent Valuation1
(US$ million)
776.4
750.0
3.4%
discount
Valuation Purchase
Consideration
21 1 Independent valuation by C&W conducted in Aug and Sep 2017, using the sales comparison and income capitalisation approach..FUNDING STRUCTURE
AND FINANCIAL IMPACT
2000 Kubach Road, PhiladelphiaPro Forma Financing1
Acquisition to be funded by a combination of debt and equity
Private placement of new units to institutional and other investors: ~US$90.1m1 (S$122.5m)
(~29.6% of MIT Total Acquisition Cost)
Bank borrowings: US$214.7m (S$292.0m)
(~70.4% of MIT Total Acquisition Cost)
Post-acquisition, MIT’s pro forma aggregate leverage is expected to increase to 34.0%2
from 30.0% as at 30 Sep 2017 For Illustrative Purposes
Total = US$304.8m
Funding Requirements
US$30.7m USD Debt at
MIT Net MIT’s Level
Purchase consideration3 US$300.0m (S$408.0m) Requirement ~US$90.1m
1
(S$122.5m) Equity
4
Transaction cost US$1.7m (S$2.3m)
Acquisition fee5 US$3.0m (S$4.1m)
MIT’s share of
Other expenses US$184.0m USD Onshore
US$0.1m (S$0.2m) Loans
in relation to joint venture6
MIT Total Acquisition Cost US$304.8m (S$414.6m)
MIT Total Acquisition Cost
1 Assumed the launch of private placement to raise gross proceeds of no less than approximately S$125.0 million, which is net of transaction cost. This
assumed the issue of approximately 67,600,000 New Units at an Illustrative Issue Price of S$1.85 per New Unit pursuant to the private placement.
2 Assumed proceeds from the private placement is used to partly fund the Proposed Acquisition. In accordance with Property Funds Guidelines; the
aggregate leverage ratio includes proportionate share of borrowings of the joint venture and deposited property values.
3 Based on MIT’s 40% interest in the joint venture.
4 Refers to cost incurred by the joint venture, which MIT will bear 40%.
5 1.0% of MIT’s proportionate share of the purchase consideration.
23 6 Refers to other expenses in connection with MIT’s investment in the joint venture.Pro Forma Financial Impact of Proposed Acquisition
Distribution Per Unit Net Asset Value per Unit
Singapore cents S$
11.65
11.39
1.42
1.41
FY16/17¹ Pro Forma FY16/17 DPU FY16/17¹ Pro Forma FY16/17 NAV
After Joint Venture and per Unit
Proposed Acquisition² After Joint Venture and
Proposed Acquisition²
1 For the financial year ended 31 Mar 2017.
2 For illustrative purposes only, the pro forma financial effects of the Joint Venture and Proposed Acquisition on MIT's DPU for
FY16/17, as if the Joint Venture, Proposed Acquisition and issue of New Units were completed on 1 April 2016, and as if the
Properties were held and operated through to 31 March 2017.
24CONCLUSION 1001 Windward Concourse, Alpharetta
Conclusion
Prudent and measured approach through 40:60 joint venture
Attractive with MIPL for MIT’s maiden overseas expansion
Investment Strong growth prospects in United States data centre market
Proposition Primarily leased out on core-and-shell basis on triple net lease
structures with minimal leasing risk
Enhances Large freehold portfolio offering scale and diversity
Long WALE with annual rental escalations
Quality of MIT Tenants with high capital expenditure invested in the assets
Portfolio DPU and NAV accretive to Unitholders
Strengthens
Portfolio for Continued focus on Hi-Tech Buildings segment
Long-term Broadens investment into sustainable growth segment
Growth
26APPENDIX
DETAILS OF TARGET PORTFOLIO
3300 Essex Drive, RichardsonDetails of Target Portfolio (1)
7337 Trade Street, 180 Peachtree, 402 Franklin Road,
San Diego Atlanta Brentwood
7337 Trade Street, 402 Franklin Road,
Location 180 Peachtree, Atlanta
San Diego Brentwood
Land area (sq ft) 734,522 135,106 1,888,833
NLA (sq ft) 499,402 357,4111 347,515
Occupancy 100.0% 93.1% 100.0%
Equinix
Level 3 Communications
Tenants AT&T AT&T
City of Atlanta
Verizon
1 Excluded parking decks at 150 Carnegie Way and 171 Carnegie Way.
28Details of Target Portfolio (2)
2000 Kubach Road, 1001 Windward N15W24250 Riverwood
Philadelphia Concourse, Alpharetta Drive, Pewaukee
2000 Kubach Road, 1001 Windward N15W24250 Riverwood
Location
Philadelphia Concourse, Alpharetta Drive, Pewaukee
Land area (sq ft) 1,115,187 892,446 598,799
NLA (sq ft) 124,190 184,553 142,952
Occupancy 100.0% 100.0% 100.0%
Tenants The Vanguard Group General Electric AT&T
29Details of Target Portfolio (3)
3300 Essex Drive, 5000 Bowen, 1805 Center Park
Richardson Arlington Drive, Charlotte
3300 Essex Drive, 5000 Bowen, 1805 Center Park Drive,
Location
Richardson Arlington Charlotte
Land area (sq ft) 66,265 1,221,132 295,772
NLA (sq ft) 20,000 90,689 60,850
Occupancy 100.0% 100.0% 66.7%
Tenants Catholic Health Initiatives Atos TierPoint
30Details of Target Portfolio (4)
1221 Coit Road, 5150 McCrimmon 2 Christie Heights,
Plano Parkway, Morrisville Leonia
1221 Coit Road, 5150 McCrimmon 2 Christie Heights,
Location
Plano Parkway, Morrisville Leonia
Land area (sq ft) 316,061 533,174 146,317
NLA (sq ft) 128,753 143,770 67,000
Occupancy 100.0% 100.0% 100.0%
Peak 10
PPD Development
Tenants Internap Corporation Wipro
CPI Security
Systems
31Details of Target Portfolio (5)
2775 Northwoods 19675 W Ten Mile
Parkway, Atlanta Road, Southfield
2775 Northwoods 19675 W Ten Mile Road,
Location
Parkway, Atlanta Southfield
Land area (sq ft) 140,341 121,122
NLA (sq ft) 32,740 52,940
Occupancy 100.0% 74.3%
Tenants Peak 10 Level 3 Communications
32End of Presentation
For enquiries, please contact Ms Melissa Tan, Vice President, Investor Relations,
DID: (65) 6377 6113, Email: melissa.tanhl@mapletree.com.sgYou can also read


