Income Dynamics & Mobility in Ireland: Evidence from Tax Records Microdata - April 2018 Statistics & Economic Research Branch - Irish Government ...
←
→
Page content transcription
If your browser does not render page correctly, please read the page content below
Income Dynamics & Mobility in
Ireland: Evidence from Tax
Records Microdata

April 2018
Statistics & Economic Research Branch
Income Dynamics & Mobility in
Ireland: Evidence from Tax
Records Microdata

The authors are Seán Kennedy(Sean.Kennedy@oecd.org), OECD and formerly Office of the
Revenue Commissioners, David Haugh (David.Haugh@oecd.org), OECD and Brian Stanley
(bstanley@revenue.ie), Statistics & Economic Research Branch of the Office of the
Revenue Commissioners. Seán Kennedy and Brian Stanley were and are respectively also
members of the Irish Government Economic & Evaluation Service (“IGEES”). Any opinions
expressed in this paper are the views of the authors and do not necessarily reflect the
views of the Office of the Revenue Commissioners, the OECD or IGEES. The authors alone
are responsible for the conclusions.
April 2018

1   Statistics & Economic Research Branch
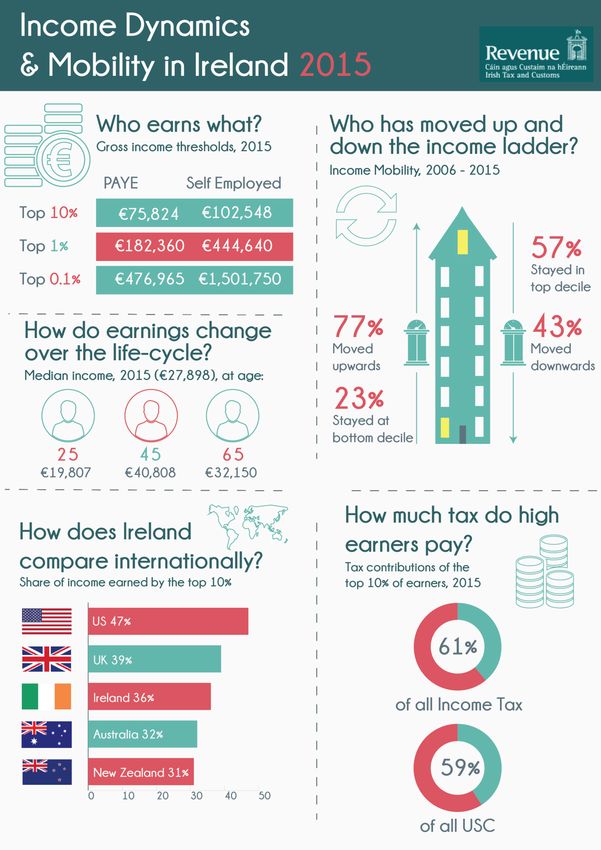
April 2018

Executive Summary

Global income shares have risen among the top 1% (Alvaredo et al., 2013) in recent
decades. In most countries, income inequality is measured at a moment in time using
survey data due to its availability (Jäntti and Jenkins, 2014). By contrast, the current
paper examines distributional and income mobility dynamics using the full population of
2.2 million tax units in Ireland from 2006 to 2015. The purpose of the paper is to make
the best use of the tax record data and to improve the evidence base for policy making.

According to the analysis, in 2015 the top 10% earn one-third of all income (36 per cent).
Internationally this is below the UK (39 per cent) and the US (47 per cent) but above
Australia (32 per cent) and New Zealand (31 per cent) in 2013. In Ireland, this top 10%
group paid two-thirds of all Income Tax (61 per cent) and half of the Universal Social
Charge (51 per cent). By comparison, all other deciles 1 through 9 produce two-thirds (64
per cent) of all income and paid 39 and 49 per cent of Income Tax and USC respectively.

Real income thresholds in 2015 for the top 10%, 1% and 0.1% are €77,530, €203,389
and €618,296 respectively (Figure 1). The thresholds differ greatly by sector. For
example, the threshold for the top 10% in the professional sector (€110,320) is more than
double that of administrative and support services (€52,390). Similarly, the same
threshold is a third higher for self-assessed (~€100,000) compared to PAYE (€75,000).

According to an analysis of Income Tax stability, of those in the top 10% of contributors in
2006, under half (43 per cent) remained in the top 10% of contributors 10 years later. Of
those in the top 0.1% of contributors in 2006, one-quarter (22 per cent) remained in the
top 0.1% by 2015. This group of just fewer than 1,500 taxpayers have consistently paid 3
to 6 per cent of all Income Tax in the State.

A further analysis of income mobility shows that of those in the top decile in 2006, over
half (57 per cent) had remained by 2015. Between 2006 and 2009, a period of high
incomes growth, incomes grew much faster among lower percentiles compared to higher
percentiles. Between 2012 and 2015, the trend reversed, with increases largest at the top
of the distribution.

An analysis of incomes by age shows that incomes typically peak between 40 and 55
years, similar to trends in the US. Further, only 18 per cent of 25 year old new entrants
pay Income Tax compared to 60 per cent of all 25 year olds.

2                                                             Statistics & Economic Research Branch
April 2018

Key Findings

               Figure 1: Selected Graphical Findings

                Distribution of Gross Income 2015

               Three Year Growth in Gross Income

3                                             Statistics & Economic Research Branch
April 2018
Table of Contents
Executive Summary .............................................................................................. 2
Key Findings ........................................................................................................ 3
Table of Contents ................................................................................................. 4
List of Tables ....................................................................................................... 4
List of Figures ...................................................................................................... 4
1 Introduction ................................................................................................... 5
1.1 Data ........................................................................................................ 5
1.2 Estimation Sample .................................................................................... 6
1.3 Tax Record and Survey Data....................................................................... 6
2 Developments in Income Distributions ............................................................... 7
2.1 Income Distribution in Ireland ..................................................................... 7
2.2 Income Thresholds by Decile ...................................................................... 7
2.3 Income Growth ......................................................................................... 8
2.4 Income Distribution by Taxpayer Type ......................................................... 9
2.5 Income Distribution by Age and New Entrants ..............................................11
2.6 Taxpayers Changing Employment ...............................................................13
2.7 Income by Sector .....................................................................................14
2.8 Income and Tax Shares by Decile ...............................................................15
2.9 Survival Analysis ......................................................................................18
3 Income Mobility .............................................................................................20
3.1 Introduction ............................................................................................20
3.2 Mobility of Taxpayer Population ..................................................................20
3.3 Mobility in the Recession, Stabilisation and Early Recovery Periods .................21
4 Conclusion ....................................................................................................23
References .........................................................................................................24
List of Tables
Table 1: Income Thresholds ..................................................................................... 7
Table 2: Income Thresholds by Decile 2015 ................................................................ 8
Table 3: Income by Age for New Entrants 2015 .........................................................12
Table 4: Median Income for Taxpayers Changing Employment 2015 .............................14
Table 5: Sectoral Proportions and Gross Income ........................................................15
Table 6: Shares of Gross Income and Income Tax 2015 ..............................................16
Table 7: Share of Income ........................................................................................17
Table 8: Share of Income Tax and USC Contributions .................................................18
List of Figures
Figure 1: Selected Graphical Findings ........................................................................ 3
Figure 2: Three Year Growth in Gross Income ............................................................. 9
Figure 3: Income Thresholds 2015 ...........................................................................10
Figure 4: Income Distribution by Age 2015 ................................................................11
Figure 5: Percent of Taxpayers in the Tax Net by Age 2015 .........................................13
Figure 6: Survival of Top Taxpayers over Time ..........................................................19
Figure 7: Survival of Top Income Tax Contributors over Time ......................................19
Figure 8: Income Mobility for Selected Deciles 2006 – 2015 ........................................21
Figure 9: Income Mobility for Recession, Stabilisation and Early Recovery Periods ..........22
4 Statistics & Economic Research BranchApril 2018 1 Introduction In recent decades, global income shares have risen among the top 1% (Alvaredo et al., 2013). The trend has generated policy discussion on the extent to which citizens participate in national prosperity. The analysis in this paper is based on Revenue’s administrative Income Tax records, which follow the entire population of approximately 2.2 million tax units over the 10 year period from 2006 to 2015.1 The data are compiled using Income Tax returns filed by self-assessed taxpayers (Form 11) and employers on behalf of PAYE employees (Form P35). 1.1 Data The unit of analysis in the data are tax units and not individual taxpayers. The difference arises in the case of married couples or civil partners who elect for joint assessment. These cases represent two taxpayers and either one or two incomes but only count as one tax unit.2 Tax units are categorised under six personal statuses by law: single males, single females, married two-earners, married one-earners, widowers and widows. For simplicity, the word taxpayer is used to refer to tax unit hereafter. An important distinction is whether taxpayers are predominantly PAYE employees or self- assessed individuals. In this dataset taxpayers are assigned to one of the two categories conditional on which category comprises a greater proportion of overall income. It is important to note that PAYE employees in a Revenue context includes individuals in receipt of occupational pensions. In addition, in the self-assessed taxpayer population, there is a wide diversity of taxpayers ranging from local part-time businesses with small incomes to high net worth individuals employing many employees. On sector of employment, this relates to the sector of the employer (not the employee).3 Each taxpayer is associated with one sector in each year. Taxpayers may have multiple trades or businesses, the data here are based on the primary trade identified by the taxpayer. In an attempt to broadly examine the impact of the recession on incomes and mobility in Ireland, three equal length overlapping periods are chosen: 2006 to 2009, 2009 to 2012 and 2012 to 2015. The period from 2006 to 2009 captures the initial impact of the recession from close to peak economic activity to the bottom. While the economy began to 1 The same population data are also used to produce Revenue’s income distributions statistics, available at: http://www.cso.ie/px/pxeirestat/Database/eirestat/Income%20Tax%20and%20Corporation%20Tax%20Distribut ion%20Statistics/Income%20Tax%20and%20Corporation%20Tax%20Distribution%20Statistics_statbank.asp?SP =Income Tax and Corporation Tax Distribution Statistics&Planguage=0&ProductID=DB_RV01 2 Married one-earning and married two-earning couples represent approximately 17 per cent and 21 per cent of taxpayers in 2015. 3 For self-assessed taxpayers, sector relates to the sector of the business taxpayer. 5 Statistics & Economic Research Branch
April 2018

expand after 2009, household income and employment continued to fall until 2012.4
Between 2012 and 2015 employment and household income increased and the rate of
output growth accelerated. For simplicity, these three periods are loosely referred to
hereafter as the recession, stabilisation and early recovery periods.5

1.2     Estimation Sample
The mobility analysis in Section 3 restricts the sample to taxpayers aged 25 to 100 leaving
approximately 1.5 million observations in each year. This follows common practice in the
mobility literature which attempts to remove from the analysis changes in income that are
attributable to the transition from school to work. The distributional analysis in Section 2
makes no such restrictions to a taxpayer’s age and contains approximately 2.2 million tax
cases in each year.

1.3     Tax Record and Survey Data
Compared with survey data, tax record data has several advantages (Jenkins, 2001).
First, coverage of the full taxpayer population allows for specific sub-group analysis while
retaining adequate sample size. Second, it is an offence to submit a false tax return so
incomes are mostly free from measurement error such as misreported incomes or
response bias. Third, as noted by Jenkins, tax records are often ‘used as a validation gold
standard against which to assess measurement error in survey-based income data’.

There are also limitations. First, the data is confined to those who complete tax returns
and does not cover those entirely reliant on untaxed benefits or undeclared income.
Therefore it can be seen as under-representing lower-income groups. Second, tax data are
collected for the purposes of calculating tax liabilities. Unlike most survey data, tax record
data have limited demographic data, such as educational attainment. Third, while the tax
records are based on the gross incomes of tax units, survey data are typically based on an
equivalisation of the disposable incomes of households.6

4
  Median equivalised real disposable income reached the bottom in 2013. Household income refers to the median
real household disposable income according to SILC 2015, available at (Table SIA12):
http://www.cso.ie/px/pxeirestat/Statire/SelectVarVal/Define.asp?maintable=SIA12&PLanguage=0.
5
  While economic output hit the bottom in 2009, earnings and employment lagged output and reached the
bottom in 2012. As this paper is concerned with income distributions and mobility, the year 2012 is chosen as
the cut-off between the recession and recovery period.
6
  Equivalisation usually involves summing up all income in a tax-unit/household, and dividing it by an
equivalence scale to take account of the total needs of the members of the unit, so for example a family of 2
adults with 1 child with the same total income as a childless couple would have a lower equivalised income than
the childless couple.

6                                                                        Statistics & Economic Research Branch
April 2018

2 Developments in Income Distributions

2.1         Income Distribution in Ireland

Table 1 shows real gross income thresholds between 2006 and 2015. The median gross
income is €27,898 in 2015. The income threshold for the top 0.1% is €618,296 in the
same year. Median gross income peaked in 2009 and reached the bottom in 2014, which
is a year later than household survey data.7 Also, incomes measured using surveys
declined by more compared to incomes on the tax records. This may be because the tax
records do not fully capture the fall in income when moving from employment to
unemployment as the data does not include those entirely reliant on untaxed benefits.

                                        Table 1: Income Thresholds
                                              Real Gross Income
               Bottom          Bottom        Median        Top 75%       Top Decile      Top 1%        Top 0.1%
    Year
               Decile €        25% €           €              €              €              €              €
    2006         4,951         13,614         27,281         47,025        76,296        209,727        745,580

    2007         5,056         13,906         27,320         46,965        76,537        209,355        727,120

    2008         5,154         14,198         27,491         47,275        76,641        205,148        666,102

    2009         5,186         14,733         28,696         49,091        78,730        203,963        617,971

    2010         5,134         14,684         28,597         48,582        77,542        201,722        614,329

    2011         5,306         14,847         28,171         47,703        75,921        196,417        578,927

    2012         5,306         14,572         27,720         47,155        75,025        193,998        562,067

    2013         4,721         13,901         27,347         47,098        75,130        193,569        564,260

    2014         4,672         13,724         27,332         47,249        75,611        195,331        573,449

    2015         5,200         14,080         27,898         48,228        77,530        203,389        618,296

                                            Nominal Gross Income
                    Bottom         Bottom        Median       Top 75%      Top Decile     Top 1%       Top 0.1%
      Year
                    Decile €       25% €           €             €             €             €             €
      2006            4,576        12,582        25,214        43,462        70,515        193,835       689,085

      2009            5,000        14,204        27,666        47,329        75,904        196,642       595,791

      2012            5,284        14,514        27,609        46,967        74,726        193,224       559,825

      2015            5,200        14,080        27,898        48,228        77,530        203,389       618,296
           Source: Revenue analysis. Note: 2015 prices; previous years deflated by the consumer price index.

2.2         Income Thresholds by Decile
Table 2 shows income thresholds by decile for gross income, PAYE income and self-
assessed income in 2015. PAYE taxpayers generally earn more at the bottom half of the

7
 Median equivalised real disposable income reached the peak in 2008 according to SILC 2015, available at:
http://www.cso.ie/px/pxeirestat/Statire/SelectVarVal/Define.asp?maintable=SIA12&PLanguage=0.

7                                                                            Statistics & Economic Research Branch
April 2018
income distribution while self-assessed taxpayers earn increasingly more further up the
distribution. For instance, the top 10% of self-assessed taxpayers earn over €100,000
while the top decile of PAYE taxpayers earns over €75,000.
Table 2: Income Thresholds by Decile 2015
Gross Income PAYE Income Self-Assessed
€ € Income €
Bottom Decile 5,200 5,200 5,052
Decile 2 11,224 11,445 9,613
Decile 3 16,777 16,992 14,344
Decile 4 22,147 22,297 20,288
Decile 5 27,898 27,969 27,022
Decile 6 34,334 34,282 35,212
Decile 7 42,702 42,428 46,747
Decile 8 54,989 54,304 64,860
Top Decile 77,530 75,824 102,548
Top 1% 203,389 182,360 444,640
Top 0.1% 618,296 476,965 1,501,750
Source: Revenue analysis.
2.3 Income Growth
Three year income growth rates are shown by percentile in Figure 2 for incomes greater
than the 10th percentile. A downward sloping curve, from left to right, indicates that
income growth is larger for lower earning taxpayers while an upward sloping curve
indicates that those at the top experience higher income growth.
There is significant real income growth between the years 2006 and 2009. Income growth
at the median is 5 per cent over the period and is greater at lower percentiles and smaller
at higher percentiles, perhaps in part due to a shift towards part-time employment during
the recession. Incomes for the top 1% and top 0.1% decline over the period (the latter is
not presented).
Real incomes generally decline from 2009 to 2012 (the stabilisation period) as median.
Median income fell by 3 per cent over the period and the decline in incomes are larger for
higher earning taxpayers. However, incomes below the 15th percentile increased.
This situation reverses during the recovery period from 2012 to 2015. Median incomes
have increased by 1 per cent and the increases are largest at the top of the distribution.
Those below the 40th percentile experience a decline in income over the period.
8 Statistics & Economic Research BranchApril 2018
Figure 2: Three Year Growth in Gross Income
Source: Revenue analysis. Note: 2015 prices; previous years deflated by the consumer price index.
2.4 Income Distribution by Taxpayer Type
This section examines the distribution of gross income in 2015 for selected taxpayer
cohorts. Figure 3 plots the income threshold for each decile for various taxpayer types.
Overall, the analysis shows that the highest earning tax units (top 0.1%) in Ireland are
self-assessed, married one-earning couples.
The top panel of Figure 3 shows that single females earn slightly more than males up to
the median.8 At the top of the income distribution single males earn more than their
female counterparts. The difference is most pronounced for the top 1% and top 0.1%
thresholds where males respectively earn 18 per cent and 44 per cent more.
The second panel of Figure 3 plots the income threshold for each decile for self-assessed
and PAYE taxpayers in 2015. While PAYE taxpayers generally earn more at the bottom half
of the income distribution, self-assessed taxpayers earn increasingly more further up the
distribution.9 The top 1% of self-assessed taxpayers earns over twice that of PAYE
taxpayers, while the top 0.1% earn over three times.
The final panel of Figure 3 shows the distribution of single and joint-assessed taxpayers.
Married taxpayers with one income earn more than those unmarried. In turn, married
taxpayers with two earners earn more than their single earning counterparts, reflecting
dual incomes. However the gap between one and two income couples narrows for the top
1% and reverses for the top 0.1%.
8
The difference in means within each joint decile is significant at the 1% level for deciles 4, 6, 8 and 9.
9
The difference in means within each joint decile is significant at the 1% level for deciles 2, 3, 9 and 10.
9 Statistics & Economic Research BranchApril 2018
Figure 3: Income Thresholds 2015
Males and Females
PAYE and Self-Assessed
Single and Joint-Assessed
Source: Revenue analysis.
10 Statistics & Economic Research BranchApril 2018
2.5 Income Distribution by Age and New Entrants
Figure 4 shows the income distribution of taxpayers aged 15 to 90 in 2015 using the 10th,
25th, 50th, 75th and 90th percentiles. The effect of the life-cycle is apparent, in that,
incomes (above the 25th percentile) typically peak between 40 to 55 years of age.
Two general life-cycle trends appear broadly similar to earlier research from the US, albeit
this is based on 2007 data (Auten et al., 2013). First, income growth is strong among
young taxpayers. Second, the rate of growth is larger for the higher percentiles. However,
the income by age profile below differs to the US with respect of older taxpayers.
At each percentile in Figure 4, taxpayers’ gross incomes increase at 66 years, coinciding
with eligibility of the state pension and many private pensions. This increase in income at
66 is sustained for a number of years for incomes below the 25th percentile which may
indicate that some taxpayers continue working for a number of years while in receipt of a
pension. It is worth reiterating that the data cannot distinguish between part-time and
full-time employment and does not extend to those entirely reliant on untaxed benefits.
Figure 4: Income Distribution by Age 2015
Source: Revenue analysis. Note: The number of observations for taxpayers over the age of 90 falls below 2,000
and are not presented.
New entrants to the tax records are examined by age cohort in Table 3 in terms of the
proportion and median income for each age group. For reference, the proportion and
median incomes are shown in each of the first columns for all taxpayers while the second
column shows the proportion and median incomes of new entrants in 2015. To account for
the possibility that taxpayers may only be employed during part of their first year, the
third column presents the income for those who are recorded on the tax records for their
second year in 2015.
11 Statistics & Economic Research BranchApril 2018
New entrants are more likely to be the youngest taxpayers. 60 per cent of new entrants
are aged 15 to 24 compared to 17 per cent for all taxpayers. New entrants also earn
significantly less than other taxpayers across all age categories. For instance, a new
entrant aged 15 to 24 typically earns €3,424 compared to €9,022 for all taxpayers that
age. However, the gap narrows for taxpayers on the tax records for a second year in 2015
perhaps reflecting that new entrants (in their first year) commence employment during
the tax year.
Table 3: Income by Age for New Entrants 2015
Proportion Median Gross Income €
All New Entrant New Entrant All New Entrant New Entrant
Taxpayers (1st Year) (2nd Year) Taxpayers (1st Year) (2nd Year)
Age 15 – 24 17.2% 59.9% 57.9% 9,022 3,424 7,064
Age 25 – 34 25.5% 21.0% 21.5% 26,152 8,486 17,597
Age 35 – 44 20.4% 8.5% 8.8% 37,304 9,681 17,794
Age 45 – 54 13.8% 4.9% 5.2% 40,297 9,963 16,145
Age 55 – 64 10.4% 2.5% 2.8% 36,883 11,241 15,663
Age 65 + 12.8% 3.1% 3.8% 31,047 19,948 23,472
Source: Revenue analysis. Note: New entrants are recorded as the year in which they first appear on the tax
records. The analysis only considers those taxpayers’ whose first registration with Revenue is in 2015 (1st year
new entrant in 2015) and in 2014 (2nd year new entrant in 2015).
New entrants to the tax records are examined further by age with respect to their entry
into the tax net in Figure 5. For instance, only 18 per cent of new entrants aged 25 pay
Income Tax compared to 60 per cent of all 25 year olds. For 25 year olds on the tax
records for two years in 2015, 48 per cent pay Income Tax.
A higher proportion of young new entrants pay Universal Social Charge (USC). 30 per cent
of 25 year old new entrants pay USC in their first year and 60 per cent pay USC in their
second year. For comparison, 69 per cent of all 25 year olds paid USC in 2015.
12 Statistics & Economic Research BranchApril 2018
Figure 5: Percent of Taxpayers in the Tax Net by Age 2015
Income Tax USC
Source: Revenue analysis. Note: The number of observations for new entrants generally falls below 100 for
taxpayers over 65 and are not presented. Income Tax does not include PRSI. Note: New entrants are recorded as
the year in which they first appear on the tax records. The analysis only considers those taxpayers’ whose first
registration with Revenue is in 2015 (1st year new entrant in 2015) and in 2014 (2nd year new entrant in 2015).
2.6 Taxpayers Changing Employment
Taxpayers who change employment in 2015 are examined in Table 4 in terms of the
proportion and median income for each quintile.10 Nearly 20 per cent of taxpayers between
the age of 25 and 65 have multiple employments in 2015, of which, 4 per cent have three
or more employments. To simplify the analysis, consideration is only given to taxpayers
who have one employment before and after changing employers in 2015.11
Overall, taxpayers who change employers earn more than those who remain with the
same employer. Taxpayers changing employers earn more before changing and
subsequently experience higher income growth than those remaining with the same
employer. Across quintiles, the extent of earnings growth diminishes for those on higher
incomes whether they change employer or not.
Taxpayers in the bottom quintile are least likely to change employers. These taxpayers in
2014 experience the strongest earnings growth irrespective of whether they change
employer or not. This may reflect the effect of transitory income insofar as their position in
the bottom quintile was the result of a temporary income shock.
10
The income quintile is calculated in 2014, before the taxpayer changes employment (in 2015) and the same
taxpayers’ incomes are reported for 2015 and 2016.
11
Thus consideration is only given to taxpayers who only have one employment in 2014, two employments in
2015 and one employment in 2016. Taxpayers who change employment in 2015 will have two records of
employment for that year. These restrictions account for 3 per cent of all taxpayers.
13 Statistics & Economic Research BranchApril 2018
Table 4: Median Income for Taxpayers Changing Employment 2015
Proportion Median Taxable Income €
Changing Not Changing Employer Changing Employer
Employer
2015 2014 2015 2016 Change 2014 2015 2016 Change
Total 100% 25,853 26,727 27,879 7.8% 26,115 27,650 29,785 14.1%
Bottom Quintile 15% 4,872 8,331 10,273 110.8% 5,619 10,423 13,808 145.7%
Quintile 2 23% 15,836 17,299 18,498 16.8% 16,039 17,758 19,524 21.7%
Quintile 3 22% 25,871 26,796 27,862 7.7% 25,738 26,776 28,235 9.7%
Quintile 4 19% 37,216 37,964 38,909 4.5% 37,137 38,872 39,803 7.2%
Top Quintile 22% 59,684 60,633 61,802 3.5% 61,375 64,284 64,143 4.5%
Source: Revenue analysis. Note: Proportion changing employer in 2015; 2016 prices; previous years deflated by
the consumer price index. Taxpayers here refer to individual taxpayers according to the P35 records.
2.7 Income by Sector
The income thresholds in Table 1 mask heterogeneity across sectors in the economy.
Table 5 shows the proportions of taxpayers working in each sector for 2006 and 2015
together with the income thresholds for the median and the top 10% of taxpayers. The
wholesale & retail trade sector accounts for the greatest proportion of employment in
2015 (14 per cent) which has been stable since 2006. The construction sector observed
the greatest relative contraction during this period, accounting for 11 per cent of
employees in 2006 and 5 per cent in 2015.
The income thresholds for the top 10% are largest for the finance, insurance & real estate
and the professional, scientific & technical sectors. The lowest incomes are observed in the
accommodation & food services sector.
14 Statistics & Economic Research BranchApril 2018
Table 5: Sectoral Proportions and Gross Income
Median Top 10%
Sector (NACE code) Proportion Gross Income (€) Gross Income (€)
2006 2015 2006 2015 2006 2015
Agriculture, Forestry & Fishing (A) 6% 5% 27,041 32,767 73,386 83,705
Industry (B-E) 11% 8% 26,804 33,605 63,594 81,199
Construction (F) 11% 5% 23,454 27,272 58,047 66,112
Wholesale and retail trade (G) 15% 14% 16,362 20,603 48,226 59,866
Transportation & storage (H) 4% 4% 27,405 30,502 61,685 68,682
Accommodation & food services (I) 7% 8% 11,129 12,531 32,195 34,992
Information & communication (J) 4% 3% 28,966 36,492 73,285 96,408
Financial, insurance & real estate (K-L) 8% 13% 26,206 35,347 85,307 109,868
Professional, scientific & technical (M) 4% 5% 26,550 34,506 92,304 110,320
Administrative & support services (N) 5% 5% 16,890 19,814 47,435 52,390
Public administration & defence (O) 8% 7% 32,878 35,870 68,472 72,250
Education (P) 2% 5% 23,477 35,094 69,473 70,417
Human health & social work (Q) 7% 8% 27,516 29,664 67,823 73,065
Arts, Entertainment & Recreation (R) 1% 2% 17,072 18,560 48,522 60,473
Other Service Activities (S) 2% 3% 16,571 17,650 45,819 52,648
Source: Revenue analysis. Note: 2015 prices; gross income in 2006 deflated by the consumer price index.
Columns may not sum to 100% due to rounding. NACE sectors T (Activities of households as employers) and U
(activities of extraterritorial organisations) account for 4% of the proportion in 2006 and 2015 but not shown.
2.8 Income and Tax Shares by Decile
This section examines disposable income, gross income and Income Tax shares by decile.
According to the analysis, the top decile holds over one-quarter (26 per cent) of
disposable income in 2015.12 The top 1% and 0.1% hold around 7.5 per cent and 2.8 per
cent of disposable income.
The top decile earns over one-third (36 per cent) of gross income in 2015 and contributes
61 per cent of all Income Tax and 51 per cent of USC. The top 1% contributes a similar
amount of Income Tax compared to their share of gross income (approximately 11 per
cent) but the top 0.1% pay a larger share of Income Tax and a lower share of USC
compared to their share of gross income.
12
Disposable income is calculated as gross income less Income Tax, USC and PRSI (PRSI is calculated as gross
income times the appropriate rate based on the PRSI class of the tax unit).
15 Statistics & Economic Research BranchApril 2018
Table 6: Shares of Gross Income and Income Tax 2015
Disposable
Gross Income Income Tax USC
Income
Deciles 1 - 9 73.8% 63.9% 39.3% 48.7%
Top Decile 26.2% 36.1% 60.7% 51.3%
Top 1% 7.4% 11.3% 10.6% 4.1%
Top 0.1% 2.8% 4.4% 5.7% 3.3%
Source: Revenue analysis. Note: The full shares for deciles 1 – 9 are shown in Table 7 and Table 8.
Income Shares
Table 7 reports the shares of gross income owing to each decile.13 In 2015, the top decile
held 36 per cent of all income. The share of the top 10% is similar to the share in the
World Wealth and Incomes Database (WID) for Ireland and around the median for the 20
countries with available data.14 It is below the United Kingdom (39 per cent) and the
United States (47 per cent) but above Australia (32 per cent) and New Zealand (31 per
cent) in 2013.15 Compared to 2006 levels, income concentration at the top 10% of the
distribution falls during the recession in 2009 and again in 2011. Data from the WID
database shows a similar pattern of a falling share of the top 10% in other countries in the
financial crisis period including Canada, Spain, the United Kingdom, and the United States.
During Ireland’s boom period in 2006 the very top incomes shares, the top 0.1% of
taxpayers earned 4.7 per cent of all income. By 2015, that share falls slightly to 4.4 per
cent. Comparing internationally, this means that in 2006 the very top incomes share in
Ireland was similar to that in the United States but has since fallen to levels more similar
to the UK and slightly higher than France and Spain (Landais, 2008). The share earned by
the top 1% also fell slightly over the period, from 12 per cent to 11 per cent. The 2015
result is similar to those in Germany (Jenderny, 2016).
Looking across all deciles over the recession and stabilisation periods, income
concentration fell in the top decile and increased in all other deciles (with the exception of
the bottom). However, the incomes accrued mostly to the deciles just below the top
decile. The top cohorts experienced an increase in their share once the economy began to
recover post-crisis, which is similar to other countries. Table 7 also reports a common
measure of inequality that expresses the concentration of the income shares above the
13
Income shares are published on the Revenue website. Available at:
http://www.cso.ie/px/pxeirestat/Statire/SelectVarVal/Define.asp?maintable=rva01&ProductID=DB_rv01&PLangu
age=0
14
Data available at http://wid.world/.
15
2012 for the United Kingdom.
16 Statistics & Economic Research BranchApril 2018
80th percentiles as a ratio of those below the 20th percentile (S80/20). By this measure,
changes in inequality reflect changes at the top of the income distribution.
Table 7: Share of Income
Gross Income Disposable Income
2006 2009 2012 2015 2006 2009 2012 2015
Bottom Decile 0.6% 0.6% 0.6% 0.6% 3.9% 4.0% 4.1% 4.1%
Decile 2 2.0% 2.1% 2.2% 2.1% 4.9% 5.1% 5.2% 5.0%
Decile 3 3.5% 3.7% 3.8% 3.6% 5.7% 5.9% 6.1% 5.9%
Decile 4 4.9% 5.1% 5.2% 4.9% 6.5% 6.7% 6.9% 6.7%
Decile 5 6.2% 6.5% 6.6% 6.3% 7.3% 7.6% 7.7% 7.6%
Decile 6 7.8% 8.0% 8.1% 7.9% 8.2% 8.6% 8.7% 8.6%
Decile 7 9.6% 9.9% 9.9% 9.7% 9.4% 9.8% 9.9% 9.9%
Decile 8 12.1% 12.4% 12.4% 12.3% 11.1% 11.5% 11.7% 11.7%
Decile 9 16.2% 16.6% 16.5% 16.4% 13.8% 14.2% 14.3% 14.3%
Top Decile 37.1% 35.1% 34.6% 36.1% 29.3% 26.5% 25.4% 26.2%
Top 1% 12.4% 10.3% 9.8% 11.3% 10.0% 7.4% 6.6% 7.4%
Top 0.1% 4.7% 3.4% 3.1% 4.4% 4.0% 2.4% 2.0% 2.8%
S80/20 20.3 18.9 17.7 19.3 4.9 4.5 4.3 4.5
Source: Revenue analysis.
Income Tax and USC Shares
Income Tax and USC contributions are shown for each decile (in terms of gross income) in
Table 8.16 The top income deciles contribute a substantially higher share of the Income Tax
and USC liability compared to lower deciles. Deciles above the 9th decile pay a higher
share of Income Tax and USC receipts compared to their share of gross income, while the
reverse is true for the lower deciles. The lower deciles contribute a larger share of USC
receipts compared to their contributions to Income Tax receipts. However, the share paid
by deciles below the top decile has fallen in 2015 compared to 2012 reflecting changes in
the USC rates and bands in favour of those on lower incomes.
16
Income Tax does not include other taxes on income such as PRSI, health contribution or the income levy.
Shares of the USC are shown separately for the years 2012 and 2015.
17 Statistics & Economic Research BranchApril 2018
Table 8: Share of Income Tax and USC Contributions
Income Tax USC
2006 2009 2012 2015 2012 2015
Bottom Decile 0.0% 0.0% 0.0% 0.0% 0.0% 0.0%
Decile 2 0.0% 0.0% 0.1% 0.1% 0.2% 0.0%
Decile 3 0.1% 0.1% 0.1% 0.1% 1.3% 0.8%
Decile 4 0.5% 0.4% 0.8% 0.8% 2.6% 1.9%
Decile 5 1.8% 1.6% 1.8% 1.9% 4.2% 3.4%
Decile 6 3.3% 3.1% 3.4% 3.4% 6.4% 5.5%
Decile 7 5.8% 5.5% 6.1% 5.8% 9.0% 8.0%
Decile 8 10.4% 10.2% 10.8% 10.2% 12.6% 11.6%
Decile 9 17.6% 18.0% 17.8% 17.0% 18.2% 17.4%
Top Decile 60.5% 61.1% 59.0% 60.7% 45.4% 51.3%
Top 1% 9.5% 7.8% 7.0% 10.6% 1.4% 4.1%
Top 0.1% 3.6% 3.5% 2.7% 5.7% 0.9% 3.3%
Source: Revenue analysis.
2.9 Survival Analysis
Figure 6 illustrates the survival rate of taxpayers in the top 10%, 1% and 0.1% for each
year. Survival is calculated as the proportion of taxpayers that remain in a percentile
given that they were in that percentile in the initial year (2006). For the top 10% this is
46 per cent after 10 years. This is similar to the United States for a similar length period
where 38 per cent of those in the top 1% in 2000 remained there by 2009 (Auten and
Gee, 2009) although this may have been reduced by a large recession by the end date.
Indeed, over 5 year periods the survival rate (i.e., the percentage staying in the
percentile) for the top 1% is on average 34 per cent when the period did not include a
year with a recession and 30 per cent for all years (Auten and Gee, 2013).
For the top 10%, 1% and 0.1% cohorts, the survival rate in Ireland follows a similar trend
over the period, declining sharply in the first year and falling by less in future years. For
the top 0.1% the pattern of sharp decline in the initial years can also be observed in
Canada and France. In both countries after three years around 40 per cent of the top
0.1% remain in that group as in Ireland (Saez and Vaell, 2005; Landais, 2008). In
Germany, mobility of this high income group is lower with around 60 per cent of the 0.1%
income bracket remaining there after 3 years (Jenderny, 2016).
The impact of the recession appears to have had an impact in 2009 on the top taxpayers
as the rate of decile of taxpayers in these cohorts increased. The decline of taxpayers in
the top 0.1% cohort is greater in 2007 and 2008 compared to the other cohorts perhaps
18 Statistics & Economic Research BranchApril 2018
reflecting the possibility that the very top taxpayers were affected to a greater extent
during the early stages of the recession. An analysis of the survival rate of the top
taxpayers in terms of their Income Tax contributions is provided in Figure 7. Survival rates
for the top contributors to Income Tax are similar to those for the top taxpayers over the
full period.
Figure 6: Survival of Top Taxpayers over Time
Source: Revenue analysis.
Figure 7: Survival of Top Income Tax Contributors over Time
Source: Revenue analysis.
19 Statistics & Economic Research BranchApril 2018 3 Income Mobility 3.1 Introduction One way to measure income mobility is to examine the positional change of individuals in the income distribution over time (Jäntti and Jenkins, 2014). In this section, taxpayer mobility is measured using transition matrices.17 While the research literature suggests a number of approaches to calculating transition matrices, this paper employs the following approach. First, a group of taxpayers is identified, for example, PAYE taxpayers or those working in a particular sector. Taxpayers under 25 years of age are excluded from the analysis as recommended by the literature (Sawhill-Condon, 1992; Auten and Gee, 2009), in order to remove the unrepresentative ‘school-to-work transition’. Second, two comparison years are chosen and only taxpayers observed in both years are kept. Keeping only individuals of certain characteristics, for example, of those who continued to complete tax returns for a certain period is in line with the literature (US Department of Treasury, 1992a, 1992b; Carroll et al., 2006). Third, two distinct gross income deciles are then calculated for each year. Finally, the taxpayer transition is calculated across the two years and presented graphically. 3.2 Mobility of Taxpayer Population Figure 8 shows the transition probabilities for all taxpayers by the bottom, middle and top decile between 2006 and 2015. Of those in the bottom decile in 2006, 1 in 5 (23 per cent) remain entrenched in that decile over the ten year period while 4 in 5 (77 per cent) move upwards. In the middle decile, there is more mobility upwards (43 per cent) than downwards (36 per cent). Of those in the top decile in 2006, over half (57 per cent) stay in that decile by 2015. This appears to be roughly similar to the United States, where around half of the top fifth of income earners remain in the top quintile after 11 years over the period 1970 to 1995 (Bradbury, 2011).18 17 Transitions measure relative, not absolute, changes in the income position of taxpayers. A taxpayer’s relative position can fall even as their absolute income increases (and vice versa). Second, examination at two points in time does not allow for observing those who change their distributional position over the course of the reference period. Consequently, the analysis does not capture those who leave the workforce (due to deaths, unemployment, emigration and retirement) or those who enter it (through employment and immigration). Third, taxpayers observed in both years are less likely to ‘drop-off’. They may be more representative of full-time than part-time employees. Finally, it is expected that annual transitions are more likely to exhibit less mobility, while longer horizon transitions will have greater mobility. Based on the literature, it is expected that there would be relatively greater mobility in the middle deciles. 18 The international comparisons that are made in the paper should be treated as approximate as the literature uses a large range of different definitions for whose income, what type of income and over what period. This makes exact comparisons difficult. In this case the data used by Bradbury (2011) for the United States 20 Statistics & Economic Research Branch
April 2018

                Figure 8: Income Mobility for Selected Deciles 2006 – 2015

 Source: Revenue analysis. Note: Survival rates in the previous section are smaller than the transition matrices
 since the taxpayers in the base year are dropped (who are not observed in both periods) for transition matrices
               while these observations are retained for the purposes of calculating survival rates.

3.3      Mobility in the Recession, Stabilisation and Early Recovery Periods
Mobility appears to vary over time, with changes correlated with large economic events
and the business cycle. A comparison of the United States and the western states of
Germany found intra-generational mobility over 5 year periods was higher in Germany
prior to unification but subsequently is no different from the United States and possibly
lower post 2000 (Bayaz-Ozturk et al., 2014).

Figure 9 disaggregates mobility over the full period from 2006 to 2015 into three periods
coinciding with the recession, stability and early recovery periods (as outlined in the
Section 1.1). Compared to the previous analysis, mobility is smaller because it is
measured over a shorter timeframe. Mobility for those in the bottom decile increased after
the recession period. During the recession (2006 to 2009) 45 per cent remained
entrenched, while during the stability period (2009 to 2012) this fell to 37 per cent and to
39 per cent during the recovery (2012 to 2015). For the middle of the distribution, upward
movement in the income distribution increased slightly to 36 per cent during the stability
period compared to 35 per cent in the recession and 32 per cent in the recovery.

The proportions managing to stay in the top decile during the recession (71 per cent) is
lower compared to the stability (75 per cent) and recovery (78 per cent) periods. The
expansion period from 2012 to 2015 exhibit similar survival rates to Germany during

calculation is different from that used in this paper in several respects. It is based on household data, it is post
tax, post transfer and it is for the top quintile and it is during a different period.

21                                                                            Statistics & Economic Research Branch
April 2018
expansion, where over 2001-2006 around 78 per cent of those in the top 10% remained
there after 3 years (Jenderny, 2016).
Figure 9: Income Mobility for Recession, Stabilisation and Early Recovery Periods
Source: Revenue analysis.
22 Statistics & Economic Research BranchApril 2018 4 Conclusion In recent decades, global income shares have risen among the top 1% (Alvaredo et al., 2013). The trend has generated policy discussion on the extent to which citizens participate in national prosperity. Income inequality is measured in most countries based on a snapshot at a moment in time. Typically household survey data are used, in part due to its wide availability (Jäntti and Jenkins, 2014). In contrast, the current paper examines distributional and income mobility dynamics in Ireland using a unique longitudinal dataset drawn from administrative tax records. Compared to static survey data, longitudinal tax data have two significant advantages. First, the tax data allows for measuring intra-generational mobility over time: who moves up and down the income distribution over time and why. Second, it gives a scarce insight into income dynamics at the very top end, where the tax records are more comprehensive. Overall, this analysis represents a new avenue of research for Revenue focusing on making the best use of the tax record data, strengthening public debate and improving the evidence base for policy making. 23 Statistics & Economic Research Branch
April 2018

References

Alvaredo, F., A. B., Atkinson, T., Piketty, and E., Saez, “The Top 1 Percent in International
and Historical Perspective,” Journal of Economic Perspectives, 27, 1–21, 2013.

Auten, G., & Gee, G. (2009). Income mobility in the United States: New evidence from
Income Tax data. National Tax Journal, 301-328.

Auten, G., Gee, G., & Turner, N. (2013). Income inequality, mobility, and turnover at
the top in the US, 1987–2010. American Economic Review 103 (3), pp, 168–172.

Bayaz-Ozturk, G., Burkhauser, R. V., Couch, K. A., (2014). Consolidating the evidence
on income mobility in the Western states of Germany and the U.S. from
1984–2006. Economic Inquiry, 52(1), pp 431-443,

Bradbury, K. (2011), “Trends in U.S. family income mobility, 1969–2006”, Federal Reserve
Bank of Boston Working Paper, 11-10

Jenkins, S., (2011), Changing Fortunes, Income Mobility and Poverty Dynamics in Britain,
Oxford University Press

Jäntti, M. & Jenkins, S. P., (2014), “Income Mobility”, Society for the Study of Economic
Inequality Working Paper 2014-309

Jenderny, K. (2016), "Mobility of Top Incomes in Germany", Review of Income and
Wealth, v. 62 (2), pp. 245-65

Kennedy, S., Jin, Y., Haugh, D., & Lenain, P. (2016). Taxes, Income and Economic Mobility
in Ireland: New Evidence from Tax Records Data. The Economic and Social Review, 47(1,
Spring), 109-153.

Landais, C., “Top Incomes in France: Booming Inequalities?”, Paris School of Economics,
2008.

Larrimore, J., J. Mortensen, and D. Mortensen (2015) “Income and earnings mobility in US
Tax data”, Federal Reserve Board Discussion series, 2015-061.

Saez, E., and M. R. Veall. 2005. "The Evolution of High Incomes in Northern America:
Lessons from Canadian Evidence." American Economic Review, 95(3): 831-849.

24                                                            Statistics & Economic Research Branch
You can also read