OHIO SCHOOL REPORT CARDS - GUIDE TO 2018 - HEAC CHILDOURFUTURE - OHIO DEPARTMENT OF EDUCATION
←
→
Page content transcription
If your browser does not render page correctly, please read the page content below

EachChildOurFuture

Guide to 2018
Ohio School Report Cards

This guide provides an overview and explanation of the key components of the 2018 Ohio School Report Cards.

The six components are Achievement, Gap Closing, Improving At-Risk K-3 Readers, Progress, Graduation Rate and
Prepared for Success. Districts and schools receive A-F grades on each of the six components and most of the individual
measures. Measures receive grades as they have previously. For the first time, districts and schools will be assigned
overall letter grades.

Report cards are designed to give parents, communities, educators and policymakers information about the performance of
districts and schools – to celebrate success and identify areas for improvement. This information identifies schools to receive
intensive supports, drives local conversations on continuous improvement and provides transparent reporting on student
performance. The goal is to ensure equitable outcomes and high expectations for all of Ohio’s students.

Report cards are only one part of the story. To get a fuller picture, we encourage you to visit schools, talk to educators, parents
and students, and review the school’s or district’s webpage. A lot of great things are happening every day in Ohio’s schools!

                               reportcard.education.ohio.gov
GUIDE TO 2018 OHIO SCHOOL REPORT CARDS                 3

Table of Contents
                                    How well is Ohio’s education system performing?
04 What’s New in Ohio School
                                    In Ohio’s Strategic Plan for Education, Each Child, Our Future, the focus is on meeting the
    Report Cards for 2018?
                                    needs of the whole child. These needs include academic knowledge, but also leadership,
                                    reasoning and social-emotional skills that serve students as they become contributing
05 What do Ohio School Report
                                    members of society. Each day, 1.7 million students are supported by thousands of caring
    Cards measure                   educators as they grow to become Ohio’s future. Educators work hard, in collaboration with
                                    parents, community organizations, businesses and other partners, to prepare students for
06 How do I use this information?   success in an ever-changing world.
     06 Achievement

     06 Progress                    In classrooms across the state, our students are engaged and excited about learning and
                                    participating in well-rounded educational experiences. All of them have their own potential,
     07 Gap Closing                 inspiration, passions and pathways to success. It is our obligation to tend to the needs of each
     07 Graduation Rate             individual child and give each student the necessary tools that will last far beyond their years in
                                    Ohio’s preK-12 education system.
     08 Improving At-Risk K-3
        Readers
                                    The Ohio School Report Cards look at one part of the educational experience of Ohio’s students
     08 Prepared for Success        — the academic part. The realities of the future demand that Ohio set high expectations for
                                    what students should know and be able to do by the time they graduate from high school.
09 Understanding Ohio School
                                    The obligation of the education system is to work diligently to help students reach those
   Report Cards
                                    expectations. That’s why Ohio issues annual report cards for every public district and school,
                                    based on student academic performance and growth as measured by state tests. The state,
     09 Achievement
                                    local communities and Ohio’s citizens want to understand how well the education system is
     10 Progress                    performing with regard to student academic achievement.

     11 Gap Closing
                                    The report cards are not the only measure of the success or accomplishments of a school or
     12 Graduation Rate
                                    district. Visiting schools and talking to parents, students, teachers and graduates can paint a
     13 Improving At-Risk K-3       more complete picture of the educational experience. To help shed light on these other aspects
        Readers                     of school quality, for every district that requested it, we included a link to a profile page on
                                    which districts describe the unique qualities and accomplishments that make them proud.
     14 Prepared for Success

15 Other Report Card Information    As we’ve seen happen over time, schools and districts, as well as policymakers, will use the
                                    report cards to support ongoing discussions about school performance and to make well-
     15 Gifted Students             informed decisions about teaching and improvement strategies. We’re proud of the dedication
     16 Chronic Absenteeism         people bring to these discussions and are confident that by working together and identifying
                                    effective practices, we’ll create a bright and fulfilling future for our children and our state.
     17 End-of-Course

     18 English Language
        Proficiency

     19 Financial Data

20 Career-Technical Planning
   Districts

24 Dropout Prevention and
   Recovery Schools

29 Rewards and Recognition
                                        Tess Elshoff                                            Paolo DeMaria
                                        President, State Board of Education                     Superintendent of Public Instruction
September 2018
4    GUIDE TO 2018 OHIO SCHOOL REPORT CARDS

What’s new in Ohio School Report Cards for 2018?
Overall Letter Grades for Schools and Districts
For the first time, schools and districts will be assigned overall letter grades. The overall grade is calculated
by using results in the six components: Achievement, Progress, Gap Closing, Improving At-Risk K-3
Readers, Graduation Rate and Prepared for Success. When a school or district has letter grades for all six
components, the overall grade is determined using the following weights:

                                               Overall Grade

         20%                   20%                15%              15%               15%             15%

      Achievement                             Graduation Rate             Improving At-Risk
                                                                            K-3 Readers
                              Progress                         Gap Closing                Prepared for
                                                                                            Success

    For more detailed technical documentation on the report card, including calculations and statutory
    requirements, please visit education.ohio.gov and search Report Card Resources.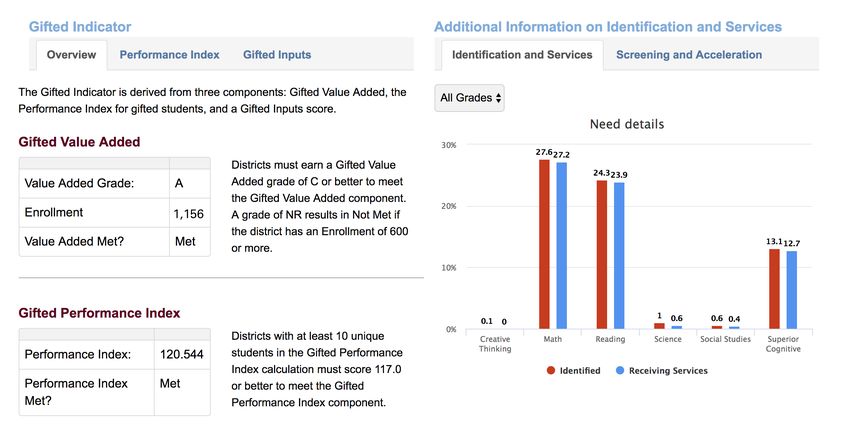
UNDERSTANDING
                                                                               HOW OHIO
                                                                                    DO I USE
                                                                                          SCHOOL
                                                                                             THIS INFORMATION?
                                                                                                  REPORT CARDS       5

What do Ohio School Report Cards measure?
Schools and districts report information for the Ohio School Report Cards on specific measures within six broader
components. The components are Achievement, Progress, Gap Closing, Graduation Rate, Improving At-Risk K-3
Readers and Prepared for Success. Schools and districts earn letter grades on each of the six components, most
of the individual measures and an overall summative rating. This helps give Ohio parents and schools a snapshot
of the quality of education they are providing their students.

             Achievement                                                  Progress
             The Achievement component of the                             The Progress component looks
             report card represents the number                            closely at the growth that all students
             of students who passed the state                             are making based on their past
             tests and how well they performed                            performances.
             on them. A new indicator this year
             measures the percentage of students
             who miss too much school.

             Gap Closing                                                  Graduation Rate
             The Gap Closing component shows                              The Graduation Rate component looks
             how well schools are meeting                                 at the percentage of students who are
             the performance expectations for                             successfully finishing high school with
             all students, especially our most                            a diploma in four or five years.
             vulnerable populations of students,
             in English language arts, math and
             graduation, and how they are doing in
             teaching English learners to become
             proficient in English.

             Improving At-Risk K-3 Readers                                Prepared for Success
             The Improving At-Risk K-3 Readers                            The Prepared for Success component
             component looks at how successful                            looks at how well prepared
             the school is at getting struggling                          Ohio’s students are for all future
             readers on track to proficiency in                           opportunities, whether training in a
             third grade and beyond. Third Grade                          technical field or preparing for work or
             Reading Guarantee Promotion rate                             college.
             information also is found here.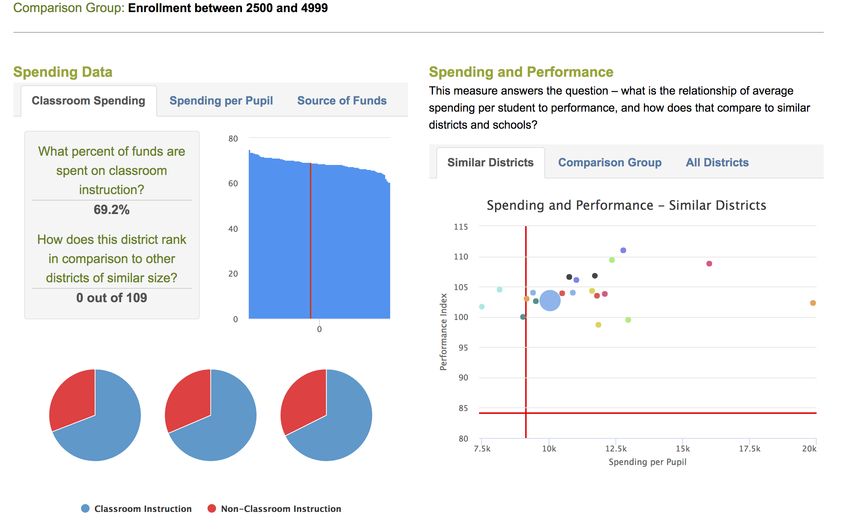
6   GUIDE TO 2018 OHIO SCHOOL REPORT CARDS

    How do I use this information?
    Examine the grades for your district or school. Ask questions about what you see.

      Achievement
     The Achievement component
     represents the number of                                      Progress
     students who passed the state tests and                       The Progress component looks closely at the
     how well they performed on them. Two new                      growth that all students are making based on
     indicators are included in the 2018 measures —                their past performances.
     the Chronic Absenteeism Improvement Indicator
     and the End-of-Course Improvement Indicator                   What is being graded?
                                                                   Progress of:
     What is being graded?                                           1. All students;
      1. Indicators Met – How did students perform                   2. Gifted students;
         on state tests?
                                                                     3. Lowest 20 percent of students in
      2. Performance Index – How well did students                      achievement; and
         perform on the tests overall?                               4. Students with disabilities.
      Why is this important?                                       Why is this important?
      • It shows if students are meeting grade-level                 • All students should make progress in each
        expectations.                                                  subject or they will fall behind.
      • It shows how far above or below grade-level                  • Making progress is the expectation of
        expectations students performed.                               parents and the community.

     What is an A?                                                 What is an A?

      • Your school or district must exceed state                    • The group of students makes more than
        standards.                                                     expected progress.

      • The grade will improve as students score                   What is a C?
        higher on tests.                                             • The group of students makes expected
                                                                       progress.
     Questions to ask
      • Which students are performing well and                     Questions to ask
        which are not?                                               • Which students are making progress and
                                                                       which are not?
      • In which subjects and grades are students
        doing well? Why?                                             • How can we change instruction for groups
                                                                       that are not making progress every year?
      • In which subjects and grades are students
        not doing well? Why?                                         • Which districts, similar to ours, are doing
                                                                       better than we are? What are they doing?
      • Which districts, similar to ours, are doing
        better than we are? What are they doing?
      • Does my school have a high percentage of
        students who miss a lot of school? Why?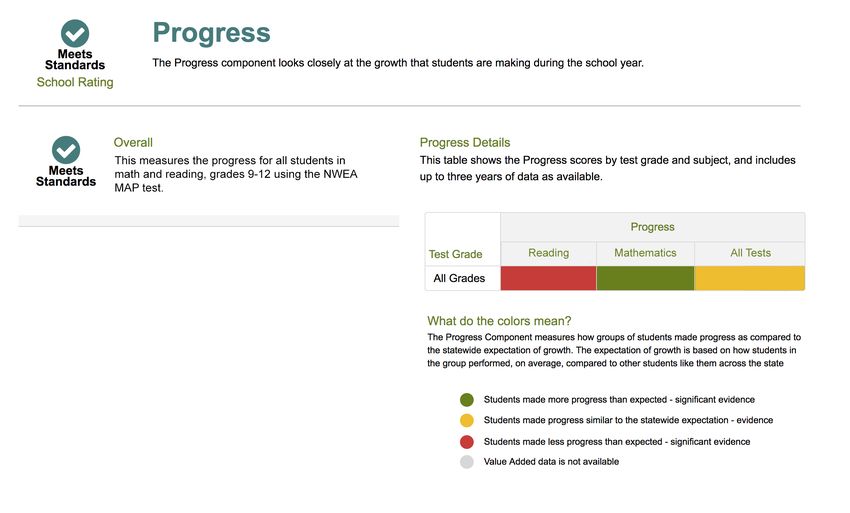
HOW DO I USE THIS INFORMATION?      7

Gap Closing                                        Graduation Rate
The Gap Closing component shows how                The Graduation Rate component looks at the
well schools are meeting the performance           percentage of students who are successfully
expectations for our most vulnerable               finishing high school with a diploma in four or
populations of students in English language        five years.
arts, math and graduation, so that all of Ohio’s
                                                   What is being graded?
students can be successful. It also measures
how well schools are teaching English learners       1. Four-Year Graduation Rate – How many
to become proficient in English.                        students graduated in four years or less?
                                                     2. Five-Year Graduation Rate – How many
What is being graded?
                                                        students graduated in five years or less?
How does the performance of student groups in
my district or school compare to a state goal?     Why is this important?
                                                   Almost all jobs require skills and education
Why is this important?
                                                   beyond a high school diploma. Measuring the
Every student should have success with             five-year rate gives districts credit for helping
foundational knowledge. When groups of             students who just missed graduating on time
students are not succeeding, educators need to     finish their diplomas.
review why and make changes.
                                                   Questions to ask
What is an A?
                                                     • What are the reasons students are not
Students are demonstrating high performance            graduating?
or significant improvement from the prior year.      • Are there certain subjects that are holding
Questions to ask                                       students back?

  • How are different groups of students             • What are we doing to grow the number
    performing?                                        of students who graduate?

  • How can we improve instruction for groups        • Which districts, similar to ours, are doing
    that are not succeeding?                           better than we are? What are they doing?

  • Are students whose native language is
    not English making progress in becoming
    proficient in English?
  • Which districts, similar to ours, are doing
    better than we are? What are they doing?
8   GUIDE TO 2018 OHIO SCHOOL REPORT CARDS

    Improving At-Risk
    K-3 Readers                                         Prepared for Success
    The Improving At-Risk K-3 Readers component         Whether training in a technical field or preparing
    looks at how successful the district and school     for work or college, the Prepared for Success
    are at getting struggling readers on track to       component looks at how well prepared Ohio’s
    proficiency in third grade and beyond.              students are for future opportunities.

    What is being graded?                               What are the measures?
    The measure looks at students who are not           Primary measures:
    on track on the kindergarten diagnostic and           • College entrance exam remediation-free
    gives credit for those students who improve             scores (ACT/SAT);
    to on track following the first-grade diagnostic.     • An honors diploma; or
    Similarly, it measures improvement from the           • An industry-recognized credential or group
    first- to second-grade diagnostics, second- to          of credentials worth 12 points.
    third-grade diagnostics and from the third-
    grade diagnostic to the third-grade state test.     Bonus measures:
                                                         • Advanced Placement tests scores;
    Why is this important?                               • International Baccalaureate tests scores; or
    Literacy in early grades predicts how students       • College Credit Plus credits.
    will do throughout the remainder of their
                                                        Why is this important?
    school careers.
                                                          • Graduation is not enough. Students must be
    What is an A?                                           prepared for further education or work after
                                                            high school.
    All students who are not on track in reading
    receive interventions and improve to being on         • Whether training in a technical field or
    track.                                                  preparing for work or college, these
                                                            indicators measure preparedness.
    Questions to ask
                                                        Questions to ask
      • What are we doing to help our struggling
        readers?                                          • Which of the elements in the Prepared
                                                            for Success component are our schools
      • Do we have specialists, intervention                providing?
        services or outside assistance in place to
                                                          • Why are we not offering other elements?
        meet the needs of struggling readers?
      • How many students enter our schools               • Are those moving on to college able to do
                                                            college-level work immediately?
        struggling to read and how successful are
        we in helping them catch up?                      • How do we inform parents and encourage
                                                            students to get involved in these
      • Which districts, like ours, are doing better
                                                            opportunities?
        than we are? What are they doing?
                                                          • Are all groups of students accessing these
                                                            opportunities?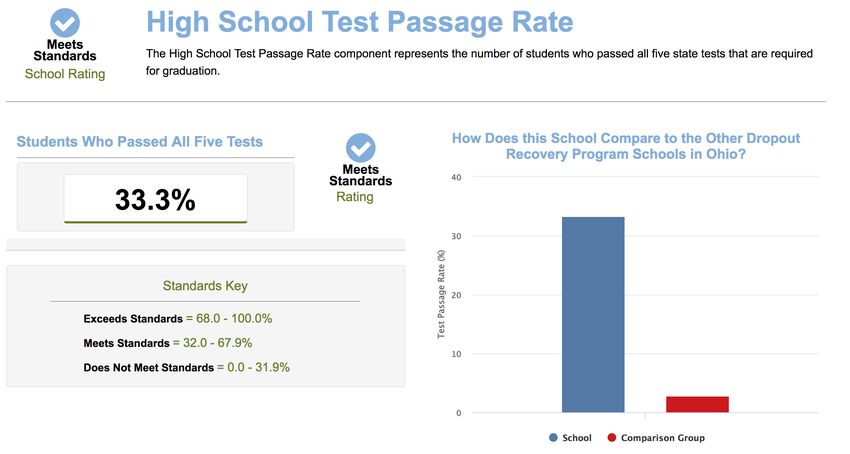
UNDERSTANDING
                                                                                       HOW OHIO
                                                                                            DO I USE
                                                                                                  SCHOOL
                                                                                                     THIS INFORMATION?
                                                                                                          REPORT CARDS         9

      Understanding Ohio School Report Cards

                       Achievement Component

      Measures:
        Indicators Met
      		Performance Index

      Description:    The Achievement component represents the number of students who passed the state tests and
                      how well they performed on them. This component includes three additional performance indicators
                      — Chronic Absenteeism Improvement, End-of-Course Improvement and Gifted Indicator.

                      The Performance Index measures the achievement of every student, not just whether or not they
                      reach “proficient.” Districts and schools receive points for every student’s level of achievement. The
                      higher the student’s level, the more points the school earns toward its index. This rewards districts
                      and schools that improve the performance of highest- and lowest-performing students.

                      The Indicators Met measure represents student performance on state tests. It is based on a series
                      of up to 23 state tests that measure the percent of students proficient or higher in a grade and
                      subject. Schools and districts also are evaluated on the Gifted Indicator, the Chronic Absenteeism
                      Improvement Indicator and an End-of-Course Improvement Indicator, giving districts and schools up
                      to 26 possible indicators.

      New this Year: Two new indicators are included in the Indicators Met measure. The Chronic Absenteeism
                      Improvement Indicator measures the number of students who are chronically absent (defined as
                      missing at least 10 percent of the school year) and the efforts to reduce that number. The End-of-
                      Course Improvement Indicator measures the performance and improvement on retaken end-of-course
                      tests.

      A-F Rating:     Score				Letter Grade
      		              90% - 100%			                         A
      		              80% - 89.9%			                         B
      		              70% - 79.9%			                         C
      		              50% - 69.9%			                         D
      		              Below 50%			                           F

Component Grade:     Performance Index score: the level of                               Component Grade
                     achievement for each student on each state
                     test. The possible levels are Advanced,
                     Accelerated, Proficient, Basic and Limited.
                                                                                          75%                       25%
                     Indicators Met score: how many students
                     show “Proficient” knowledge on state tests
                     in each grade and subject, and how many
                     students meet the benchmarks established                      Performance Index
                     on the three additional indicators. In other                                               Indicators Met
                     words, how many students have met the
                     basic expectations.
10   GUIDE TO 2018 OHIO SCHOOL REPORT CARDS

                Progress Component

Measures:       Progress for:
                                •   All students in the school;
                                •   Gifted students;
                                •   Students with disabilities;
                                •   Students whose academic performance is in the lowest 20 percent
                                    of students statewide.

Description:    Not all children start at the same place with their learning, but every student should learn and grow
                throughout the school year. Progress looks closely at the growth all students are making based on
                their past state test performances. All tests are used to measure growth in grades 4-8. At the high
                school level, only English language arts and math tests are used.

Technical Fact: Students’ state tests are examined through a series of calculations to produce a “value-added”
                rating for your school or district for each of the four groups listed above.

                A group that has made more than expected growth earns the school or district an A or B grade.
                Expected growth by a student group gives the school or district a C grade. A student group that has
                made less than expected growth results in a D or F grade for the school or district.

                                            Component Grade

                                55%                                  15%                15%            15%

                           All Students                                            Students with
                                                                                    Disabilities

                                                                Gifted Students                     Students Whose
                                                                                               Academic Performance is
                                                                                               in the Lowest 20 Percent
                                                                                                of Students Statewide
UNDERSTANDING OHIO SCHOOL REPORT CARDS 11
Gap Closing Component
Measures: Annual Measurable Objectives
Description: Schools must close the achievement gaps that exist between groups of students that may be
based on income, race, ethnicity or disability. This component shows how well schools are meeting
performance expectations for our most vulnerable students in English language arts, math and
graduation. It compares the academic performance of each subgroup against the expected
performance goals for that subgroup to determine if there are gaps and whether improvement
is happening. A new element to this component, English Language Proficiency Improvement,
measures the improvement English learners make toward English language proficiency.
Technical Fact: The English Language Proficiency Improvement element, included in Gap Closing, measures only
the language improvement of English learners.
A district or school cannot earn a final letter grade of A on the Gap Closing component if any of its
evaluated subgroups have a math or English language arts Performance Index score lower than 60
points or a graduation rate lower than 70 percent in the current year.
The groups of students include:
• All Students; • Multiracial;
• American Indian/Alaskan Native; • White, Non-Hispanic;
• Asian/Pacific Islander; • Economically Disadvantaged;
• Black, Non-Hispanic; • Students with Disabilities; and
• Hispanic; • English Learners.
A-F Rating: The targets for each group are detailed in Ohio’s approved Every Student Succeeds Act (ESSA)
state plan.
Score Letter Grade
90% - 100% A
80% - 89.9% B
70% - 79.9% C
60% - 69.9% D
Less than 60% F12 GUIDE TO 2018 OHIO SCHOOL REPORT CARDS
Graduation Rate Component
Measures: Four-Year Graduation Rate
Five-Year Graduation Rate
Description: The Four-Year Graduation Rate includes only those students who earn diplomas within four years of
entering ninth grade for the first time. The Five-Year Graduation Rate includes those students who
graduate within five years of entering ninth grade for the first time.
Technical Fact: In 2010, Ohio transitioned to a new method of calculating the graduation rate. The federal
government set this rate to allow for comparisons between Ohio and other states. The calculation
for the Four-Year Graduation Rate divides the number of students who graduate high school in four
years or less by the number of students who form the adjusted group for the graduating class.
The calculation for the Five-Year Graduation Rate divides the number of students who graduate
high school in five years or less by the number of students who form the adjusted group for the
graduating class. The adjusted group includes all students who entered ninth grade for the first
time four years earlier. A group is adjusted by adding any students who transfer into the group later
during the ninth grade and the next three years and subtracting students who transferred out. A
student can be in only one group.
A-F Rating: The ranges for the graduation rate measures are different and partially prescribed in law.
Four-Year Graduation Rate Five-Year Graduation Rate
Score Letter Grade Score Letter Grade
93% - 100% A 95% - 100% A
89% - 92.9% B 90% - 94.9% B
84% - 88.9% C 85% - 89.9% C
79% - 83.9% D 80% - 84.9% D
Less than 79% F Less than 80% F
Component Grade
Four-Year Five-Year
Graduation Rate Graduation RateUNDERSTANDING OHIO SCHOOL REPORT CARDS 13
Improving At-Risk K-3 Readers Component
Measures: Improving At-Risk K-3 Readers
Description: Reading is the foundation for all learning. Improving At-Risk K-3 Readers (formerly known as K-3
Literacy Improvement) looks at how successful the school and district are at getting struggling
readers on track to proficiency in third grade and beyond.
The measure and component relate to Ohio’s Third Grade Reading Guarantee, which aims to make
sure all students are reading at grade level by the end of third grade. The guarantee drives attention
to students from kindergarten through third grade who are struggling readers and makes sure they
get the help they need to succeed in reading. Through this initiative, districts and schools diagnose
reading issues, create individualized reading improvement and monitoring plans, and provide
intensive reading interventions.
Improving At-Risk K-3 Readers uses results from two assessments: a reading diagnostic given to all
students in kindergarten through grade 3 at the beginning of the school year and Ohio’s state third
grade English language arts test given to third-graders twice during the school year.
Technical Fact: Any school or district that had fewer than 5 percent of its kindergartners reading below grade
level at the beginning of the 2017-2018 school year will not receive a letter grade for this measure.
Students who do not score Proficient or higher on the state’s third grade English language arts test
and are not receiving services through a reading improvement and monitoring plan are deducted
from a district’s or school’s score.
The grades for this measure and component are based on the percentage of students in each of
the following situations:
• Students who were not on track in reading last year in kindergarten and now are on track in
first grade;
• Students who were not on track in reading last year in first grade and now are on track in
second grade;
• Students who were not on track in reading last year in second grade and now are on track in
third grade; and
• Students who were not on track in reading last year at the beginning of third grade who
scored “Proficient” on Ohio’s third grade English language arts test.
A-F Rating: State law requires the grade for the measure to be based on the prior year’s state average.
Score Letter Grade
78.3% - 100% A
56.6% - 78.2% B
34.9% - 56.5% C
13.2% - 34.8% D
Less than 13.1% F14 GUIDE TO 2018 OHIO SCHOOL REPORT CARDS
Prepared for Success Component
Measures: College entrance exam (ACT/SAT) Advanced Placement
Honors Diploma International Baccalaureate tests
Industry-recognized credentials College Credit Plus
Description: Whether training in a technical field or preparing for work or college, the Prepared for Success
component looks at how well prepared Ohio’s students are for future opportunities.
Using multiple measures for college and career readiness enables districts to showcase their unique
approaches to prepare students for success after high school. For example, some school districts
may focus on Advanced Placement courses while others focus on College Credit Plus credits.
New this Year: This is the third, and final, year where the component grade scale increased.
Technical Fact: Primary measures
A district earns 1 point for every student who earns any of the following:
1. ACT or SAT remediation-free scores;*
2. An Honors Diploma; or
3. Twelve points through an industry-recognized credential or group of credentials in one of 13
high-demand career fields.
*If a student achieves more than one of the above, the district still earns 1 point for that student.
Bonus measures
For every student who earns 1 point plus one of the following, a district earns 0.3 additional points:
1. Advanced Placement tests – Scores 3 points or more on at least one test;
2. International Baccalaureate tests – Scores 4 points or more on at least one test; or
3. College Credit Plus – Earns at least 3 credits.
*If a student achieves more than one of the above, the district still earns 0.3 bonus points for that
student.
Add the total points the district earned on the six measures, then divide that number by the total
number of students in the adjusted classes of 2016 and 2017. The maximum points possible are
1.3 per student.
A-F Rating: Score Letter Grade
Example of what the letter grade calculation looks like:
93% - 100% A
75% - 92.9% B Points district earned1 762
1,000 76.2% B
60% - 74.9% C Students in adjusted classes of
40% - 59.9% D 2016 and 20172
Less than 39.9% F
*Ohio’s university presidents set these scores, which are subject to change.
1
Based on six measures.
2
All students who started ninth grade five years ago (class of 2016) plus those who started ninth grade four years ago (class of 2017). Both numbers are
adjusted by adding in students who moved into the district – and by subtracting those who moved out – since ninth grade began.UNDERSTANDING OHIO SCHOOL REPORT CARDS 15
Other Report Card Information
Gifted Students
This information identifies the number of a district’s or school’s students who are identified as gifted and
how many of them are receiving gifted services. Additionally, it shows how gifted students are performing
academically. You can find this information in the Achievement component.
Example:16 GUIDE TO 2018 OHIO SCHOOL REPORT CARDS
Chronic Absenteeism Improvement Indicator
Measures: Chronic Absenteeism Improvement Indicator
Description: It is important for every student in Ohio to attend school every day. Missing too much school has
long-term, negative effects on students, such as lower achievement and graduation rates. When
students are not at school, they cannot benefit from the instructional resources and supports
schools provide. Students miss school for many different reasons, such as chronic health issues,
family commitments, lack of social and emotional support, or safety issues. Whether excused or
unexcused, missing too much school has detrimental effects on a student’s learning trajectory. This
indicator is key to helping districts and schools identify trends to assist in directing supports geared
toward students needs.
In Ohio’s approved Every Student Succeeds Act (ESSA) plan, chronic absenteeism was identified
as the additional measure of school quality or student success because there is a significant
body of research around the impact of chronic absenteeism on academic performance. Research
supports that chronic absenteeism, defined as missing at least 10 percent of the instructional time
for any reason – excused or unexcused absences – is one of the primary causes of low academic
achievement. Beginning in 2017-2018, the Chronic Absenteeism Improvement Indicator will
contribute to the Indicators Met measure within the Achievement component.
Technical Fact: Schools and districts will meet the indicator if they meet the established threshold or show
improvement from the previous year by:
1. Meeting or exceeding the annual goal (13.6 percent for 2017-2018); or
2. Meeting an improvement standard relative to the starting point of each school or district.
Baseline Chronic Absenteeism Improvement Standard
36.7% or higher 1.1 percentage point
Lower than 36.7% 3%
The two improvement standards allow for attainable improvement for all schools and districts –
regardless of its baseline or prior-year rate. The emphasis is to highlight the data and provide crucial
supports to students in an effort to increase achievement.UNDERSTANDING OHIO SCHOOL REPORT CARDS 17
End-of-Course Improvement Indicator
Measures: End-of-Course Improvement Indicator
Description: Previously, when students retook end-of-course tests, their performance was included in the
indicator for the relevant test. This means the measure included first-time test takers’ scores and
scores from retaken tests.
The content indicators in the Indicators Met measure now only will include first-time test
takers’ performance, while the End-of-Course Improvement Indicator will measure performance
and improvement for retaken tests. This provides long-term trends and a true picture of initial
performance levels toward school and district goals.
Highlighting how schools and districts are performing on retakes in particular will shed light on
efforts to provide remediation or other supports for students who did not score proficient or
higher on the initial administration of the respective end-of-course tests. Students who already
have scored proficient will not be addressed in the indicator in order to prevent any unintended
incentives to have those students take additional tests.
Technical Fact: All retaken tests with initial scores of 1 or 2 (out of 5) will be included in the calculation
denominator. Improving one or more levels will count as ‘1’ in the numerator; and ‘0.3’ bonus
points will be awarded for improving two or more levels.18 GUIDE TO 2018 OHIO SCHOOL REPORT CARDS
English Language Proficiency Improvement Measure
Measures: English Language Proficiency Improvement
Description: To help ensure English learners’ equitable access to school success, this measure accounts for how
well a school or district meets its federal obligation of assisting English learners in their acquisition
of English language proficiency. English Language Proficiency Improvement is one of the elements
of the Gap Closing component.
The English Language Proficiency Improvement measure quantifies the improvement English
learners make toward English language proficiency. The measure relates to gains in proficiency as
measured by individual student performance on the Ohio English Language Proficiency Assessment
(OELPA). Schools and districts identify initial level of proficiency of English learners using the
OELPA. Based on a student’s proficiency on the initial administration of the OELPA, a target for
annual improvement is established for the student. The school and district then provides services
to the student based on the student’s proficiency level. When the student is administered the
OELPA in the following year, each student’s improvement will be measured to evaluate whether the
student met or exceeded the annual improvement target.
Technical Fact: This measure includes only current English learners; students are no longer included once they
reach proficiency on the OELPA. If a student scores proficient on the first administration of the
OELPA, the student will be identified as having met the improvement target in that year.UNDERSTANDING
CAREER-TECHNICAL
OTHER OHIO SCHOOL
REPORT PLANNING
CARDREPORT CARDS 19
DISTRICTS
INFORMATION
Financial Data
These measures answer several questions about spending and performance. How much is spent on classroom
instruction? How much, on average, is spent on each student? What is the source of the revenue? How do these
measures compare to other districts and schools?
Example:
Every district and school report card includes this financial information.20 GUIDE TO 2018 OHIO SCHOOL REPORT CARDS
Report Card for Career-Technical Planning Districts
There are four graded components on this report card – Achievement, Graduation Rate, Prepared for Success and
Post-Program Outcomes. Federal accountability results also are reported but do not receive a letter grade.
Achievement Component
The Achievement component has two measures – Technical Skill Attainment and Indicators Met. Technical Skill
Attainment shows the proportion of students passing technical assessments. These assessments measure
the skills and knowledge learned in a student’s career-technical program. The calculation for Indicators Met
is the same as the Indicators Met for traditional report cards. Go to Page 9 for a complete explanation of the
Indicators Met measure.
What is being graded? How are the two measures graded?
1. The percent of students who participate in The Technical Skill Attainment Rate reflects the
technical assessments; proportion of students who passed the technical
2. The percent of students who pass the tests in their career-tech programs. The passage
technical assessments; and rate only includes students who took tests.
3. The percent of students who met the state
standard by scoring proficient or higher on The Indicators Met measure represents student
the required state tests. performance on state tests. It is based on a series
of up to 14 state tests that measure the percent
Questions to ask of students proficient or higher in a grade and
subject. Schools and districts also are evaluated on
• Which career-technical centers, similar to
the End-of-Course Improvement Indicator, giving
ours, are doing better than we are? What are
they doing? districts and schools up to 15 possible indicators.
• What help do our students need to pass
assessments?
Letter Technical Skill Indicators
• What are we doing to increase participation? Grade Attainment Rate Met
A 90-100% 90-100%
Component Grade
B 80-89.9% 80-89.9%
C 70-79.9% 70-79.9%
75% 25% D
F
60-69.9%
Less than 60%
50-69.9%
Less than 50%
Effect Test Participation Rate
Decrease of one letter gradeCAREER-TECHNICAL PLANNING DISTRICTS 21
Graduation Rate Component
This grade measures the percent of students who concentrate in career-technical education and graduate
from high school within four or five years.
What is being graded? How is the grade determined?
1. Four-Year Graduation Rate – How many The Four-Year Graduation Rate includes
students graduated in four years or less? only those students who earn diplomas within
four years after entering ninth grade for the
2. Five-Year Graduation Rate – How many
first time and concentrated in career-technical
students graduated in five years or less?
education.
Why is this important? Score Letter Grade
93% - 100% A
Almost all jobs require skills and education 89% - 92.9% B
beyond a high school diploma. Measuring the 84% - 88.9% C
five-year rate gives districts credit for helping
79% - 83.9% D
students who just missed graduating on time
Less than 79% F
finish their diplomas.
The Five-Year Graduation Rate includes
Questions to ask those students who graduate within five years
after entering ninth grade for the first time and
• What are we doing to grow the number concentrated in career-technical education by
of students who graduate? the end of their fourth year.
• What are the reasons students are not
Score Letter Grade
graduating?
95% - 100% A
• Are there certain subjects that are holding 90% - 94.9% B
students back? 85% - 89.9% C
• Which districts, similar to ours, are doing 80% - 84.9% D
better than we are? What are they doing? Less than 80% F
Component Grade
Four-Year Five-Year
Graduation Rate Graduation Rate22 GUIDE TO 2018 OHIO SCHOOL REPORT CARDS
Prepared for Success Component
Whether training in a technical field or preparing for work or college, the Prepared for Success component*
looks at how well prepared Ohio’s students are for future opportunities.
How is the grade determined?
•
Primary measures
•
A district earns 1 point for every student who earns any of the following:
• 1. ACT or SAT remediation-free scores.
• 2. An Honors Diploma; or
• 3. Twelve points through an industry-recognized credential or group of credentials in one of 13
• high-demand career fields.
•Bonus measures
• For every student who earns 1 point plus one of the following, a district earns 0.3 additional points:
• 1. Advanced Placement tests – Scores 3 points or more on at least one test;
• 2. International Baccalaureate tests – Scores 4 points or more on at least one test; or
3. College Credit Plus – Earns at least 3 credits.
Why is this important? Questions to ask
• Graduation is not enough. Students must
• Which elements measured in Prepared for
be prepared for further education or work
after high school. Success are our schools providing?
• Whether training in a technical field or • Why are we not offering other elements?
preparing for work or college, these • Are those moving on to college able to do
indicators measure preparedness. college-level work immediately?
• How do we inform parents and encourage
students to get involved in these
opportunities?
• How prepared are our students to get
good jobs at area businesses?
*See page 14 for a full explanation of the Prepared for Success component.DROPOUT
CAREER-TECHNICAL
PREVENTION ANDPLANNING SCHOOLS 23
RECOVERYDISTRICTS
Post-Program Outcomes Component
This shows the percent of students who are employed, in apprenticeships, in the military, or enrolled in
postsecondary education or advanced training within six months of graduating high school.
A second ungraded measure reports information on industry-recognized credentials. Students must
earn 12 points through an industry-recognized credential or group of credentials before they leave high
school or in the six-month period after leaving school to be counted in this measure.
What is being graded? How is the grade determined?
Percent of graduates who are employed, The Post-Program Placement Rate reflects the
in apprenticeships, in the military, or proportion of students who left school and, in
enrolled in postsecondary education the subsequent months after leaving, were
or advanced training within six months employed, in the military, in apprenticeships
after graduation. or enrolled in postsecondary education
or advanced training. Only students who
What is being reported? responded to surveys six- to nine-months after
leaving school are included in this rate.
Percent of graduates who earn one or
more credentials or certificates before Score Letter Grade
graduation or within six months after
93% - 100% A
graduation. There is currently no grade
89% - 92.9% B
attached to the credentials measure.
84% - 88.9% C
Why is this important? 79% - 83.9% D
Less than 79% F
• All graduates should move on to their
next steps in higher education or jobs. The Post-Program Outcomes grade also
• Earning a credential or certificate considers the proportion of student who
ensures the student has an employable completed their surveys. This is called the
skill. Status Known Rate. The Post-Program
Outcomes grade is increased by one letter
grade for Career-Technical Planning Districts
Questions to ask
with high Status Known Rates and decreased
• Are students prepared for careers after by one letter grade for Career-Technical Planning
graduation? Districts with low Status Known Rates.
• What learning and employment Status Known Rate Effect
opportunities are students transitioning 95% - 100% Letter grade increased one level.
to after graduation? 85% - 94.9% No change to initial letter grade.
Less than 85% Letter grade decreased one level.24 GUIDE TO 2018 OHIO SCHOOL REPORT CARDS
Report Card for Dropout Prevention and Recovery Schools
Community schools that serve a majority of their students through dropout prevention and recovery programs
receive this report card. Rather than A-F grades, dropout prevention and recovery schools receive one of the
following ratings for report card measures – Exceeds Standards, Meets Standards, or Does Not Meet Standards.
Overall Grade
20% 20% 30% 30%
High School Test Progress
Passage Rate
Gap Closing Graduation Rate
High School Test Passage Rate Progress
This rating reports the percentage of This rating is the school’s average
students who passed all applicable tests progress for its students in math and
as required for high school graduation. reading, using the NWEA Measures
of Academic Progress (MAP) in grades
9-12. Progress looks closely at the
growth that all students are making.
Gap Closing
This rating shows how well schools are
meeting the performance expectations
for students in English language arts, Graduation Rate
math, graduation and English Language This rating reports the number of
Proficiency Improvement. students graduating from the school
in four, five, six, seven or eight years.DROPOUT PREVENTION AND RECOVERY SCHOOLS 25
High School State Test Passage Rate
This rating reports the percentages of students who passed all applicable tests required for high school
graduation.
What is being rated? Questions to ask
The number of students who have passed all • Are students in this school succeeding
applicable tests by 12th grade or within three academically in this program?
months of turning 22. • If not, why?
Example:26 GUIDE TO 2018 OHIO SCHOOL REPORT CARDS
Gap Closing
This rating shows how well schools are meeting the performance expectations for our most vulnerable populations
of students in English language arts, math, graduation and English Language Proficiency Improvement.
What is being rated? Questions to ask
How does the performance of student • How are different groups of students
groups in my school compare to a state goal? performing?
Why is this important? • How can we change instruction for
groups that are not succeeding?
Each student should succeed in learning.
When a group or groups of students are not • Are students whose native language is
succeeding, educators need to review why not English making progress in becoming
and make changes. proficient in English?
• Which districts, similar to ours, are doing
better than we are? What are they doing?
Example:
*See page 10 for a full explanation of the Gap Closing component.DROPOUT PREVENTION AND RECOVERY SCHOOLS 27
Graduation Rate
This rating reports the number of students graduating from your school in four, five, six, seven or eight years.
What is being rated? Why is this important?
1. The number of students who graduated Almost all jobs require skills and education
in four years or less. beyond a high school diploma. Measuring the
2. The number of students who graduated four-, five-, six-, seven- and eight-year graduation
in five years or less. rates gives the school credit for helping
students finish their diplomas.
3. The number of students who graduated
in six years or less. Questions to ask
4. The number of students who graduated
• If students are not graduating, why not?
in seven years or less.
5. The number of students who graduated
in eight years or less.
Example:28 GUIDE TO 2018 OHIO SCHOOL REPORT CARDS
Progress Component
This rating is your school’s average progress for its students in math and reading using the NWEA
Measures of Academic Progress (MAP) test in grades 9-12. Progress looks closely at the growth that
all students are making based on their past performances. The progress component also reflects the
testing participation rate. A school that does not test at least 75 percent of its students receives a rating
of “Does Not Meet” standards.
Example:DROPOUT PREVENTION
REWARDS
AND RECOVERY SCHOOLS 29
AND RECOGNITION
Rewards and Recognition
Ohio recognizes schools for maintaining high academic achievement among their students, including many from
economically disadvantaged circumstances that can make learning difficult. Visit education.ohio.gov/Rewards-and-
Recognition to view the full list of Reward Schools. Reward Schools for 2018 were not yet awarded at the time this
guide was published.
Schools of Promise
To help close achievement gaps in Ohio, the Schools of Promise program identifies,
recognizes and highlights schools that are making substantial progress in ensuring high
Schoo
ls of Promise achievement for all students.
For past winners and achievement criteria, click here.
Schools of Honor - High Performing/High Progress
The Schools of Honor program recognizes schools that have sustained high
2018 2018
achievement and substantial progress while serving a significant number of
economically disadvantaged students.
For past winners and achievement criteria, click here.
All A Award
The All A Award is presented by the State Board of Education and recognizes districts and
schools that earned straight A’s on all of their applicable report card measures.
2018 For past winners and achievement criteria, click here.
rall A Awar
ve
Overall A Award – Coming in 2018
O
d
The Overall A Award is presented by the State Board of Education and recognizes
districts and schools that earned an Overall A.
For achievement criteria, click here. 201830 GUIDE TO 2018 OHIO SCHOOL REPORT CARDS
Momentum Award
The Momentum Award is presented by the State Board of Education and recognizes
districts and schools for exceeding expectations in student growth for the year.
2018 For past winners and achievement criteria, click here.
Blue Ribbon Schools
The Blue Ribbon Schools Program is a national recognition program honoring elementary
and secondary schools in the United States that make significant progress in closing,
achievement gaps or whose students achieve at the highest levels in the their state.
For past winners and achievement criteria, click here.
National Title I Distinguished Schools
These schools demonstrate a wide array of strengths, including team approaches to teaching
and learning, focused professional development opportunities for staff, individualized programs
for student success and strong partnerships between the school, parents and the community.
For past winners and achievement criteria, click here.
Green Ribbon Schools
Ohio Green Ribbon Schools recognize staff, students, officials and communities who
come together to create energy efficient, healthy schools. As important, these are schools
where students learn a lifelong concern for the environment.
For past winners and achievement criteria, click here.DROPOUT PREVENTION
REWARDS
AND RECOVERY SCHOOLS 31
AND RECOGNITIONEachChildOurFuture
Ohio School Report Cards
(877) 644-6338 | reportcard.education.ohio.gov | accountability@education.ohio.gov
Follow us on:You can also read