Estimates of the Cost of Federal Credit Programs in 2021
←
→
Page content transcription
If your browser does not render page correctly, please read the page content below
April 2020

                           Estimates of the Cost of Federal
                              Credit Programs in 2021

Summary                                                               • The guarantees that Fannie Mae and Freddie Mac
The federal government supports some private activities                  are projected to make in 2021, analyzed on a
by offering credit assistance to individuals and busi-                   FCRA basis, would save the federal government
nesses. That assistance is provided through direct loans                 $28.5 billion. Under fair-value accounting, however,
and guarantees of loans made by private financial insti-                 the guarantees would cost $1.1 billion.
tutions. In this report, the Congressional Budget Office
estimates the lifetime costs of new loans and loan guar-              • The Department of Education’s student loan
antees that are projected to be issued in 2021. The report               programs are projected to save $3.2 billion on a
shows two kinds of estimates: those that were created                    FCRA basis but to cost $16.9 billion on a fair-value
by following procedures currently used in the federal                    basis.
budget, as prescribed by the Federal Credit Reform Act
of 1990 (FCRA); and those that account for the market                 • The Department of Housing and Urban
value of the government’s obligations, which are called                  Development’s (HUD’s) loan and loan guarantee
fair-value estimates. Most of the FCRA estimates were                    programs are projected to save $10.5 billion on a
produced by other federal agencies, although CBO used                    FCRA basis but to cost $7.4 billion on a fair-value
FCRA procedures to estimate the budgetary effects of the                 basis.
largest federal credit programs. The fair-value estimates
were produced by CBO.                                                 Federal Credit Programs
                                                                      For this report, CBO analyzed the 89 programs through
Using FCRA procedures, CBO estimates that new loans                   which the federal government provides credit assistance.
and loan guarantees issued in 2021 would result in sav-               The total amount of federal credit assistance projected
ings of $41.8 billion. But using the fair-value approach,             for 2021 is $1.5 trillion, consisting of new direct loans
CBO estimates that those loans and guarantees                         that total $154 billion and new loan guarantees that
would have a lifetime cost of $46.8 billion. More than                cover $1.4 trillion in loans. Just a few programs are pro-
three-quarters of the difference between those amounts is             jected to provide about 90 percent of total federal credit
attributable to three sources:                                        assistance—specifically, the programs offering mortgage
                                                                      guarantees and student loans. The largest federal credit
                                                                      programs by far are the guarantees of mortgage-backed

Notes: Unless this report indicates otherwise, all years referred to are federal fiscal years, which run from October 1 to September 30
and are designated by the calendar year in which they end. Numbers in the text, table, and figure may not add up to totals because
of rounding. For the most part, this report uses the names for departments, agencies, and programs that are given in the Office of
Management and Budget’s Federal Credit Supplement, which is available at www.whitehouse.gov/omb/supplemental-materials.
2 Estimates of the Cost of Federal Credit Programs in 2021 April 2020
securities provided by Fannie Mae and Freddie Mac. In projections of cash flows when it computed estimates
combination, those government-sponsored enterprises for this analysis. (CBO usually takes that same approach
(GSEs) are projected to provide $852 billion in new when preparing its baseline budget projections, analyz-
guarantees in 2021. ing the President’s budget proposals, or analyzing other
spending proposals.)3
Discretionary programs, which are funded through
annual appropriation acts, accounted for 71 of the The FCRA and Fair-Value Approaches
89 programs analyzed and 26 percent of the projected In the analysis underlying this report, CBO estimated
dollar value of loans and guarantees. The largest discre- the lifetime cost of federal credit programs using two
tionary programs are the mortgage programs adminis- approaches. The first follows the procedures prescribed
tered by the Federal Housing Administration (FHA) and by FCRA, which the Office of Management and Budget
the Department of Agriculture’s Rural Housing Service currently uses for most credit programs in the federal
(RHS), the transportation loans provided by the Federal budget. The second, called the fair-value approach, esti-
Highway Administration, the small-business loans pro- mates the market value of the government’s obligations
vided by the Small Business Administration (SBA), and by accounting for market risk. Market risk is the com-
the long-term guarantees provided by the Export-Import ponent of financial risk that remains even after investors
Bank. have diversified their portfolios as much as possible; it
arises from shifts in macroeconomic conditions, such
The remaining 18 programs are mandatory programs; as productivity and employment, and from changes in
that is, lawmakers determine spending for them by expectations about future macroeconomic conditions.4
setting eligibility rules and other criteria in authorizing Investors demand additional compensation for taking
legislation, rather than by appropriating specific amounts on market risk—additional, that is, in comparison with
each year. The largest of the mandatory programs the expected return from Treasury securities, which are
analyzed are Fannie Mae’s and Freddie Mac’s guaran- regarded as risk free. That additional compensation is
tees of mortgage-backed securities, the Department of called the risk premium.
Education’s student loan programs, and the mortgage
guarantee program administered by the Department of A common method for estimating the fair value of a
Veterans Affairs (VA). direct loan or loan guarantee is to discount the projected
cash flows to the present by using market-based discount
To compute the estimates in this analysis, CBO used its rates. The present value expresses the flows of current and
own projections of the volume of loans and cash flows future income or payments in terms of a single number.
for the largest credit programs.1 Specifically, the agency That number, in turn, depends on the discount rate, or
used its own estimates for Fannie Mae and Freddie Mac, rate of interest, that is used to translate future cash flows
the FHA’s single-family mortgage and reverse mortgage into current dollars. For FCRA estimates, the discount
guarantee programs, VA’s mortgage guarantee program, rates used are the projected yields on Treasury securities
and the Department of Education’s student loan pro- of corresponding maturities. The fair-value estimates
grams. Those estimates are a routine part of CBO’s base- employ discounting methods that are consistent with
line budget projections because they have the potential the way the loan or loan guarantee would be priced in a
for significant budgetary impact.2 For smaller federal competitive market. The difference between the FCRA
credit programs, CBO relied on other federal agencies’ and fair-value discount rates can be interpreted as a risk
premium. In general, the cost of a direct loan or a loan
1. The projections of loan volume and cash flow in this report guarantee reported in the federal budget under FCRA
reflect legislation, administrative actions, and regulatory changes procedures would be lower than the fair-value cost that
through March 6, 2020. They are based on the economic
forecast that the Congressional Budget Office completed on
January 7, 2020, and do not account for changes to the nation’s 3. For discretionary programs, the projections of cash flows by other
economic outlook and fiscal situation arising from the recent and agencies reflect the Administration’s proposed funding for 2021.
rapidly evolving public health emergency related to the novel In total, they are similar to estimates that CBO would prepare on
coronavirus. the basis of its baseline projections.
2. Those baseline projections, which CBO usually issues several 4. For further discussion, see Congressional Budget Office, How
times each year, incorporate the assumption that current laws CBO Produces Fair-Value Estimates of the Cost of Federal Credit
generally remain unchanged. Programs: A Primer (July 2018), www.cbo.gov/publication/53886.April 2020 Estimates of the Cost of Federal Credit Programs in 2021 3
private institutions would assign to similar credit assis- points higher. (The subsidy rate is the cost divided by
tance on the basis of market prices. the amount disbursed; a positive subsidy rate indicates
a government subsidy and therefore costs to the govern-
Both approaches are examples of accrual accounting— ment, and a negative rate indicates savings.)7 Specifically,
which, unlike cash accounting, records the estimated the average subsidy rate, weighted by the amount of the
present value of credit programs’ expenses and related programs’ credit, is −2.7 percent on a FCRA basis but
receipts when the legal obligation is first made rather 3.0 percent on a fair-value basis.
than when subsequent cash transactions occur.5 In
CBO’s view, fair-value estimates are a more comprehen- However, the amount by which fair-value subsidy rates
sive measure than FCRA estimates of the costs of federal exceed FCRA subsidy rates varies considerably. The
credit programs and therefore help lawmakers better largest difference, about 21 percentage points, is for
understand the advantages and drawbacks of various student loans, reflecting the high degree of market risk in
policies. that type of lending. For lending programs subject to less
market risk, the difference is much smaller—for instance,
CBO has nevertheless included FCRA estimates in this 4.1 percentage points for housing and real estate loans.
analysis. Because the cash flows underlying FCRA and
fair-value estimates are the same, a comparison of the Nearly a quarter of the difference between the overall
two kinds of estimates highlights the effect of market savings calculated under the FCRA approach and the
risk. costs calculated under the fair-value approach derives
from the valuation of student loans. Under FCRA proce-
Projected Costs of Federal Credit Programs dures, those loans generate larger budgetary savings per
Under Both Approaches dollar lent than most other federal credit assistance does;
Using FCRA procedures, CBO estimates that $1.5 tril- under the fair-value approach, most of those savings
lion in new loans and loan guarantees issued by the become costs.
federal government in 2021 would generate budgetary
savings of $41.8 billion over their lifetime—thereby Although most programs that have a negative subsidy
reducing the deficit (see Table 1). Using fair-value pro- rate under FCRA procedures have a positive subsidy rate
cedures, CBO estimates that those loans and guarantees under the fair-value approach, some subsidy rates are
would have a lifetime cost of $46.8 billion—thereby estimated to be negative under the fair-value approach.
adding to the deficit.6 That is the case for the Department of Education’s PLUS
loan program for parents, the Export-Import Bank’s
For every program that CBO analyzed, the projected long-term guarantees, and several smaller programs.
fair-value subsidy rate is higher than the projected In principle, such programs should be rare, because a
FCRA subsidy rate—on average, about 5.7 percentage negative fair-value subsidy rate should represent a prof-
itable opportunity for a private financial institution to
5. For further discussion, see Congressional Budget Office, Cash provide credit on the same or better terms. But negative
and Accrual Measures in Federal Budgeting (January 2018), fair-value subsidy rates could arise, for instance, if there
www.cbo.gov/publication/53461. were barriers to entry—such as the need for private
6. CBO considers Fannie Mae and Freddie Mac, which have been lenders to incur large fixed costs to enter a particular
in federal conservatorship since September 2008, to be federally
owned and controlled. Consequently, when preparing its baseline 7. The budgetary cost is the product of the subsidy rate and the size
budget projections, CBO treats their loan guarantees as federal of the commitment or obligation, so programs with high subsidy
commitments and accounts for them on a fair-value basis. In rates are not necessarily those with the largest total budgetary
contrast, the Office of Management and Budget (OMB) treats impact. For example, under FCRA, the Federal Emergency
those entities as private companies, and in the federal budget, it Management Agency’s Community Disaster Loan Program has
generally displays the cash transactions between them and the the highest subsidy rate (76.3 percent) and a budgetary cost of
Treasury. See Congressional Budget Office, Accounting for Fannie only $36 million. And the Department of Education’s subsidized
Mae and Freddie Mac in the Federal Budget (September 2018), Stafford loan program—which is projected to cost $1.8 billion,
www.cbo.gov/publication/54475. For other credit programs more than any other credit program—has a much smaller subsidy
analyzed in this report, both CBO and OMB account for rate of 9.2 percent.
budgetary costs on the basis of what is prescribed by the Federal
Credit Reform Act of 1990 (FCRA).4 Estimates of the Cost of Federal Credit Programs in 2021 April 2020
Table 1 .
Projected Costs or Savings From Federal Credit Programs in 2021
Subsidy Rate (Percent) Subsidy (Billions of dollars)
Obligations or
Commitments
Number of (Billions of Fair-Value Fair-Value
Programs dollars) FCRA Estimate Estimate FCRA Estimate Estimate
By Lending Category
Housing and Real Estate Loans 26 1,304 -2.9 1.2 -37.6 15.6
Commercial Loans 54 138 -0.8 10.1 -1.1 14.0
Student Loans 6 96 -3.3 17.6 -3.2 16.9
Consumer Loans 3 1 9.0 25.3 0.1 0.3
All Lending Categories 89 1,539 -2.7 3.0 -41.8 46.8
By Department or Agency
Fannie Mae and Freddie Mac 1 852 -3.3 0.1 -28.5 1.1
Housing and Urban Development 16 250 -4.2 3.0 -10.5 7.4
Veterans Affairs 5 181 0.9 3.4 1.7 6.2
Education 7 96 -3.3 17.6 -3.2 16.9
Agriculture 30 45 -0.6 3.8 -0.3 1.7
Small Business Administration 7 44 0.2 10.8 0.1 4.7
Transportation 2 33 0.9 23.7 0.3 7.7
Export-Import Bank 4 20 -5.2 -1.5 -1.0 -0.3
International Assistance 10 15 -2.8 4.3 -0.4 0.6
Othera 7 2 2.0 21.9 * 0.5
All Departments and Agencies 89 1,539 -2.7 3.0 -41.8 46.8
Sources: Congressional Budget Office; Office of Management and Budget.
The subsidy rate is the cost divided by the amount disbursed; a positive subsidy rate indicates a government subsidy and therefore costs to the
government, and a negative rate indicates savings.
For discretionary programs, the projections of cash flows by other agencies reflect the Administration’s proposed funding for 2021. In total, they are
similar to estimates that CBO would prepare on the basis of its baseline projections.
Most of the obligations, commitments, and FCRA estimates shown are from the Office of Management and Budget. The exceptions are student
loans, which are administered by the Department of Education, and programs related to single-family mortgages administered by Fannie Mae,
Freddie Mac, the Department of Veterans Affairs (VA), and the Federal Housing Administration (FHA) within the Department of Housing and Urban
Development; those estimates were made by CBO. These budget projections reflect legislation, administrative actions, and regulatory changes through
March 6, 2020. They are based on the economic forecast that CBO completed on January 7, 2020, and do not account for changes to the nation’s
economic outlook and fiscal situation arising from the recent and rapidly evolving public health emergency related to the novel coronavirus.
The table excludes guarantees provided through Ginnie Mae and the secondary market guarantees provided by the Small Business Administration
(SBA) for its estimate of total credit assistance because those guarantees are incremental guarantees of loans already included in the totals for loans
guaranteed by the FHA, the SBA, and VA.
The table excludes consolidation loans administered by the Department of Education.
FCRA = Federal Credit Reform Act of 1990; * = between -$500 million and $500 million.
a. Includes the Departments of Commerce, Health and Human Services, Homeland Security, State, and the Treasury, as well as the Environmental
Protection Agency.
credit market—or if the profit opportunity was expected private-sector competitors. A negative fair-value subsidy
to be short-lived. Furthermore, in some cases, such as rate could also stem from particular factors in CBO’s
for student loans, the federal government has tools to calculations, such as an underestimate of the appropriate
collect from delinquent borrowers that private lenders risk premium because of a lack of good market proxies
do not have, giving federal programs an advantage overApril 2020 Estimates of the Cost of Federal Credit Programs in 2021 5
or an understatement of true cost because administrative Mae, which is part of HUD) for securities that are
costs are not included in the calculation. themselves backed by federally guaranteed mortgages,
including mortgages guaranteed by the FHA and VA.
On a FCRA basis, discretionary programs (considered CBO projects that guarantees provided through Ginnie
together) are projected to save $11.8 billion and manda- Mae would amount to $424 billion in 2021. However,
tory programs $29.9 billion. On a fair-value basis, discre- CBO has excluded them from its estimate of total credit
tionary programs are projected to cost $22.3 billion assistance because they are incremental guarantees on
and mandatory programs $24.5 billion. Of the 71 dis- loans already included in the totals for loans guaranteed
cretionary credit programs, 47 have a subsidy rate that by the FHA, VA, and other federal housing guarantors.
is estimated to be zero or negative on a FCRA basis in CBO estimates that the fair-value subsidy rate for Ginnie
2021. Of those, CBO estimates that 35 programs have Mae is effectively zero.
costs (that is, positive subsidy rates) under the fair-value
approach.8 Projected Subsidies. Calculated on a FCRA basis, the
average subsidy rate for housing and real estate programs
Projected Costs of Particular Programs in 2021 is −2.9 percent, and the lifetime budgetary
Under Both Approaches savings are projected to be $37.6 billion.9 Subsidy rates
For ease of reference, CBO has divided the loans and vary considerably among the individual housing and real
loans guarantees that it analyzed into four categories: estate programs, from −22.5 percent for VA’s Vendee
housing and real estate loans, student loans, commercial Direct Loans program to 6.4 percent for HUD’s Title VI
loans, and consumer loans. Indian Federal Guarantees Program.
Housing and Real Estate Loans Calculated on a fair-value basis, the average subsidy rate
In CBO’s projections, most of the federal government’s for housing and real estate programs in 2021 is 1.2 per-
credit assistance in 2021 is provided by Fannie Mae and cent, and the lifetime cost is projected to be $15.6 bil-
Freddie Mac ($852 billion). Those GSEs primarily buy lion. The difference in budgetary impact between the
mortgages from lenders and pool the mortgages to create FCRA and fair-value estimates is thus $53.2 billion (see
mortgage-backed securities, which they guarantee against Figure 1).10
default and sell to investors. Because the GSEs are cur-
rently in federal conservatorship, CBO regards those loan CBO also examined how sensitive those fair-value esti-
guarantees as governmental activities; the Administration mates were to a variation of plus or minus 10 percent in
does not. Other housing and real estate programs include the estimated risk premium.11 The resulting cost ranged
mortgage guarantees provided by HUD ($250 bil- from $10.7 billion to $20.5 billion, and the fair-value
lion), VA ($181 billion), and RHS ($20 billion). Of
the $250 billion of credit assistance provided by HUD,
$230 billion is attributable to guarantees of single-family 9. Those estimates include the FCRA estimate of the budgetary
costs of loan guarantees made by Fannie Mae and Freddie Mac.
mortgages provided through the FHA, which is located
Excluding those guarantees, the average subsidy rate for other
within that department. housing and real estate loans equals -2.0 percent, and the lifetime
budgetary savings are projected to be $9.2 billion.
All told, the federal government’s credit assistance in
10. When making its baseline projections, CBO estimates the cost
the form of housing and real estate loans is projected to of loan guarantees made by Fannie Mae and Freddie Mac on a
equal $1.3 trillion in 2021, accounting for 85 percent of fair-value basis, whereas for other housing and real estate credit
the $1.5 trillion total. If the GSEs are excluded from that programs, CBO follows the procedures prescribed by FCRA.
calculation, federal credit assistance in this category is Excluding Fannie Mae and Freddie Mac, on a fair-value basis
projected to equal $452 billion in 2021, accounting for the average subsidy rate for other housing and real estate loans
equals 3.2 percent and the estimated cost of housing and real
66 percent of a smaller total ($687 billion). estate credit programs is $14.5 billion, resulting in a difference in
budgetary impact equal to $23.6 billion between the FCRA and
The federal government also provides guarantees through fair-value estimates.
the Government National Mortgage Association (Ginnie 11. CBO used 10 percent differences partly because most annual
shifts in the risk premium for stocks are smaller than 10 percent;
8. In this analysis, a subsidy rate was deemed to be zero if it fell differences amounting to 20 percent would have larger effects
between −0.1 percent and 0.1 percent. See the spreadsheet posted than those reported here, although those differences would not
with this report at www.cbo.gov/publication/56285. necessarily be twice as large.6 Estimates of the Cost of Federal Credit Programs in 2021 April 2020
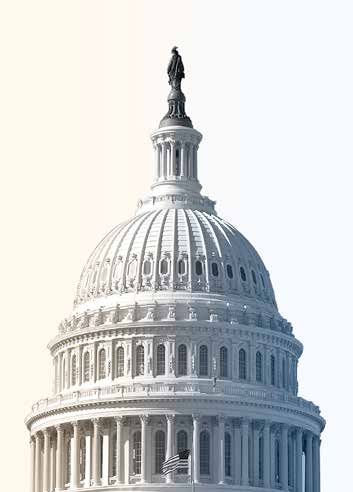
Figure 1 .
Differences Between FCRA and Fair-Value Estimates of Subsidies in 2021
Billions of Dollars
By Lending Category
FCRA Fair-Value
Estimate Estimate Difference
Housing and Real Estate Loans Housing and
-37.6Real Estate
15.6
Loans 53.2
Student Loans -3.2 Student
16.9
Loans 20.1
Commercial Loans -1.1 14.0
Commercial Loans 15.1
Consumer Loans 0.1Consumer0.3
Loans 0.2
Total -41.8 46.8Total 88.6
0 20 40 60 80 100
By Department or Agency
FCRA Fair-Value
Estimate Estimate Difference
Fannie Mae and Freddie Mac -28.5
Fannie 1.1Mac
Mae & Freddie 29.6
Education -3.2 Education
16.6 20.1
Housing and-10.5
Housing and Urban Development Urban Development
7.4 17.9
Transportation 0.3 Transportation
7.7 7.4
Small Business Administration Small Business
0.1 Administration
4.7 4.6
Veterans Affairs 1.7 Veterans6.2
Affairs 4.6
Agriculture -0.3 Agriculture
1.7 2.0
International Assistance International
-0.4 Assistance
0.6 1.1
Export−Import Bank Export−Import
-1.0 -0.3Bank 0.7
Othera * Other
0.5 0.5
Total -41.8 46.8Total 88.6
0 20 40 60 80 100
Sources: Congressional Budget Office; Office of Management and Budget.
For discretionary programs, the projections of cash flows by other agencies reflect the Administration’s proposed funding for 2021. In total, they are
similar to estimates that CBO would prepare on the basis of its baseline projections.
Most of the obligations, commitments, and FCRA estimates shown are from the Office of Management and Budget. The exceptions are student
loans, which are administered by the Department of Education, and programs related to single-family mortgages administered by Fannie Mae,
Freddie Mac, the Department of Veterans Affairs (VA), and the Federal Housing Administration (FHA) within the Department of Housing and Urban
Development; those estimates were made by CBO. These budget projections reflect legislation, administrative actions, and regulatory changes through
March 6, 2020. They are based on the economic forecast that CBO completed on January 7, 2020, and do not account for changes to the nation’s
economic outlook and fiscal situation arising from the recent and rapidly evolving public health emergency related to the novel coronavirus.
The figure excludes guarantees provided through Ginnie Mae and the secondary market guarantees provided by the Small Business Administration
(SBA) for its estimate of total credit assistance because those guarantees are incremental guarantees of loans already included in the totals for loans
guaranteed by the FHA, the SBA, and VA.
The figure excludes consolidation loans administered by the Department of Education.
FCRA = Federal Credit Reform Act of 1990; * = between -$500 million and $500 million.
a. Includes the Departments of Commerce, Health and Human Services, Homeland Security, State, and the Treasury, as well as the Environmental
Protection Agency.April 2020 Estimates of the Cost of Federal Credit Programs in 2021 7
subsidy rate varied by plus or minus 0.4 percentage student loan programs in 2021 is −3.3 percent, and the
points from the central estimate of 1.2 percent. lifetime budgetary savings are projected to be $3.2 bil-
lion. However, subsidy rates vary considerably among the
Changes Since Last Year. The average subsidy rate for individual programs, from −31.8 percent for the PLUS
credit assistance for housing and real estate, exclud- loan program for parents to 9.2 percent for the subsi-
ing what is provided through the GSEs, is projected dized Stafford loan program. In CBO’s assessment, the
to decrease by 0.3 percentage points on a FCRA basis difference is explained by five key factors:
and to increase by 0.6 percentage points on a fair-value
basis from 2020 to 2021. Including the GSEs’ loan • The interest rate is 4.1 percent in the subsidized
guarantees, the subsidy rate is projected to decrease by Stafford loan program but 6.7 percent in the PLUS
0.8 percentage points on a FCRA basis and to increase loan program for parents.
by 0.2 percentage points on a fair-value basis.
• The subsidized Stafford loans accrue no interest while
The budgetary cost for the GSEs’ mortgage guarantees the borrower is enrolled in school at least half time or
and the FHA’s single-family mortgage guarantee program during other periods of deferment, whereas the PLUS
is projected to decrease by $12.2 billion on a FCRA basis loans for parents begin to accrue interest immediately
between 2020 and 2021, even though the amount of after origination.13
credit assistance is projected to increase. The decrease in
cost is driven by changes in CBO’s forecast of interest • Borrowers of subsidized Stafford loans are eligible
rates, which generated a small decrease in the expected for all income-driven repayment (IDR) plans, the
costs of default (net of recoveries) and a larger increase most generous of which require annual payments of
in the value of guarantee fees collected.12 A $223 million 10 percent of the borrowers’ discretionary income
decrease in the projected cost of the FHA’s reverse mort- and forgive outstanding balances after 20 years.
gage guarantee program on a FCRA basis is also driven The balances of PLUS loans to parents can be
by changes in CBO’s macroeconomic forecast. For that consolidated to make them eligible for repayment
program, both stronger growth in house prices and lower through a less generous IDR plan, which requires
interest rates decreased the cost of the FHA’s guarantee. annual payments of 20 percent of discretionary
income and forgives outstanding balances after
The budgetary cost for VA’s home loan guarantees 25 years.
increased by $3.3 billion on a fair-value basis between
2020 and 2021. That increase was the result of an • The estimated default rate is 22.4 percent for
increase in both the projected amount of credit assistance subsidized Stafford loans but 12.2 percent for PLUS
and the expected costs of default (net of recoveries) for loans for parents.
those guarantees.
• The origination fee is 1 percent for subsidized
Student Loans Stafford loans but 4 percent for PLUS loans for
The Department of Education’s student loan programs parents.
are subsidized Stafford loans (which are available to
undergraduate students), unsubsidized Stafford loans Calculated on a fair-value basis, the average subsidy rate
(which are available to undergraduate and graduate stu- for the student loan programs in 2021 is 17.6 percent,
dents), and PLUS loans (which are available to parents and the lifetime cost is projected to be $16.9 billion. The
and to graduate students). Those programs are projected difference in budgetary impact between the FCRA and
to account for $96 billion of federal credit in 2021. fair-value estimates is thus $20.1 billion. Subsidy rates
differ substantially among the individual programs, from
Projected Subsidies. Calculated on a FCRA basis, the −10.7 percent for the PLUS loan program for parents to
average subsidy rate for the Department of Education’s 27.4 percent for the subsidized Stafford loan program.
12. The new interest rate forecast reduces the projected volume of
mortgages that are expected to be repaid early, which increases 13. Under deferment, a borrower may temporarily stop making
the present value of fees collected on the guarantees offered by payments on a student loan, usually without interest accruing on
the GSEs and the FHA. the balance.8 Estimates of the Cost of Federal Credit Programs in 2021 April 2020
The fair-value subsidy rates remained fairly stable when estimates that the fair-value subsidy rate for those guar-
CBO used risk premiums that were higher or lower by antees is effectively zero.
10 percent. The resulting cost ranged from $15.7 billion
to $18.1 billion, and the fair-value subsidy rate varied Projected Subsidies. Calculated on a FCRA basis, the
by plus or minus 1.2 percentage points from the central average subsidy rate for commercial loan programs in
estimate of 17.6 percent. 2021 is −0.8 percent, and the lifetime budgetary savings
are projected to be $1.1 billion. Most of the commercial
Changes Since Last Year. Calculated on a FCRA basis, loan programs have a subsidy rate that is zero or nega-
the average subsidy rate for student loans is projected to tive, and those programs are projected to save the federal
increase by 0.7 percentage points, from −4.0 percent in government $1.8 billion. Of those savings, more than
2020 to −3.3 percent in 2021, resulting in a projected 80 percent is attributable to the Export-Import Bank’s
decrease in budgetary savings of $936 million. However, long-term guarantees, the International Development
changes in subsidy rates varied for individual programs, Finance Corporation’s loan guarantees and direct loans,
from an increase of 9.6 percentage points ($1.2 billion) and the Farm Service Agency’s farm ownership direct
for the PLUS loan program for graduate students to a loan program.
decrease of 3.1 percentage points ($869 million) for the
subsidized Stafford loan program. Most of the changes Calculated on a fair-value basis, the average subsidy
to CBO’s subsidy rates are explained by changes made rate for commercial loan programs in 2021 is 10.1 per-
to estimates of participation in the Public Service Loan cent, and the lifetime cost is projected to be $14.0 bil-
Forgiveness Program, projections of income for borrow- lion. The difference in budgetary impact between the
ers in IDR plans, and the distribution of participation FCRA and fair-value estimates is thus $15.1 billion.
among the various IDR plans for the 2021 cohort of About 85 percent of the projected cost results from
borrowers, which differ from the projections made for four programs: direct loans made by the Department of
the 2020 cohort last year. Transportation under the Transportation Infrastructure
Finance and Innovation Act (TIFIA; $7.6 billion), the
Calculated on a fair-value basis, the average subsidy SBA’s 7(a) loan guarantees for small businesses ($3.0 bil-
rate for student loans is projected to rise by 0.2 per- lion), the SBA’s Section 504 loan program for Certified
centage points (from 17.3 percent to 17.6 percent), and Development Companies ($897 million), and the SBA’s
the cost of those programs is projected to decrease by SBIC Debentures program ($477 million).
$745 million. The risk premiums for all student loan
programs are projected to remain fairly stable from 2020 When CBO varied the risk premiums for commercial
to 2021, and therefore the change in each program’s loans by 10 percent, the resulting cost ranged from
fair-value subsidy rate is entirely attributable to the same $13.4 billion to $14.6 billion. Similarly, the fair-value
changes in CBO’s estimates of defaults, collections, subsidy rate varied by plus or minus 0.4 percentage
repayments, and interest rates that affect the change in points from the central estimate of 10.1 percent.
each program’s FCRA subsidy rate.
Changes Since Last Year. Calculated on a FCRA basis,
Commercial Loans the average subsidy rate for commercial loans is projected
The federal government provides assistance to commer- to increase from −1.0 percent in 2020 to −0.8 percent
cial entities—that is, businesses—in the form of direct in 2021; the estimated budgetary savings increase by
loans and guarantees. That assistance is projected to $22 million. Calculated on a fair-value basis, the aver-
total $138 billion in 2021. Most of it would be pro- age subsidy rate for commercial loans is projected to
vided through the SBA ($43 billion), the Department increase from 6.4 percent in 2020 to 10.1 percent in
of Transportation ($33 billion), and the Department 2021, increasing the projected cost of those programs by
of Agriculture ($25 billion). The SBA also guarantees $7.3 billion.
securities that are themselves backed by federally guaran-
teed loans. However, CBO has excluded those guarantees The change in both the FCRA and fair-value subsidies
from its estimate of total credit assistance because they for commercial loans is mainly driven by a proposed
are incremental guarantees on loans already included increase of $27.8 billion in credit obligations for direct
in the totals for loans guaranteed by the SBA. CBO loans made by the Department of Transportation underApril 2020 Estimates of the Cost of Federal Credit Programs in 2021 9
TIFIA, partly offset by lower subsidy rates for the TIFIA When CBO varied the risk premium for consumer loans
program. The increase in credit obligations raised their by 10 percent, the resulting cost ranged from $264 mil-
budgetary cost by $269 million on a FCRA basis and lion to $294 billion, and the fair-value subsidy rate
$6.6 billion on a fair-value basis. However, those effects varied by plus or minus 1.4 percentage points from the
were partly offset by a 4.8 percent decline in the subsidy central estimate of 25.3 percent.
rate on a FCRA basis (a reduction of $201 million in
subsidy costs) and a 4.0 percent decline on a fair-value Changes Since Last Year. Calculated on a FCRA basis,
basis (a reduction of $168 million in subsidy costs). the subsidy rate for the SBA’s disaster assistance loans
In all, TIFIA subsidies’ budgetary cost increased by program decreased by 4.7 percentage points from 2020
$68 million on a FCRA basis and $6.5 billion on a fair- to 2021, decreasing budgetary costs by $52 million.
value basis. Calculated on a fair-value basis, the subsidy rate is
expected to decrease by 2.8 percentage points, decreasing
Consumer Loans costs by $31 million. The change in both the FCRA and
The federal government provides loans or loan guar- fair-value estimates is driven by a 2.3 percentage-point
antees to individual borrowers; in 2021, such credit decrease in the projected default rate (net of recoveries)
assistance is projected to total $1.1 billion. The SBA’s for that program.
disaster assistance loans account for almost all of that
total ($1.1 billion); two smaller programs account for Differences From CBO’s Baseline Projections
just $4 million. In most cases, those loans and guarantees CBO regularly projects loan volume and cash flows for
are secured only by the borrower’s income and not by the the largest credit programs, including the Department
borrower’s other assets, which increases the amount of of Education’s student loan programs, Fannie Mae’s and
market risk. Freddie Mac’s guarantees of mortgage-backed securities,
the FHA’s single-family and reverse mortgage guarantee
Projected Subsidies. Calculated on a FCRA basis, the programs, and VA’s mortgage guarantee program. Those
average subsidy rate for consumer loans in 2021 is programs account for more than 90 percent of total
9.0 percent, and the lifetime budgetary cost is projected federal credit assistance.
to be $99 million. The SBA’s disaster assistance loans
account for $98 million of that total; only two smaller For smaller federal credit programs, which are mostly
programs fall into the category of consumer loans. Of funded by discretionary appropriations, CBO generally
the four categories that CBO has described in this analy- projects that, under current law, subsidy costs would
sis, credit assistance to consumers is the only one that grow with inflation. That is the same approach used for
has a positive subsidy rate when analyzed under FCRA all other discretionary appropriations. Because CBO
procedures. does not generate estimated cash flows for those smaller
credit programs, the agency relied on cash flow esti-
Calculated on a fair-value basis, the average subsidy rate mates prepared by the Administration as the basis for
for consumer loans in 2021 is 25.3 percent, and the life- the subsidy estimates for those programs in this report.
time cost is projected to be $279 million. The difference Nevertheless, in aggregate, CBO’s baseline projections
in budgetary impact between the FCRA and fair-value for federal credit programs are similar to those produced
estimates is thus $180 million. for this report using FCRA procedures.14
The difference between the FCRA and fair-value subsidy
rates for consumer loans is the second largest in the four
categories, after the difference for student loans. One 14. The Department of Transportation’s TIFIA program is a case in
reason is that the SBA’s disaster assistance loans have a which CBO’s baseline differs substantially from the estimates in
large risk premium, reflecting the high default rate and this report. The Federal-Aid Highway Program includes several
riskiness of the loans; that large risk premium drives up grant programs and the TIFIA loan program, which together
the fair-value subsidy rate. Another reason is that those receive funds in a single appropriation; CBO does not separately
estimate what will be allocated to TIFIA. The President’s budget
loans mature after 25 years, which also pushes up the
proposes to separate TIFIA into its own program account and to
fair-value subsidy rate. significantly increase its funding.10 Estimates of the Cost of Federal Credit Programs in 2021 April 2020
This document, which is part of the Congressional Budget Office’s continuing effort to make its work transparent, provides
Members of Congress, their staff, and others with information about the cost of federal credit programs under two methods:
the methods specified in the Federal Credit reform Act of 1990, which apply to most federal credit programs, and methods
based on the fair-value approach, which incorporates market risk. in keeping with CBO’s mandate to provide objective,
impartial analysis, the report makes no recommendations.
Wendy Kiska wrote the report with assistance from Michael Falkenheim, paul Holland, Justin Humphrey, David Newman,
robert reese, Mitchell remy, and Aurora Swanson and with guidance from Sebastien Gay. Delaney Smith and
David Torregrosa fact-checked the report.
Jeffrey Kling and robert Sunshine reviewed the report, Elizabeth Schwinn was the editor, and robert rebach was
the graphics editor. An electronic version of this annual report and supplemental data are available on CBO’s website
(www.cbo.gov/publication/56285). previous editions are available at https://go.usa.gov/xmyen.
CBO continually seeks feedback to make its work as useful as possible. please send any comments to communications@cbo.gov.
Phillip L. Swagel
DirectorYou can also read