Regional Municipality of Durham - Pre-Sort / Transfer & Organics Management Preliminary Business Case Financial Analysis - Region of Durham
←
→
Page content transcription
If your browser does not render page correctly, please read the page content below
Regional Municipality of
Durham
Pre-Sort / Transfer & Organics Management

Preliminary Business Case Financial Analysis

June 2017
Confidential

Table of contents
1.     Introduction ....................................................................................................................... 3
2.     Assessment Methodology .................................................................................................... 3
3.     Model Outputs .................................................................................................................... 4
   3.1     NPV Results ................................................................................................................. 4
   3.2     Incremental Analysis ..................................................................................................... 5
4.     Sensitivities ....................................................................................................................... 7
5.     Conclusion ....................................................................................................................... 10

Appendices
Appendix A.         Inputs and Assumptions ......................................................................................... 11

Regional Municipality of Durham – Preliminary Business Case Financial Analysis                                                              1
Confidential

Notice
Ernst & Young Orenda Corporate Finance Inc. (“EY”) and GHD limited (“GHD”) (collectively, the ”Consultants”) was
engaged by the Regional Municipality of Durham (the “Region” or “Clients”) to investigate the inclusion of mixed
waste processing and organics management of the Region’s waste streams.

This Report was prepared on the Client instructions solely for the purposes of the Client. It should not be relied upon
for any other purpose. The Report is based on objective analysis and information provided to us by the Client and
third parties and does not necessarily represent EY view, comments, conclusions and opinions.

The Report may not have considered issues relevant to all third parties. Any use such third parties may choose to
make of the Report is entirely at their own risk and we shall have no responsibility whatsoever in relation to any such
use and to the fullest extent permitted by law we do not accept or assume responsibility to anyone other than the
Clients for our work, for this report or for the opinions formed.

We have not undertaken any form of investigation, audit, substantiation or verification procedures for the
information, data and projections provided to us. We have not sought to verify the accuracy of the data or the
information and explanations provided.

Our work has been limited in time and a more detailed / lengthy exercise may reveal material issues that this review
has not. No obligation is assumed by EY to revise this Report to reflect any circumstances or information that
become available subsequent to the date of this Report.

Regional Municipality of Durham – Preliminary Business Case Financial Analysis                                       2
Confidential

1. Introduction
Ernst & Young Orenda Corporate Finance Inc. (“EY”) and GHD limited (“GHD”) (collectively, the
”Consultants”) in collaboration with the Regional Municipality of Durham (the “Region” or “Durham”),
conducted a financial analysis for the mixed waste pre-sorting and organics management project (the
“Project”). This report provides an overview of the methodology used to perform the financial analysis
and highlights the outcomes of the analysis.

2. Assessment Methodology
The Consultants developed a robust cash-flow financial model (the “Model”) to conduct a financial
analysis of the Project. This involved establishing a period by period cash-flow profile for each option
based on procuring the Project on a “like for like” basis (i.e. assuming consistent timeline, specifications,
performance standards etc.). The Model included the analysis of the following options:

    ►    Status quo option;
    ►    Pre-sort/merchant capacity option;
    ►    Pre-sort/in-vessel composting option; and
    ►    Pre-sort/anaerobic digestion option.

For each of the options, the Model calculated a cash-flow profile that was adjusted for the time value of
money by discounting them using an appropriate discount rate to provide a Net Present Value (“NPV”).

The NPV was calculated as the sum of the net present value of all the revenues and costs of the Project
during the construction and operation phases over the 20-year projection period.

The preliminary business case had been predicated on assessing organic processing system options in
addition to the status quo. In this context, the status quo was not considered viable, as it does not address
the study drivers and was, therefore, concluded to not be a go-forward option for the Region.

Each of the options include a mixed waste pre-sort facility and transfer station (pre-sort) to process the
mixed waste to harvest recyclables and organics. Three organics processing options were evaluated and
included merchant capacity, in-vessel aerobic composting and anaerobic digestion. Typical costs for the
design and construction of the in-vessel and anaerobic digestion options were utilized for the
assessment. An option was included to consider merchant capacity for SSO and organics from the mixed
waste pre-sort system.

The objective of the analysis was to compare forecasted net operating cash-flows between the pre-
sort/merchant capacity option, the Pre-sort/in-vessel composting option and the pre-sort/anaerobic
digestion option. Key assumptions used in the analysis are highlighted below. A detailed assumptions
table can be found in Appendix A.

    ► 20-year projection period
    ► Mixed waste pre-sort capacity based on 160,000 tonnes per year to reflect growth over time,
      with various levels of recovery of metals and hard plastics, and recovery of 80 percent of
      organics fraction from mixed waste
    ► 110,000 tonnes per year of organics processing to include existing and future SSO tonnages,
      and tonnages of the organics fraction from the mixed waste pre-sort system

Regional Municipality of Durham – Preliminary Business Case Financial Analysis                             3
Confidential

    ► Excess capacity at the organics facility sold and excess capacity created at the DYEC as a result
      of reduced volumes also sold
    ► No revenues from cap-and-trade funding or offsets, or from high-value biogas sales from
      anaerobic digestion systems
    ► Inflation and escalation for consumables and operating costs over time, and a 5 percent discount
      rate
    ► High and low capital and operating costs for mixed waste pre-sort, in-vessel anaerobic
      composting and anaerobic digestion systems were taken from costs noted for constructed
      facilities, and merchant capacity costs were estimated

3. Model Outputs
3.1 NPV Results
As highlighted above, the Model calculates the NPV of the current status quo and the three other options
with the objective to conduct a comparative analysis of the forecasted net operating cash-flows. High
and low estimates have been applied to the three options to provide a range for the total net operating
cash flow on a NPV basis. The net operating cash flow calculated on a nominal basis can be found in
Model.

Status Quo Option

The forecasted net operating cash flow for the status quo option is -$279 million on a NPV basis as shown
in the table below:

                    Option                                 Category                            NPV

                                                           Revenues                       $8,080,013.80

               Status quo option                        Operating costs                  -$287,448,516.83

                                                  Net operating cash flows               -$279,368,503.03

Pre-sort/Merchant Capacity Option

The forecasted net operating cash flows for the pre-sort/merchant capacity option range between
-$496 million and -$634 million as shown in the breakdown in the table below.

               Option                      Category                        Low (NPV)            High (NPV)

                                           Revenues                    $30,807,731.94         $30,807,731.94

                                      Construction costs               -$32,202,674.66        -$37,444,970.54
      Pre-sort/merchant
                                        Operating costs               -$493,311,839.60       -$625,478,339.52
       capacity option
                                        Ancillary costs                 -$1,646,282.14        -$1,646,282.14

                                   Net operating cash flows           -$496,353,064.46       -$633,761,860.26

Regional Municipality of Durham – Preliminary Business Case Financial Analysis                               4
Confidential
Pre-sort/In-Vessel Composting Option
The forecasted net operating cash flows for the pre-sort/in-vessel composting option range between
-$445 million and -$548 million as shown in the breakdown in the table below.
Option Category Low (NPV) High (NPV)
Revenues $81,950,216.27 $90,975,360.56
Construction costs -$100,071,683.76 -$173,182,988.73
Pre-sort/in-vessel
Operating costs -$423,877,333.43 -$463,154,277.00
composting option
Ancillary costs -$2,548,800.11 -$2,548,800.11
Net operating cash flows -$444,547,601.02 -$547,910,705.27
Pre-Sort/Anaerobic Digestion Option
The forecasted net operating cash flows for the pre-sort/anaerobic digestion option range between
-$446 million and -$555 million as shown in the breakdown in the table below.
Option Category Low (NPV) High (NPV)
Revenues $93,356,979.19 $102,382,123.49
Construction costs -$96,561,217.77 -$140,418,639.51
Pre-sort/anaerobic
Operating costs -$440,099,278.87 -$513,830,043.29
digestion option
Ancillary costs -$2,774,429.60 -$2,774,429.60
Net operating cash flows -$446,077,947.05 -$554,640,988.91
One of the key sensitivities that were tested on the pre-sort/anaerobic digestion option is to the impact
of the method of energy use on the net operating cash flows. Going from the biogas assumed in the base
case to electricity generation results in a net operating cash flows between -$416 million and -$525
million, which represents approximately $30 million net benefit on an NPV basis.
As demonstrated in the results above, all the options analysed require an increase in overall costs when
compared to the status quo option. As noted, however, the status quo option does not represent a viable
option going forward, as it does not fully address the Project’s key drivers and objectives.
3.2 Incremental Analysis
An incremental analysis was performed to illustrate the incremental cost/benefit of each option when
compared to the status quo option and the pre-sort/merchant capacity option.
The incremental analysis of the status quo option against the pre-sort/merchant capacity option, the
pre-sort/in-vessel option and the pre-sort/anaerobic digestion option shows the variances in revenues,
construction costs, operating costs, and ancillary costs. The following tables highlight the difference of
Regional Municipality of Durham – Preliminary Business Case Financial Analysis 5Confidential
moving from the status quo option to the other three options. The net operating cash flows are broken
out into their respective components and include both a low and high NPV.
Incremental analysis Category Low (NPV) High (NPV)
Incremental revenues $22,727,718 $22,727,718
Incremental construction
costs
-$32,202,675 -$37,444,971
Status quo and pre- Incremental operating
-$205,863,323 -$338,029,823
sort/merchant capacity costs
Incremental ancillary
-$1,646,282 -$1,646,282
costs
Incremental net
-$216,984,561 -$354,393,357
operating cash flows
Incremental revenues 73,870,202 82,895,347
Incremental construction
-$100,071,684 -$173,182,989
costs
Status quo and pre- Incremental operating
-$136,428,817 -$175,705,760
sort/in-vessel composting costs
Incremental ancillary
-$2,548,800 -$2,548,800
costs
Incremental net
-$165,179,098 -$268,542,202
operating cash flows
Incremental revenues 85,276,965 94,302,110
Incremental construction
-$96,561,218 -$140,418,640
costs
Status quo and pre-
Incremental operating
sort/anaerobic digestion -$152,650,762 -$226,381,526
costs
Incremental ancillary
-$2,774,430 -$2,774,430
costs
Incremental net
-$166,709,444 -$275,272,486
operating cash flows
Incremental analyses of the pre-sort/merchant capacity option against the pre-sort/in-vessel option and
the pre-sort/anaerobic option were also conducted but not included in this overview but can be found in
the Model.
Regional Municipality of Durham – Preliminary Business Case Financial Analysis 6Confidential
4. Sensitivities
The following sensitivities were run in the financial model to study the impact of the following on the NPV
of each option:
► Utilizing electricity in the pre-sort/anaerobic digestion option instead of biogas assumed in the
base case
► Using a discount rate of 3% versus the base case discount rate of 5%
► Using a discount rate of 7% versus the base case discount rate of 5%
► Increasing inflation rates by 1% including general inflation, operating inflation and revenue
escalation
► Decreasing inflation rates by 1%, including general inflation, operating inflation and revenue
escalation
► Excluding revenues from sale of excess capacity from in-vessel composting and anaerobic
digestion systems
► Applying a 2% decrease in growth to the tonnages
► Applying 60% organics recovery rate to the tonnages instead of the 80% assumed in the base
case
► Decreasing organic waste in the tonnages
► Decreasing organics and applying no revenues from excess capacity from in-vessel or anaerobic
digestion systems
The sensitivities were then ranked based on the degree of impact on the analysis. For each sensitivity
the option that was impacted the most was identified. The table below provides a summary of the
sensitivity analysis conducted.
Ranking of sensitivity by highest Option most impacted by
Sensitivity
impact on analysis sensitivity
Pre-sort/merchant capacity
Discount rate 3% 1
option
Pre-sort/merchant capacity
Discount rate 7% 2
option
Pre-sort/anaerobic digestion
Tonnages - 2% decreased growth 3
option
Pre-sort/merchant capacity
CPI + 1% 4
option
Pre-sort/merchant capacity
CPI - 1% 5
option
Pre-sort/anaerobic digestion
Electricity for anaerobic digestion 6
option
No revenues from excess capacity
Pre-sort/in-vessel composting
from in-vessel or anaerobic digestion 7
option
systems
Decreased organics + no rev from Pre-sort/anaerobic digestion
8
excess capacity sale option
Pre-sort/merchant capacity
Tonnages - 60% organics recovery 9
option
Pre-sort/merchant capacity
Tonnages - decreased organics 10
option
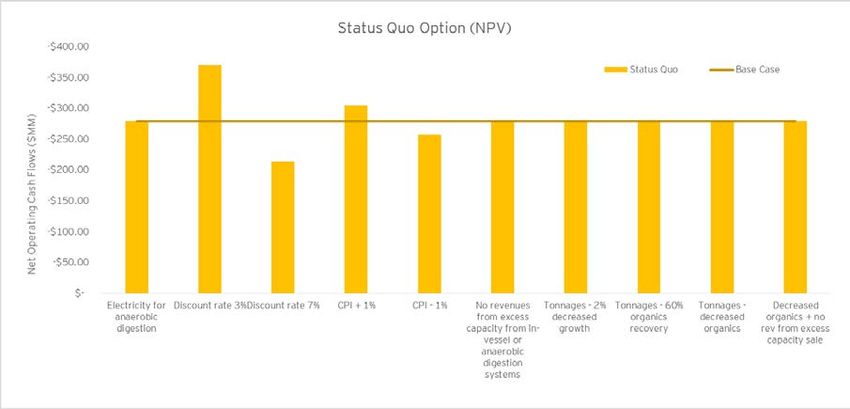
The following chart shows the results of the sensitivity analysis for the Status Quo option on a NPV basis.
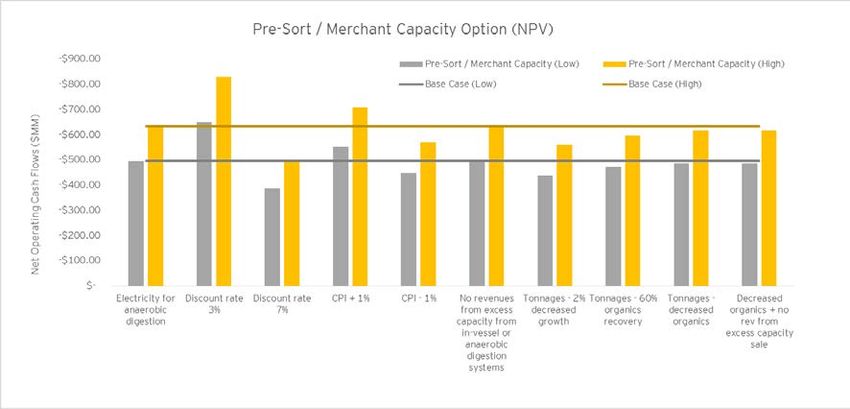
Regional Municipality of Durham – Preliminary Business Case Financial Analysis 7Confidential The line graph represents the NPV of the base case of the Status Quo Option. Each bar graph represents the NPV of the sensitivity described on the x-axis of the graph. It can be seen that the highest impacts to the status quo option result from changing the discount rate from 5% to 3% and 7%. The following chart shows the results of the sensitivity analysis for the pre-sort/merchant capacity option on a NPV basis. The line graphs represent the high and low NPV results of the base case of the pre- sort/merchant capacity option. The bar graphs represents the high and low NPV results of the sensitivities described on the x-axis of the graph. It can be seen that reducing the discount rate to 3% or increasing inflation by 1% results in an NPV higher than that of the base case for this option. All other sensitivities result in reduced cost of this option when compared to the base case. Regional Municipality of Durham – Preliminary Business Case Financial Analysis 8
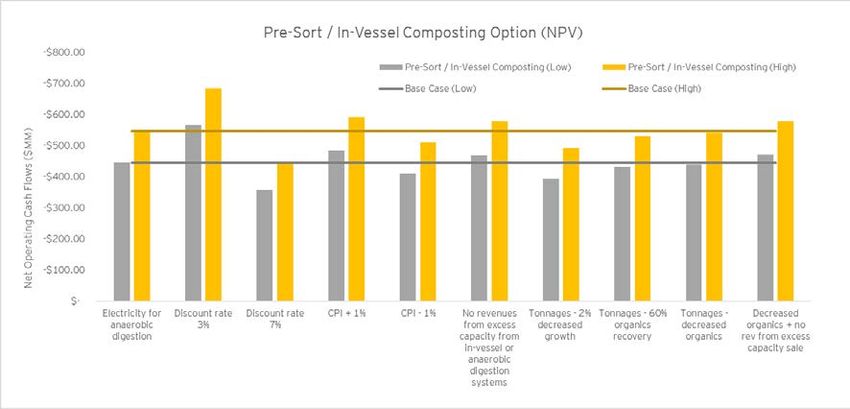
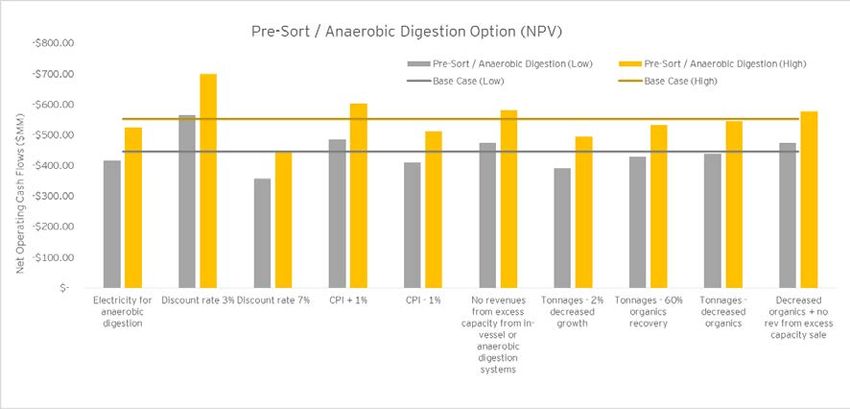
Confidential

The following chart shows the results of the sensitivity analysis for the pre-sort/in-vessel composting
option on a NPV basis. The line graphs represent the high and low NPV results of the base case of the
pre-sort/in-vessel composting option. The bar graphs represents the high and low NPV results of the
sensitivities described on the x-axis of the graph.

It can be seen that reducing the discount rate to 3%, increasing inflation by 1%, or excluding excess
capacity revenues combined with a decrease in organics each results in an NPV higher than that of the
base case for this option. All other sensitivities result in reduced cost of this option when compared to
the base case.

The following chart shows the results of the sensitivity analysis for the pre-sort/anaerobic digestion
option on a NPV basis. The line graphs represent the high and low NPV results of the base case of the
pre-sort/ anaerobic digestion option. The bar graphs represents the high and low NPV results of the
sensitivities described on the x-axis of the graph.
It can be seen that reducing the discount rate to 3%, increasing inflation by 1%, or excluding excess
capacity revenues combined with a decrease in organics each results in an NPV higher than that of the
base case for this option. All other sensitivities result in reduced cost of this option when compared to
the base case.

Regional Municipality of Durham – Preliminary Business Case Financial Analysis                         9
Confidential

5. Conclusion
The preliminary business case illustrated the following NPV result for the status quo option and the high
and low NPV ranges for the other options studied:
    ► Status quo option: -$279 million
    ► Pre-sort/merchant capacity option: -$496 million to -$634 million
    ► Pre-sort/in-vessel composting option: -$445 million to -$548 million
    ► Pre-sort/anaerobic digestion option: -$446 million to -$555 million

The options studied present increases in overall costs compared to the status quo option. As noted, the
status quo does not represent a viable option going forward, as it does not address the study drivers.

Based on the analysis above it can be concluded that the relative NPV cost differences between in-vessel
composting option and anaerobic digestion option are relatively modest. The pre-sort/merchant capacity
option results in the highest NPV. It should be noted that additional revenues from biogas and
greenhouse gas credits from biogas have not been considered in the analysis of the pre-sort/anaerobic
digestion option. As demonstrated in the sensitivity analysis (electricity for anaerobic digestion), the
optimal use of the energy would result in a further reduction in cost of the pre-sort/ anaerobic digestion
options.

Regional Municipality of Durham – Preliminary Business Case Financial Analysis                         10
Appendix A. Inputs and Assumptions Regional Municipality of Durham – Preliminary Business Case Financial Analysis 11
Table 1

                                                                                              Status Quo
                                                                                      Assumptions and Inputs
                                                          Financial and Technical Consulting for Integrated Waste Management System Utility
                                                                                         Anaerobic Digestion
                                                                                   Regional Municipality of Durham
Assumption/Input                    Value                              Source                                         Rational

Waste Tonnages

Base Waste Tonnage*                 2015 waste tonnages                RMD 2015 Waste Report                          Available waste tonnage data relevant to the management of residuals and organics in the RMD.
                                                                                                                      Sensitivity: Decrease population growth by 1%.

Base Household Numbers*             SF – 197,499                       RMD, 2015 data                                 Current available data.
                                    MR – 24,009                                                                       Sensitivity: based on population growth assumptions.

Waste Tonnage Growth*               SF and MF Growth                   See SF and MF Growth.                          Waste tonnage is collected from both the SF and MF sectors.
                                                                                                                      Sensitivity based on population growth assumptions.

SSO Tonnage Growth*                 SF Growth                          See SF Growth.                                 SSO is collected from the SF sector.
                                                                                                                      Sensitivity based on population growth assumptions.

WMF Tonnage Growth*                 SF Growth                          See SF Growth.                                 The growth of WMF tonnage is assumed to follow the growth of the SF sector.

Leaf & Yard Waste Tonnage Growth*   SF Growth                          See SF Growth.                                 Leaf & Yard Waste is collected from the SF sector. The growth of the Leaf and Yard Waste tonnage
                                                                                                                      is assumed to follow the growth of the SF sector.

Pickering SSO Compost Site          Varies (tonnage)                   Calculated from RMD 2015 Waste Report.         Tonnages based on 2015 L&Y collected from Pickering and Ajax and 2015 SSO collected from
                                                                                                                      Pickering, Ajax, Clarington, Scugog, Uxbridge, and Brock.

Clarington L&Y Compost Site         Varies (tonnage)                   Calculated from RMD 2015 Waste Report.         Tonnages based on 2015 L&Y collected from Whitby, Oshawa, Clarington, Scugog, Uxbridge, and
                                                                                                                      Brock.

Pebblestone Transfer Station        Varies (tonnage)                   Calculated from RMD 2015 Waste Report.         Tonnages based on 2015 SSO collected from Oshawa and Whitby and transferred from
                                                                                                                      Pebblestone Transfer Station.

Waste Composition

SF Waste Composition*               2011 Audit                         Region of Durham Large Blue Box Container      Audit data provides an estimate of the composition of SF waste. The study included review of
                                                                       Study. Average of June & November Audit Data   garbage in addition to the blue box.
                                                                       AET Group. (2011).
                                                                                                                      Model adjusts SF Waste organic content based on SSO Program Materials. Sensitivity:
                                                                                                                      Decreasing organic content in waste by 5 percentage points.

MR Waste Composition*               2013 Audit                         Region of Durham Multi-Residential Waste       Audit data provides an estimate of the composition of MR waste.
                                                                       Composition Study AET Group. (2013).
                                                                                                                      Sensitivity: Decreasing organic content in waste by 5 percentage points.

                                                                                                                                                                             GHD | 11116808 Financial Analysis | Appendix A | Page 12
Table 1
Status Quo
Assumptions and Inputs
Financial and Technical Consulting for Integrated Waste Management System Utility
Anaerobic Digestion
Regional Municipality of Durham
Assumption/Input Value Source Rational
WMF Waste Composition* 2010 Audit Waste Audit & Facility Review, Oshawa WMF Audit data provides an estimate of the composition of WMF waste. Review of data identified that
Audit & Review of Operations AET Consultants there is little recyclables and organic matter in the waste stream from the WMF.
(2010).
Growth Rates
2016 and 2017 SF and MR Growth Rates* 2016 – 0% RMD Estimated growth rates reflective of steady waste tonnage projections for 2016 and 2017.
2017 – 0% Base case assumption for 2016 and 2017.
SF Growth Rates with Seaton* 2018-2021 – 3.0% Developed from development charges growth Current development forecast that includes the Seaton lands.
projections by housing type provided by RMD
2022-2026 – 2.7% SF base case assumption for 2018 to 2041.
(October 2016 Planning Report). Average rate
2027-2031 – 2.7% per period. Sensitivity will consider growth changes that are different (decrease noted growth rates by 1.0
percentage point).
2032-2036 – 2.0%
2037-2041 – 2.1%
2042-2046 – 2.1%
MR Growth Rates with Seaton* 2018-2021 – 3.1% Developed from development charges growth Current development forecast that includes the Seaton lands.
projections by housing type provided by RMD
2022 2026 – 4.5% MR base case assumption for 2018 to 2041.
(October 2016 Planning Report). Average rate
2027-2031 – 2.7% per period. Sensitivity will consider growth changes that are different (decrease noted growth rates by 1.0
percentage point).
2032-2036 – 2.0%
2037-2041 – 2.1%
2042-2046 – 2.1%
SSO Program Materials
Existing System Program Materials* Food Waste, RMD Materials currently accepted by the RMD’s SSO program.
Paper Fibre,
Other Compostable Items,
Compostable Liner Bags
Current SSO Capture Rates
Existing System SSO Program Capture Rate* 54% Calculated. 2015 SSO capture rate; percent of organics accepted by the SSO program in SF waste that were
captured by the existing SSO program.
GHD | 11116808 Financial Analysis | Appendix A | Page 13Table 1
Status Quo
CO
Assumptions and Inputs
Financial and Technical Consulting for Integrated Waste Management System Utility
Anaerobic Digestion
Regional Municipality of Durham
NF
Assumption/Input Value Source Rational
Operating Costs
ID
Waste Transfer and Disposal
Waste transfer to DYEC $21.89 /tonne Standard Agreement: C002117 Current available data.
EN
Quality Control prior to hauling to DYEC* $3.10 /tonne Standard Agreement: C002117 Current available data.
Waste transfer to Landfill through DYEC Current available data.
TIA
$71.00 /tonne RMD
Bypass
Organic Waste
L
Organic Waste - Haulage Pebblestone Standard Agreement: C001834 Current available data.
Transfer Station (Pebblestone Mulitservices
$12.50 /tonne
Inc., PMS) to Pickering SSO Compost Site
(Miller Waste Durham, MWD) to 2018
Pickering Compost – Organic Waste from Standard Agreement: C001834 Current available data.
$149.70 /tonne
Ajax and Pickering to 2018
Pickering Compost – Received, Processed & Standard Agreement: C001834 Current available data.
Composted at Pickering SSO Compost Site to $149.70 /tonne
2018
Clarington Compost – Leaf & Yard Waste $61.50 /tonne Standard Agreement: C002462 Current available data.
Processing to 2018
DYEC - Operator Fee* $58.70 /tonne – Scenarios with Status RMD Current available data. Excludes property tax.
Quo and DYEC Market Capacity
Pre-Sort scenario cost excludes revenue from metals at the DYEC. With Pre-Sort metals will be
Revenue
recovered at Pre-Sort facility.
$61.84 /tonne – Scenarios with Pre-Sort
DYEC Market Capacity revenue assumes sale of capacity to York Region.
Notes:
(*) Common to all Options
(1) Assessment excludes waste collection costs.
(2) Operating fees are net of revenues.
GHD | 11116808 Financial Analysis | Appendix A | Page 14Table 2
Site Location and Size of Facilities
Assumptions and Inputs
Financial and Technical Consulting for Integrated Waste Management System Utility
Anaerobic Digestion
Regional Municipality of Durham
Assumption/ Input Value Source Rational
Site Location Proxy Location Draft GIS-based Waste Transfer Logistics The Pre-Sort/Transfer Facility and organics processing facilities will all be located at the same
Modelling for the Proposed Energy-from-Waste site.
(EFW) Facility in the Region of Durham, Golder
The proxy site is assumed to be the size required and have the services required for the
Associates, 2010.
development of the facilities.
Waste Optimization Study for 4600 Garrard
Road, AECOM, 2012.
Land Area Required for Facilities 2 hectares for Pre-Sort Facility Estimated by GHD based on internal database The land area required for the facilities is required to estimate the opportunity cost / land
of constructed facilities. acquisition cost.
2 hectare for AD
2 hectares for in vessel
0.5 hectare for RNG
Land Opportunity Cost $494,000 /hectare (2016) RMD Works Real Estate Division, $200,000 / There is an opportunity cost to the RMD to utilize land for this project.
acre.
Land Acquisition Cost $494,000 /hectare (2016) RMD Works Real Estate Division, $200,000 / Estimated cost to acquire new/additional land for this project.
acre.
GHD | 11116808 Financial Analysis | Appendix A | Page 15Table 3
Pre-Sort/Transfer
Facility Assumptions and Inputs
Financial and Technical Consulting for Integrated Waste Management System Utility
Anaerobic Digestion
Regional Municipality of Durham
Assumption/ Input Value Source Rational / Comment
Materials Sent to Pre-Sort Facility SF Mixed Waste The Pre-Sort/Transfer Facility will receive SF mixed waste and MR mixed waste.
MR Mixed Waste • WMF residue will bypass the Pre-Sort Facility and will be hauled directly for disposal. (Not
to be included in business case)
• Recyclables will continue to be hauled directly to the MRF.
Curbside collected SSO will be received at the organics processing Facility.
SF and MR mixed waste will be directed to the Pre-Sort Facility where the organic fraction of
mixed waste (OFMW) will be isolated and then directed to the organics processing facility.
Excess capacity at the Pre-Sort Facility will not be utilized.
Pre-Sort Facility Capacity 160,000 tonnes per year Residual Waste Projection tonnages. Sized based on providing capacity for the Pre-Sort Facility at the 20 year period.
Recovery Rates – Non Organic
Ferrous Metals 90% GBB. (June 2015). The evolution of mixed waste Ferrous metal recovery is well established at MRFs with an automated sorting system.
processing facilities 1970-Today.
Non-Ferrous Metals 90% GBB. (June 2015). The evolution of mixed waste Non-Ferrous metal recovery is well established at MRFs with an automated sorting system.
processing facilities 1970-Today.
Other Metals 0% Assumption Requires specialized equipment and/or hand sorting. Includes scrap metal, copper pipe,
hardware, multi-material items that are mainly metal and empty propane tanks.
Paper 0% Assumption. As the Pre-Sorting Facility is managing mixed waste the removal of clean fibre material is not
anticipated.
In a blue box MRF with an automated sorting system recovery rate of 50-70% for mixed fibers
and 65-75% of cardboard are cited (GBB. June 2015). The evolution of mixed waste processing
facilities 1970-Today.)
Plastic PET 85% GBB. (June 2015). The evolution of mixed waste Plastic PET recovery is well established at MRFs with an automated sorting system.
processing facilities 1970-Today.
Plastic HDPE 85% GBB. (June 2015). The evolution of mixed waste Plastic HDPE recovery is well established at MRFs with an automated sorting system.
processing facilities 1970-Today.
Plastic Polystyrene 0% Assumption. Excluded as it is emerging.
Plastic Polyethylene 0% GBB. (June 2015). The evolution of mixed waste Plastic Polyethylene (film plastics) recovery is emerging.
processing facilities 1970-Today.
Glass 0% Assumption. There is little to no value in recovered glass.
GHD | 11116808 Financial Analysis | Appendix A | Page 16Table 3
Pre-Sort/Transfer
Facility Assumptions and Inputs
Financial and Technical Consulting for Integrated Waste Management System Utility
Anaerobic Digestion
Regional Municipality of Durham
Assumption/ Input Value Source Rational / Comment
Glass will be removed from the OFMW stream by the Pre-Sorting system and by the organics
facility pre-processing system. Removal of glass from the OFMW is required to reduce grit
accumulation and wear on the organics processing facility equipment.
Recovery Rate – Organics
Organic Fraction of Mixed Waste (OFMW) 80% GBB. (June 2015). The evolution of mixed waste In the Pre-Sort Facility, the captured organics will be equal to 80 percent by weight of the
processing facilities 1970-Today. Comparable available organics.
to GHD’s internal database.
Sensitivity: The captured organics will be equal to 60 percent by weight of the available organics.
Capital Cost
Transfer Station Capital Cost $7,000,000 RMD Council Report entitled 2014 Annual Solid Demolition of existing facility at 4600 Garrad Road and construct a new centralized transfer
Waste Management Servicing and Financing facility with up to 200,000 tonnes per year capacity.
(2013)
Study, November 28, 2013
Sensitivity: The costs of an independent transfer station are included in the event a sensitivity
Waste Optimization Study, Table 12, AECOM needs to be run on a separate transfer station.
(2012).
Pre-Sort Facility $34,400,000 to $40,000,000 LOW end cost based on PPP Canada Energy For a Pre-Sort facility with a capacity of 160,000 tonnes per year at LOW of $215 per design
From Waste Sector Study (September 2014). tonne to a HIGH of $250 per design tonne. This includes the capital costs of a transfer station at
Capital Cost (2016)
the pre-sort facility.
HIGH end cost based on published cost for
Infinitus Alabama Facility and proposed
Covanta Indianapolis Facility.
Lifecycle Costs Approximately 26% of capital cost Assumption Asset refurbishment/replacement costs were determined for several broad categories of assets
within each facility (e.g. building, mechanical equipment, process vessels, etc.). Each category
was allocated a percentage of the estimated replacement value and within each category the
percent of the asset that would be refurbished/replaced during the asset’s service life was
estimated. The service life of each category was established based on experience with similar
facilities/equipment as was the refurbishment cycle.
Operation Cost
Transfer Station $8.03 /tonne RMD Council Report entitled 2014 Annual Solid Operation of a transfer station, inclusive of facility administration, utilities, personnel, equipment
Waste Management Servicing and Financing maintenance, building maintenance, and facility maintenance
Operating Cost (2013)
Study, November 28, 2013.
Estimated 2015 tonnage is comparable to the 2015 actual tonnage (less blue box and reuse).
Waste Optimization Study, Table 12, AECOM
Sensitivity: The costs of an independent transfer station are included in the event sensitivity
(2012). Based on $1,289,000 operating cost for
needs to be run on a separate transfer station.
165,517 tonnes in 2015.
GHD | 11116808 Financial Analysis | Appendix A | Page 17Table 3
Pre-Sort/Transfer
Facility Assumptions and Inputs
Financial and Technical Consulting for Integrated Waste Management System Utility
Anaerobic Digestion
Regional Municipality of Durham
Assumption/ Input Value Source Rational / Comment
Pre-Sort Facility Operating Cost $70 to $80 /tonne GHD internal database of existing facilities Operation of a Pre-Sort Facility, inclusive of facility administration, utilities, personnel, equipment
information, site tours and industry reports (e.g., maintenance, building maintenance, and facility maintenance. This includes the transfer station
(2016)
CIF Study of the Optimization of the Blue Box operating costs.
Material Processing System, 2012)
Residual Transfer to DYEC $2.80 /tonne RMD Council Report entitled 2014 Annual Solid Transfer of residual material to DYEC for disposal.
Waste Management Servicing and Financing
(2013)
Study, November 28, 2013.
Revenue – Non Organics
Ferrous Metal $174 /tonne Continuous Improvement Fund (CIF), Price Average revenue per CIF Price Sheet from May 2015 to October 16.
Sheet – October 2016.
Non-Ferrous Metal $1706 /tonne Continuous Improvement Fund (CIF), Price Average revenue per CIF Price Sheet from May 2015 to October 16.
Sheet – October 2016.
Plastic PET $344 /tonne Continuous Improvement Fund (CIF), Price Average revenue per CIF Price Sheet from May 2015 to October 16.
Sheet – October 2016.
Plastic HDPE $469 /tonne Continuous Improvement Fund (CIF), Price Average revenue per CIF Price Sheet from May 2015 to October 16.
Sheet – October 2016.
EPR Revenues $100 /tonne RMD Based on approximately $5,000,000 revenue in 2015, which is approximately $100/tonne for the
48,250 tonnes of blue box recyclables currently collected and processed by the RMD.
GHD | 11116808 Financial Analysis | Appendix A | Page 18Table 4
In-Vessel Composting
Assumptions and Inputs
Financial and Technical Consulting for Integrated Waste Management System Utility
Anaerobic Digestion
Regional Municipality of Durham
Assumption/ Input Value Source Rational / Comment
In-Vessel Composting Facility Capacity 145,000 tonnes SSO and OFMW projections plus required Size based on providing capacity for 20 year period. Carbon amendment provided by operator.
(based on 110,000 tonnes of SSO and carbon amendment
Sensitivity: RMD generated Leaf and Yard Waste used for amendment at status quo rate.
OFMW)
AD Pre-processing Pass Through Rate
Existing System SSO Program 97% RMD 97 percent of the SSO material will pass to the In-Vessel phase. Assumes the residue is
removed in the In-Vessel pre-processing phase.
Material removed in the In-Vessel pre-processing phase may include grit, plastics, and
unsolicited material.
Equipment required to remove the unwanted material is proprietary to each technology vendor.
Material received when there is excess capacity in the In-Vessel Facility will be organics from
the RMD and will have a similar pass through rate as the RMD collected SSO.
OFMW from Pre-Sort Facility 80% GHD internal database. Material removed in the pre-processing phase may include grit, plastics, and unsolicited
material.
Equipment required to remove the unwanted material is proprietary to each technology vendor.
Sensitivity: 60 percent pass through rate.
Excess Capacity Organics 97% Assumption Material received when there is excess capacity in the In-Vessel Facility will be organics similar
in nature to SSO from within the RMD. This material will have a similar pass through rate as the
RMD collected SSO.
Capital Cost
In-Vessel Capital Cost $72,500,000 to 145,000,000 LOW prices based on undated Compost Council Based on a 145,000 tonne per year facility at a LOW of $500 per design tonne and a HIGH of
of Canada Compost Processing Technologies $1,000 per design tonne
(2016)
Report.
HIGH price based on GHD Internal database for
similar facilities, including Guelph, ON and
Calgary, AB facilities.
Lifecycle Costs Approximately 16% of capital costs. Assumption Asset refurbishment/replacement costs were determined for several broad categories of assets
within each facility (e.g. building, mechanical equipment, process vessels, etc.). Each category
was allocated a percentage of the estimated replacement value and within each category the
percent of the asset that would be refurbished/replaced during the asset’s service life was
estimated. The service life of each category was established based on experience with similar
facilities/equipment as was the refurbishment cycle.
GHD | 11116808 Financial Analysis | Appendix A | Page 19Table 4
In-Vessel Composting
Assumptions and Inputs
Financial and Technical Consulting for Integrated Waste Management System Utility
Anaerobic Digestion
Regional Municipality of Durham
Operating Cost
In-Vessel Facility Operating Cost $85 to $95 /tonne LOW price based on PPP Canada Energy From Operation of an In-Vessel Facility, inclusive of facility administration, utilities, personnel,
Waste Sector Study (September 2014). equipment maintenance, building maintenance, and facility maintenance.
(2016)
HIGH price based on GHD Internal database for
similar facilities
Residual Transfer to DYEC $2.80 /tonne RMD Council Report entitled 2014 Annual Solid Transfer of residual material to DYEC for disposal.
Waste Management Servicing and Financing
(2013)
Study, November 28, 2013.
NASM Application $88 /tonne GHD internal database Includes haulage, land application, and winter storage by third party processor
(2016)
Land Reclamation $110 /tonne GHD internal database. Estimate of haulage and land application at land reclamation site.
Revenue
Sale of Compost $0 /tonne GHD internal database. Included as part of overall operating costs.
Sale of Excess Capacity $200 /tonne Assumption Material received when there is excess capacity in the In-Vessel Facility will be organics similar
in nature to SSO from with the RMD.
Estimated based on consideration of RMD’s existing contract rate, assumption of increased cost
upon renewal, and capital upgrades likely required to meet current compost quality standards
for AA compost from SSO.
Sensitivity: Do not sell excess capacity.
GHD | 11116808 Financial Analysis | Appendix A | Page 20Table 5
Merchant Capacity
Assumptions and Inputs
Financial and Technical Consulting for Integrated Waste Management System Utility
Anaerobic Digestion
Regional Municipality of Durham
Assumption/ Input Value Source Rational / Comment
Merchant Capacity Varies – generation SSO and OFMW waste projection tonnages Based on yearly SSO and OFWM waste projection tonnages.
(tonnes per year)
Processing Cost
SSO and OFMW $175 to $225 /tonne (2016) Assumption Estimated based on consideration of RMD’s existing contract rate, assumption of increased cost
upon renewal, and capital upgrades likely required to meet current compost quality standards
for AA compost. Also considerers that OFMW has a higher contamination level that will require
more effort and equipment to process.
Haulage Cost
SSO and OFMW $25 to $50 /tonne (2016) Assumption Will vary based on location of merchant capacity. Estimate of haulage of 2 to 5 hours.
GHD | 11116808 Financial Analysis | Appendix A | Page 21Table 6
AD Facility
Assumptions and Inputs
Financial and Technical Consulting for Integrated Waste Management System Utility
Anaerobic Digestion
Regional Municipality of Durham
Assumption/ Input Value Source Rational
AD Facility Capacity 110,000 tonnes per year SSO and OWMF waste projection tonnages Sized based on providing capacity for 20 year projections.
AD Pre-processing Pass Through Rate
Existing System SSO Program 97% RMD 97 percent of the SSO material will pass to the AD phase. Assumes the residue is removed in
the AD pre-processing phase.
Material removed in the AD pre-processing phase may include grit, plastics, and unsolicited
material.
Equipment required to remove the unwanted material is proprietary to each technology vendor.
Material received when there is excess capacity in the AD Facility will be organics from the
RMD and will have a similar pass through rate as the RMD collected SSO.
OFMW from Pre-Sort Facility 80% GHD internal database. Material removed in the pre-processing phase may include grit, plastics, and unsolicited
material.
Equipment required to remove the unwanted material is proprietary to each technology vendor.
Sensitivity: 60 percent pass through rate.
Excess Capacity Organics 97% Assumption Material received when there is excess capacity in the AD Facility will be organics similar in
nature to SSO from within the RMD. This material will have a similar pass through rate as the
RMD collected SSO.
AD Post-Processing Pass Through Rate 100% GHD internal database. It has been assumed that all solid material will pass through the post-processing system.
Capital Cost
Capital Cost $68,750,000 to $110,00,000 LOW price based on PPP Canada Energy From Based on a 110,000 tonne per year facility at a LOW of $625 per design tonne to a HIGH of
Waste Sector Study (September 2014). $1000 per design tonne for capital cost
(2016)
HIGH price based on GHD Internal database for
similar facilities, including City of Toronto’s
Disco Road facility.
Lifecycle Costs Approximately 21% of capital costs. Assumption Asset refurbishment/replacement costs were determined for several broad categories of assets
within each facility (e.g. building, mechanical equipment, process vessels, etc.). Each category
was allocated a percentage of the estimated replacement value and within each category the
percent of the asset that would be refurbished/replaced during the asset’s service life was
estimated. The service life of each category was established based on experience with similar
facilities/equipment as was the refurbishment cycle.
GHD | 11116808 Financial Analysis | Appendix A | Page 22Table 6
AD Facility
Assumptions and Inputs
Financial and Technical Consulting for Integrated Waste Management System Utility
Anaerobic Digestion
Regional Municipality of Durham
Assumption/ Input Value Source Rational
Operating Cost
AD Facility Operating Cost $75 to $110 /tonne LOW operating cost based on Municipal Guide Operation of an AD Facility, inclusive of facility administration, utilities, personnel, equipment
to Biogas (March 2015) maintenance, building maintenance, and facility maintenance.
(2016)
HIGH operating cost based on GHD internal
database.
Residual Transfer to DYEC $2.80 /tonne RMD Council Report entitled 2014 Annual Solid Transfer of residual material to DYEC for disposal.
Waste Management Servicing and Financing
(2013)
Study, November 28, 2013.
Third-Party Composting Operating Cost $90 /tonne GHD internal database. Sensitivity based on RMD existing contracts with third-party processors.
NASM Application $88 /tonne GHD internal database. Includes haulage, land application, and winter storage by third-party processor.
Land Reclamation $110 /tonne GHD internal database. Estimate of haulage and land application at land reclamation site.
Biogas Upgrading System $0.0082 /MJ GHD internal database. Operating cost is inclusive of utilities, personnel, equipment maintenance, and building
maintenance.
Electricity Generation System $0.03 /kWh GHD internal database. Operating cost is inclusive of utilities, personnel, equipment maintenance, and building
maintenance.
Revenue
Sale of Compost $0 /tonne GHD internal database. Included in third-party composting operational cost
Renewable Identification No. Credits $1.01 /credit D5 (advanced fuels) RIN October 2016 Value. Renewable identification numbers (RINs) are credits used for compliance, and are the
“currency” of the US EPA Renewable Fuel Standard program.
Sale of RNG $0.106439 /m3 Ontario Energy Board. Enbridge price for natural gas for October 1, 2016.
Sensitivity is based on maximum and minimum price between January 2006 and October 2016.
Sale of Electricity $0.168 /kWh (first 500 kW) Independent Electricity System Operator FIT contract based on January 1, 2016 rate.
$0.05 /kWh (>500 kW) Base revenue is for feed behind the meter applications. Assumed as a portion of
non-residential electricity cost.
GHD | 11116808 Financial Analysis | Appendix A | Page 23Table 6
AD Facility
Assumptions and Inputs
Financial and Technical Consulting for Integrated Waste Management System Utility
Anaerobic Digestion
Regional Municipality of Durham
Assumption/ Input Value Source Rational
Sale of Excess Capacity $200 /tonne Assumption
Estimated base on consideration of RMD’s existing contract rate, assumption of increased cost
upon renewal, and capital upgrades likely required to meet current compost quality standards
for AA compost from SSO.
Sensitivity: Do not sell excess capacity.
Biogas Assumptions
Percentage of Methane AD 60% Industry information.
Biogas Conversion to RNG 97% Industry information.
RIN Calculations
RNG Production Yield 90% Industry information.
GHD | 11116808 Financial Analysis | Appendix A | Page 24Table 7
Economic Assumptions
Financial and Technical Consulting for Integrated Waste Management System Utility
Anaerobic Digestion
Regional Municipality of Durham
Assumption/Input Data Source
Escalation and discounting assumptions
General Inflation 1.88% Statistics Canada, Ontario, All items CPI, 2006 to 2016 (10y) = 1.88%
http://www.statcan.gc.ca/tables-tableaux/sum-som/l01/cst01/econ09g-eng.htm
Sensitivities to be run by changing general inflation, operating inflation and revenue escalation by +1% and -1%
Diesel Inflation 2.50% RMD
Revenue Inflation 1.88% Statistics Canada, Ontario, All items CPI, 2006 to 2016 (10y) = 1.88%
http://www.statcan.gc.ca/tables-tableaux/sum-som/l01/cst01/econ09g-eng.htm
Sensitivities to be run by changing general inflation, operating inflation and revenue escalation by +1% and -1%
Operating Inflation for existing Standard 1.84% Statistics Canada, Ontario, All items CPI Excluding energy, 2006 to 2016(10y) = 1.84%
Agreements
http://www.statcan.gc.ca/tables-tableaux/sum-som/l01/cst01/econ09g-eng.htm
Sensitivities to be run by changing general inflation, operating inflation and revenue escalation by +1% and -1%
Construction Inflation 2.60% Statistics Canada, Ontario, non-residential building construction, 2006 to 2016 (10y) =
2.60%http://www5.statcan.gc.ca/cansim/a26?lang=eng&retrLang=eng&id=3270043&&pattern=&stByVal=1&p1=1&p2=37&tabM
ode=dataTable&csid=
EFW Operating Costs Inflation 2.20% RMD
Discount Rate 5.00% Estimated weighted cost of capital (including inflation) for the RMD.
Sensitivities: Run at 3% and 7%.
GHD | 11116808 Financial Analysis | Appendix A | Page 25EY Assurance | Tax | Transactions | Advisory About EY EY is a global leader in assurance, tax, transaction and advisory services. The insights and quality services we deliver help build trust and confidence in the capital markets and in economies the world over. We develop outstanding leaders who team to deliver on our promises to all of our stakeholders. In so doing, we play a critical role in building a better working world for our people, for our clients and for our communities. EY refers to the global organization, and may refer to one or more, of the member firms of Ernst & Young Global Limited, each of which is a separate legal entity. Ernst & Young Global Limited, a UK company limited by guarantee, does not provide services to clients. For more information about our organization, please visit ey.com. For more information about our organization, please visit ey.com/ca. © 2017 Ernst & Young LLP. All Rights Reserved. A member firm of Ernst & Young Global Limited. All rights reserved.
You can also read