Cost-Effectiveness Testing for Energy Efficiency Programs Background, Current Status and Recommendations for Best Practices Going Forward ...
←
→
Page content transcription
If your browser does not render page correctly, please read the page content below
Cost-Effectiveness Testing for Energy Efficiency Programs

 Background, Current Status and Recommendations for
            Best Practices Going Forward

                        Martin Kushler, Ph.D.
            American Council for an Energy-Efficient Economy
                            Presentation to:
           Better Buildings Residential Network Peer Exchange
                           11 February, 2021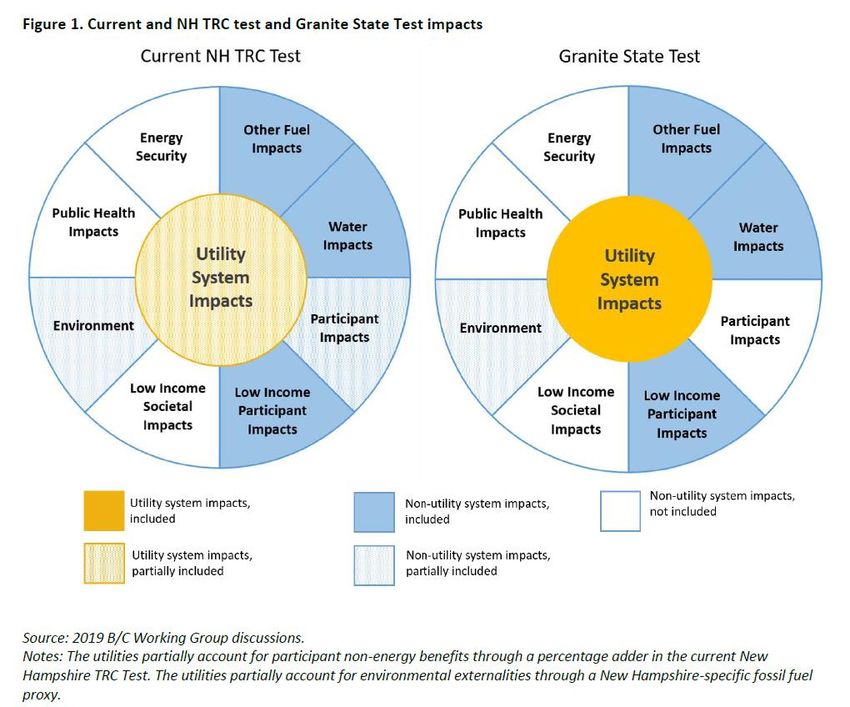
SOME HISTORY BEHIND B/C TESTING FOR EE
• Energy Efficiency as a utility resource was a disruptive concept
• Opposition to energy efficiency requirements by utilities and other
  powerful parties (e.g., industrial customers)
• High “burden of proof” placed on energy efficiency as a resource
• Scrutiny disproportionate to any other utility expenditure
• The legacy continues today

e.g., comparison of energy efficiency to other “alternative resources”
   ❖All but one state requires benefit-cost testing for energy efficiency
   ❖Only 27% required B/C testing for load management programs
   ❖Only 21% required B/C testing for renewable energy programs

[NOTE: utilities are regulated at the state level. So each state
establishes its own benefit-cost test policy]
PURPOSES OF BENEFIT-COST TESTING
    FOR UTILITY ENERGY EFFICIENCY PROGRAMS
•   To help ensure that ratepayer dollars are
    prudently spent (in this case, defined as the
    “benefits” being equal to or greater than the
    “costs”….. i.e., a B/C ratio of 1.0 or greater)

•   To help prioritize amongst resource/program
    options (i.e., larger B/C ratios deliver more benefits
    per dollar)*
____________
* Of course, other factors also influence selection of
programs (e.g., equity across customer groups)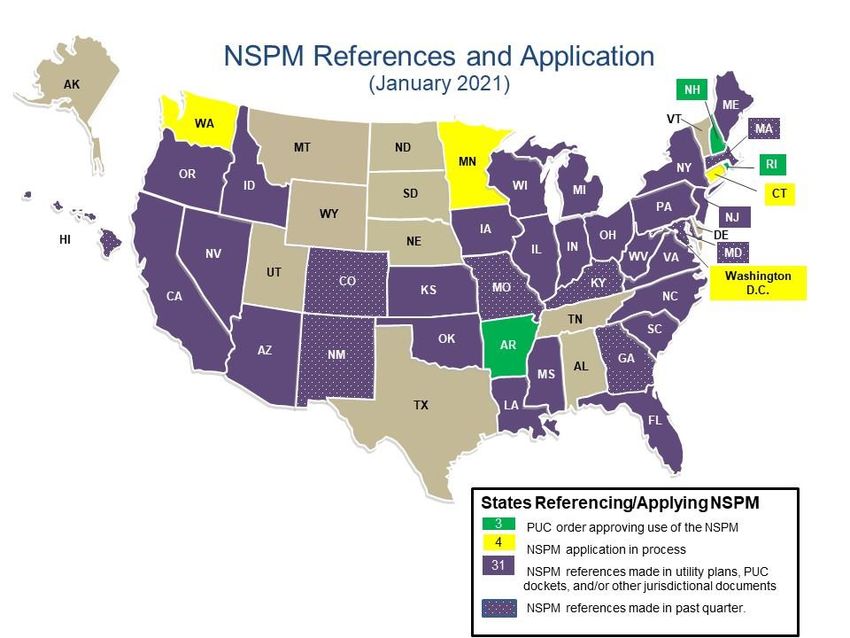
INFORMATION SOURCES:
       1) ACEEE 2020 NATIONAL EM&V SURVEY*
• Surveyed all states with ratepayer funder EE
  programs (44 state completed the survey)
• Primary contacts were regulatory staff—2ndary
  were key stakeholders
____________
*National Survey Of State Policies And Practices For Energy
Efficiency Program Evaluation
https://www.aceee.org/research-report/u2009
Study also incorporated: Database of Screening Practices (DSP) from
National Energy Screening Project (NESP) which provides detailed data
on cost-effectiveness testing
https://www.nationalenergyscreeningproject.org/state-database-
dsesp/
2) ACEEE 2020 REPORT ON NATURAL GAS UTILITY
      ENERGY EFFICIENCY COST-EFFECTIVENESS*
• Inspired by challenges gas EE programs have faced in recent
  years with extremely low natural gas market prices
• Reviewed general status of gas utility EE cost-effectiveness
  around the nation
• Did a more detailed review of the top 10 states in gas energy
  efficiency savings from the ACEEE State Scorecard report

______________
*Sustaining Utility Natural Gas Efficiency Programs in a Time of
Low Gas Prices
https://www.aceee.org/white-paper/2020/10/sustaining-utility-
natural-gas-efficiency-programs-time-low-gas-prices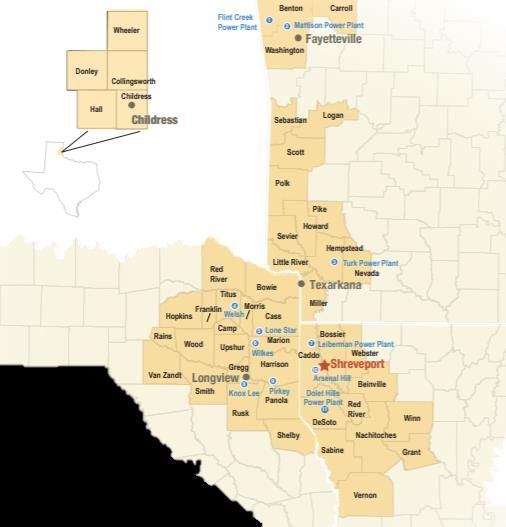
TRADITIONAL APPROACHES TO B/C TESTING:
          THE 5 “CALIFORNIA” TESTS*
• The Participant test [PART]
• The Utility or Program Administrator test [UCT or
  PACT]
• The Total Resource Cost test [TRC]
• The Societal cost test [SCT]
• The Ratepayer Impact Measure test [RIM]

* From the California Standard Practice Manual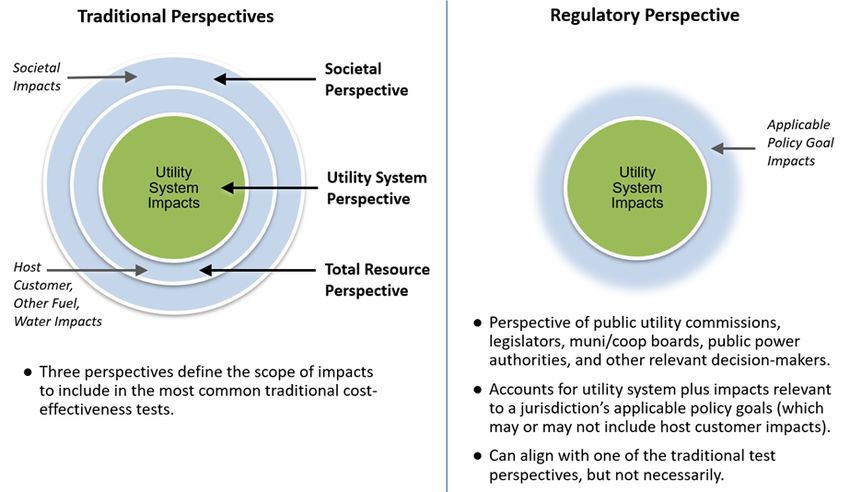
COMPONENTS OF THE 5 TRADITIONAL TESTS
                                                   Partic.   RIM    TRC        SCT      UCT/
                                                                                        PACT

Benefits
  Primary Fuel(s) Avoided Supply Costs                       ✓       ✓         ✓         ✓

  Secondary Fuel(s) Avoided Supply Costs                             ✓         ✓

  Primary Fuel(s) Bill Savings (retail prices)       ✓

  Secondary Fuel(s) Bill Savings (retail prices)     ✓

  Other Resource Savings (e.g. water)                ✓               ✓         ✓

  Environmental Benefits                                                       ✓

  Other Non-Energy Benefits                                        Rarely   In Theory

Costs
  Program Administration                                     ✓       ✓         ✓         ✓

  Measure Costs
    Program Financial Incentive                              ✓       ✓         ✓         ✓

    Customer Contribution                            ✓               ✓         ✓

  Utility Lost Revenue                                       ✓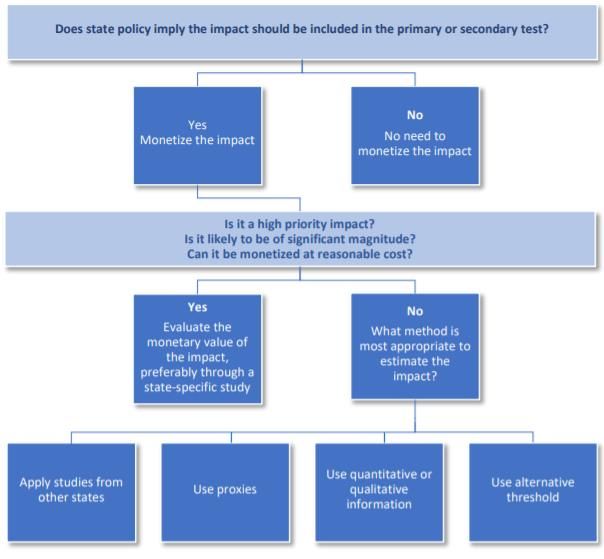
3 KEY PROBLEMS WITH TRADITIONAL B/C TESTING

•            The TRC test*, as generally applied, is fundamentally
             imbalanced …it includes all customer costs for an
             energy efficiency project, but ignores all of the
             customer ‘non-energy benefits’ from the project.
•            States frequently do not adequately account for all of
             the utility system benefits that energy efficiency
             provides
•            The standard tests do not capture or address other
             energy-related policy goals a state may have

●--------------------------------------------------------------------------

*Note: a Societal Test can have the same imbalance, if not
properly calculated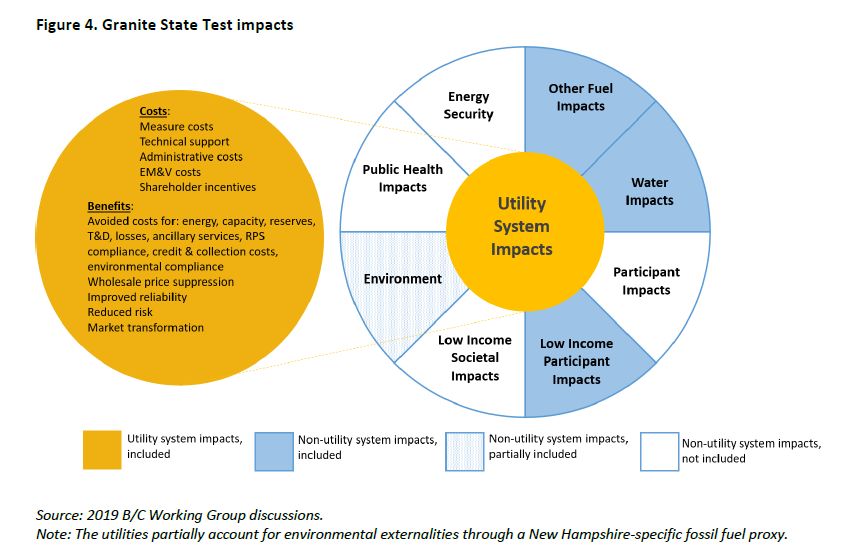
CONCERNS ABOUT THE ‘IMBALANCE’ IN THE TRC
TRC= (utility costs + participant costs) vs. utility benefits only

• Not conceptually logical – customers invest their money
  in EE projects for a variety of benefits - - not solely to save
  energy. Why include all costs they incur but exclude
  many benefits in a B/C calculation?
• Systematically biased against EE – these extra
  ‘customer’ costs are not considered when selecting
  supply-side options (e.g., purchased power, distributed
  generation, customer-sited renewables, etc.)
• Out-of-step with common practice in program design
  and marketing (which often emphasizes NEBs)
• Will result in ‘screening out’ programs that would be
  cost-effective from a utility resource perspective
PRIMARY B/C TEST USED BY STATES IN 2011

                                                    (n=43)

    TRC                                                                71%

 Societal                    15%

UCT/PACT                    12%

     RIM         2%

            0%        10%         20%   30%   40%        50%   60%   70%     80%   90%   100%
CURRENT USE OF PRIMARY B/C TESTS AMONG STATES
UTILITY SYSTEM BENEFITS OFTEN UNDER-VALUED
•All costs typically included (administration, rebates, eval., etc.)
•Energy and capacity benefits typically included (albeit inconsistently)
•But many other benefits often not included or under-valued
    oAvoided T&D costs often excluded or under-valued
    oReserve margin benefits often omitted
    oAvoided environmental compliance costs often excluded
    oWholesale price suppression effects not commonly captured
    oRisk mitigation benefits rarely included
    oLower credit/collection costs rarely included
    oLine loss reductions commonly understated
        ➢Higher at peak than rest of year – only sometimes addressed
        ➢Should use marginal loss rates, but average losses used instead

Result: Efficiency typically under-valued in all screening tests.
LOW-INCOME PROGRAMS = A SPECIAL CATEGORY
• Benefits included in a typical comprehensive low-income
weatherization program:
o Energy use reduction
o Home repair
o increased comfort
o Indoor air quality (mold, allergens, radon, CO, etc)
o Poisons (house cleaners, lead, etc)
o Safety (furnace, housing structure, electrical, etc)
• The value of these “non-energy” benefits typically exceeds
the value of the “energy” benefits (e.g. see the 2014
ORNL study:
https://www.energy.gov/sites/prod/files/2015/09/f26/weatherization-works-
retrospective-evaluation.pdf
• While these benefits are rarely quantified by states, nearly
all states have special provisions for low-income energy
efficiency programsSUMMARY • Benefit-cost testing can be informative, and useful for decision- making….if properly done • Use of benefit-cost tests for assessing ratepayer-funded energy efficiency programs is essentially universal in the states • Reliance upon TRC for cost-effectiveness screening is still very widespread (much due to legacy and entrenched practice) • The TRC test (as commonly applied) has some serious shortcomings • Utility system benefits often under-valued in all of the B/C tests • The standard tests don’t capture related state policies • These and other concerns about benefit-cost testing are leading to a re-examination of this issue in the industry and the regulatory community (e.g., see the NSPM for DERs)
RECOMMENDATIONS: BEST PRACTICES IN
                 EE COST-EFFECTIVENESS ASSESSMENT
o Ensure that the test is ‘symmetrical’
o Appropriately value all utility system benefits and costs (e.g.,
  include peak demand savings and avoided T&D costs, include
  time and locational value of the savings, marginal line losses, etc.)
o [IF INCLUDING PARTICIPANT COSTS] Include appropriate non-
  energy benefits (e.g., health, comfort, safety, O&M savings, etc.)
o Base decisions on other costs and benefits on relevant state policies
o Provide for special treatment of low-income programs (e.g.,
  exemption from passing the B/C test)
o Appropriately value environmental benefits (including CO2 )
o Apply cost-effectiveness requirements at the portfolio level
o Use a low-risk or societal discount rate
o Include assessment of the risk of future natural gas price increases
Thank you! For any follow-up questions: Contact: mgkushler@aceee.org
Passing The Test: How Are Residential Efficiency Cost
          Effectiveness Tests Changing?

And how the National Standard Practice Manual (NSPM)
  is Changing Benefit-Cost Analysis of EE and Other
            Distributed Energy Resources

              Julie Michals – E4TheFuture
                    February 11, 2021

Better Buildings Residential Network Peer Exchange
About NESP and the NSPM
National Energy Screening Project (NESP): stakeholder organization
open to all organizations and individuals with an interest in working
collaboratively to improve benefit-cost analysis BCA) of energy
efficiency (EE) and other distributed energy resources (DERs)
Products include:
• NSPM for EE (2017)
• NSPM for DERs (2020)
• Database of Screening Practices (DSP)
NESP managed by E4TheFuture, with state outreach via key partners,
and funded by E4TheFuture with support from US DOE.
NSPM guidance documents informed by extensive Advisory Group with
diversity of perspectives and affiliations.
https://nationalenergyscreeningproject.org/
National Standard Practice Manual 18NSPM for EE
May 2017
NSPM for DERs
August 2020
The NSPM for DERs incorporates and
expands on the NSPM for EE. See comparison
National Standard Practice Manual 19National Standard Practice Manual 20
NSPM for DERs - Contents

Executive Summary                     Part IV: BCA for Multiple DERs
 1. Introduction                       11. Multiple On-Site DERs
Part I: BCA Framework                  12. Non-Wires Solutions
 2. Principles                         13. System-Wide DER Portfolios
 3. Developing BCA Tests               14. Dynamic System Planning
Part II: DER Benefits and Costs       Appendices
 4. DER Benefits and Costs             A. Rate Impacts
 5. Cross-Cutting Issues               B. Template NSPM Tables
Part III: BCA for Specific DERs        C. Approaches to Quantifying Impacts
 6. Energy Efficiency                  D. Presenting BCA Results
 7. Demand Response                    E. Traditional Cost-Effectiveness Tests
 8. Distributed Generation             F. Transfer Payments
 9. Distributed Storage                G. Discount Rates
 10. Electrification                   H. Additional EE Guidance

  National Standard Practice Manual                                     21
NSPM BCA Framework

                                      Multi-Step Process to    When and How to Use
      Fundamental BCA
                                       Develop a Primary         Secondary Cost-
         Principles
                                     Cost-effectiveness Test    Effectiveness Tests

 National Standard Practice Manual                                               22
NSPM BCA Principles
1. Recognize that DERs can provide energy/power system needs and should
be compared with other energy resources and treated consistently for BCA.
2. Align primary test with jurisdiction’s applicable policy goals.
3. Ensure symmetry across costs and benefits.
4. Account for all relevant, material impacts (based on applicable policies),
even if hard to quantify.
5. Conduct a forward-looking, long-term analysis that captures incremental
impacts of DER investments.
6. Avoid double-counting through clearly defined impacts.
7. Ensure transparency in presenting the benefit-cost analysis and results.
8. Conduct BCA separate from Rate Impact Analyses because they answer
different questions.
Principles are not mutually exclusive.
National Standard Practice Manual 23EE and Other DER Benefits & Costs
Utility-system Impacts are foundational – Always include Non-Utility System Impacts – Inclusion depends
Type Utility System Impact on applicable policy goals & objectives
Energy Generation Type Host Customer Impact
Capacity Host portion of DER costs
Environmental Compliance Host transaction costs
Generation
RPS/CES Compliance Interconnection fees
Market Price Effects Risk
Host Reliability
Ancillary Services
Customer Resilience
Transmission Capacity
Transmission Tax incentives
Transmission System Losses Non-energy Impacts
Distribution Capacity Low-income non-energy
Distribution System Losses impacts
Distribution
Distribution O&M
Distribution Voltage Type Societal Impact
Financial Incentives
Resilience
Program Administration
GHG Emissions
Utility Performance Incentives
Other Environmental
General Credit and Collection Societal Economic and Jobs
Risk Public Health
Reliability Low Income: Society
Resilience Energy Security
24
National Standard Practice ManualHost Customer
Type Description
Impact
Host portion of Costs incurred to install and operate
DER Benefits & Costs (cont.)
DER costs DERs Host Customer Impacts
Host transaction Other costs incurred to install and
(inclusion depends on policy goals)
costs operate DERs
Costs paid by host customer to
Interconnection
interconnect DERs to the electricity
fees
grid
Host Customer Summary Description
NEI
Uncertainty including price volatility,
power quality, outages, and Costs incurred to adopt DERs, beyond those related to
operational risk related to failure of Transaction costs the technology or service itself (e.g., application fees,
Risk
installed DER equipment and user time spent researching, paperwork)
error; this type of risk may depend on
Changes in the value of a home or business as a result
the type of DER Asset value of the DER (e.g., increased building value, improved
equipment value, extended equipment life)
The ability to prevent or reduce the
Host Reliability Changes in a customer’s productivity (e.g., changes in
duration of host customer outages Productivity labor costs, operational flexibility, O&M costs, reduced
Customer
waste streams, reduced spoilage)
The ability to anticipate, prepare for,
Economic impacts beyond bll savings (e.g., reduced
and adapt to changing conditions and Economic well- complaints about bills, reduced terminations and
Resilience
withstand, respond to, and recover being reconnections, reduced foreclosures—especially for low-
rapidly from disruptions income customers)
Changes in comfort level (e.g., thermal, noise, and
Comfort
Federal, state, and local tax incentives lighting impacts)
Tax incentives provided to host customers to defray
Changes in customer health or safety (e.g., fewer sick
the costs of some DERs Health & safety days from work or school, reduced medical costs,
improved indoor air quality, reduced deaths)
Non-energy Benefits and costs of DERs that are Empowerment & The satisfaction of being able to control one’s energy
Impacts separate from energy-related impacts control consumption and energy bill
Low-income The satisfaction of helping to reduce environmental
Non-energy benefits and costs that Satisfaction &
impacts (e.g., one of the reasons why residential
non-energy pride 25
affect low-income DER host customers customers install rooftop PV)
impactsComparison of NSPM Regulatory Perspective
to Traditional Perspectives
NSPM for DERs
National Standard Practice Manual 26Comparison of JST to Traditional Tests
Test Perspective Key Question Answered Categories of Benefits and Costs Included
Will the cost of meeting utility
Includes the utility system impacts, plus those
Jurisdiction- Regulators or system needs, while achieving
impacts associated with achieving applicable
Specific Test decision-makers applicable policy goals, be
policy goals
reduced?
Utility Cost Will utility system costs be
The utility system Includes the utility system impacts
Test* reduced?
Will utility system costs and host
Total Resource The utility system Includes the utility system impacts, plus host
customers’ costs collectively be
Cost Test plus host customers customer impacts
reduced?
Includes the utility system impacts, plus host
Will total costs to society be customer impacts, plus societal impacts such
Societal Cost Society as a whole
reduced? as environmental and economic development
impacts
*Also referred to as the Program Administrator Cost (PAC) Test.
National Standard Practice Manual 27Use of Secondary Tests
NSPM provides guidance on when and how to use
secondary tests.
While a jurisdiction’s primary test informs whether to fund or
otherwise support DERs, secondary tests can help to:
• inform decisions on how to prioritize DERs;
• inform decisions regarding marginally non- and/or cost-
effective DERs; and
• encourage consistency across DER types.
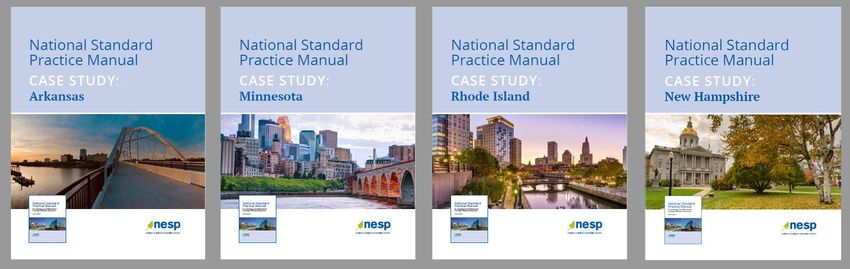
National Standard Practice Manual 28NSPM Case Studies
Case Study examples
National Standard Practice Manual 29State process for applying NSPM
What we are generally seeing…
6-9+ months 2-3 months 6-12 months 2-4 months later…
State outreach PUC staff PUC staff led PUC Order
• Webinar and/or directive/order stakeholder process • Adopt/modify
• In-person • Apply the NSPM • NSPM framework stakeholder
meeting • Can we improve applied recommend-
• Stakeholders/ CE testing? • Check alignment with ations
PUC • Report back… principles • Prioritize areas
• Develop report & of focus
recommendations
Processes take time... Implementation: PUC staff
led changes to CE testing
with stakeholder input
National Standard Practice Manual 30New Hampshire – NSPM Review and Application ● Late 2018 - Informational meetings with PUC staff and stakeholders on the what/why/how on NSPM… ● March to Oct 2019 - PUC staff embark on NSPM 7-step process with state Benefit-Cost Working Group and consulting support (Synapse Energy Economics). Working group involves PUC staff, utilities, consumer advocate, various NGOs ● Oct 2019 - Synapse issues final report reflecting BC Working Group review and input. Report submitted to commission. ● Dec 2019 - Commission Order Approving Benefit Cost Working Group Recommendations (Order 26,322), with changes to cost-effectiveness testing practices to go into effect January 2021 National Standard Practice Manual 31
New Hampshire – Primary Test
Before and
After NSPM

 National Standard Practice Manual   32
New Hampshire – Utility System Impacts
a closer look…

 National Standard Practice Manual       33
Ensure Symmetry of Benefits & Costs
        Illustrative Example: Treatment of Host Customer Costs and Benefits
                                                Asymmetry                       Symmetry

                Costs and Benefits            A. Host Customer    B. Host Customer C. Host Customer
                                               Costs Included,    Costs and Benefits Costs and Benefits
                                              Benefits Excluded     Both Included     Both Excluded
 DER Costs
  Utility System Costs:
   - Rebate/Incentive                             $1,875              $1,875             $1,875
   - Administrative Costs                         $1,500              $1,500             $1,500
  Host Customer Costs:                            $5,625              $5,625           not included
            Total Costs Accounted for:            $9,000              $9,000             $3,375
 DER Benefits
  Utility System Avoided Costs                   $6,000               $6,000             $6,000
  Host Customer Non-Energy Benefits            not included           $4,000           not included
         Total Benefits Accounted for:           $6,000               $10,000            $6,000
 Net Benefit/Cost                                 ($3,000)            $1,000               $2,625
                  Benefit-Cost Ratio (BCR):         0.67                1.11                 1.78

                                                     X
    Treatment of Host Customer Impacts          Asymmetrical                   Symmetrical
 National Standard Practice Manual                                                                        34
New Hampshire
Determining how to
account for EE
Impacts
National Standard Practice Manual 35A few words on the NSPM for DERs
(and broader application beyond EE…)
National Standard Practice Manual 36DER Benefits & Costs
Utility System Impacts – whether a benefit/cost can depend on various factors…
Type Utility System Impact EE DR DG Storage Electrification
Energy Generation ● ● ● ● ●
Capacity ● ● ● ● ●
Environmental Compliance ● ● ● ● ●
Generation
RPS/CES Compliance ● ● ● ● ●
Market Price Effects ● ● ● ● ●
Ancillary Services ● ● ● ● ●
Transmission Capacity ● ● ● ● ●
Transmission
Transmission System Losses ● ● ● ● ●
Distribution Capacity ● ● ● ● ●
Distribution System Losses ● ● ● ● ●
Distribution
Distribution O&M ● ● ● ● ●
Distribution Voltage ● ● ● ● ●
Financial Incentives ● ● ● ● ● ● = typically a benefit
● = typically a cost
Program Administration Costs ● ● ● ● ● ● = either a benefit
Utility Performance Incentives ● or cost depending on
● ● ● ● application
General Credit and Collection Costs ● ● ● ● ● ○ = not relevant for
resource type
Risk ● ● ● ● ●
Reliability ● ● ● ● ● 37
Resilience ● ● ● ● ○Key Factors that Affect DER Impacts Depends on specific DERs and use cases: o DER technology characteristics, operating profile o Resource ownership/control o Temporal and locational impacts o Interactive effects o Behind-the-Meter versus Front-of-the-Meter Cross-Cutting Considerations o Air Emission Impacts o Transfer Payments and Offsetting Impacts o Variable Renewable Generation Impacts o Wholesale Market Revenues o Free Riders and Spillover Impacts o Discount Rates National Standard Practice Manual 38
Temporal Impacts on EE Benefits
Hypothetical Example

                                      Location Impacts on DR Benefits
                                      Hypothetical Example

  National Standard Practice Manual                             39
Multiple On-site DERs
Example of GEB Interactive Effects
20
18
16
14
12
Benefits
Total Benefits
10
Combined
8
Storage
6
DPV
4
DR
2
EE
0
DPV + Storage DPV + Storage EE + DR Total benefits
+ EE + DR Interactive Interactive
Without Effects Effects
Interactive
Effects • Interactive effects can have both a positive and negative impact on BCA;
e.g., positive interactive benefits between DPV and DS, yet negative interactive
effects between EE and DR.
• In analyzing combined net interactive effects, total benefits are higher overall than
without interactive effects, but not as high as if only DPV and DS interactive
effects were accounted for.
• It is key to ensure that BCAs fully capture the net potential interactive effects.
National Standard Practice Manual 40For More Information:
Check out NESP Events for BCA/NSPM topical webinars
Visit the Database of Screening Practices (DSP) to access
comprehensive information about cost-effectiveness testing practices
for electric and natural gas EE programs
Stay informed with the NESP Quarterly Newsletter
Questions?
Julie Michals, Director of Valuation – E4TheFuture
jmichals@e4thefuture.org
National Standard Practice Manual 41Better Buildings Residential Network Peer Exchange
Passing The Test: How Are Residential Efficiency Cost
Effectiveness Tests Changing?
Arkansas NSPM Case Study
Sherry McCormack
Manager, Energy Efficiency & Consumer Programs
Southwestern Electric Power Company
42Who We Are
• 543,000+ customers
• 1,750 employees
• 33,696 square miles
of service area
2/2/2021 43Overview
• Conducted during 2017-2018 by Parties Working
Collaborative (PWC), which includes
• AR investor owned electric and gas utilities
• APSC Staff
• Attorney General’s Office
• Audubon Society
• Evaluators
• Filed with Arkansas Public Service Commission
Oct. 26, 2018 in Docket No. 10-100-R
2/2/2021 44Findings & Resulting SWEPCO
Actions
• Inconsistencies with APSC guidance around Total
Resource Cost Test
• Various approaches to quantifying utility system impacts
• Avoided T&D costs
• Average line loss rates versus marginal line loss rates
• Treatment of incentives paid to free riders
• Choice of discount rates
• Impact to SWEPCO’s reporting
• Changed from no inclusion to zero dollars
• Requested marginal line loss included in line loss study
• Discount rate no longer updated annually – WACC approved in
most recent general rate case will be used
2/2/2021 45Inconsistencies Noted Between AR
Cost Effectiveness (CE) Analysis &
NSPM Principles
• Categories of utility system impacts not addressed
• Avoided ancillary service costs
• Avoided credit and collection costs
• Risk mitigating value of efficiency resources
• Asymmetrical application of participant impacts
• Inclusion of all costs but excluding some NEBs
• Incorporation of assumptions regarding carbon costs
2/2/2021 46Inconsistencies Noted Between AR CE
Analysis & NSPM Principles – Actions
Taken
• Avoided ancillary service costs
• Quantification not warranted; recommendation of no change
• Avoided credit and collection costs
• Monitoring cost studies underway in other jurisdictions
• Risk mitigating value of efficiency resources
• Recommend no change
2/2/2021 47Inconsistencies Noted Between AR CE
Analysis & NSPM Principles – Actions
Taken (cont’d)
• Asymmetrical application of participant impacts,
including the inclusion of all costs but excluding some
NEBs
• No additional asymmetrical applications found except those
associated with low-income energy efficiency programs
• Three NEBs are currently quantified and reported by utilities
• Other fuels – electricity, natural gas, liquid propane energy savings
• Public water and wastewater
• Avoided and deferred equipment replacement costs
2/2/2021 48Inconsistencies Noted Between AR CE
Analysis & NSPM Principles – Carbon
Costs Status
• Incorporation of assumptions regarding carbon costs
• Directive was to propose consistent mechanism for
illustrating rate and bill impacts of modeling low, medium,
and high carbon cost scenarios on the cost effectiveness of
a utility’s EE programs
• Carbon cost calculators are currently under consideration by
the APSC
2/2/2021 49Next Steps
• More consistent inputs to annual cost effectiveness
analysis
• New reporting tool for three-year plans
• Provides additional consistency for stakeholder review
2/2/2021 50Thank you!
Sherry McCormack
Manager, Energy Efficiency & Consumer
Programs
slmccormack@aep.com
51You can also read