Q1/2021 Analyst Meeting - May 14, 2021 - Global Power Synergy Public ...
←
→
Page content transcription
If your browser does not render page correctly, please read the page content below
Q1/2021
Analyst Meeting
May 14, 2021

GPSC : Q1/2021 Highlight

Financial Performance &
2021 Outlook

Strategic Directions (3S)
     •   Synergy and Integration
     •   Selective Growth
     •   S-Curve

Sustainability at GPSC

Update of Projects

Q&A

 2                                 2
Q1/2021 | Highlight
Challenges and Concerns

           COVID-19                           Energy Transition                                      Climate Change

Operational Excellence and Readiness to move forward

      Strengthen the Core       To ensure stability and continuity of utilities to supply IUs
                                 •   Measures against COVID-19 : The highest control measures have been implemented e.g. safe house for operators (Golden Man),
                                     refrain external parties to access the offices and operating areas.
                                 •   Business Continuity Plans (BCP) to give confidence that the company will be able to manage and continually operate production,
                                     without any interruption
                                 •   Operational Excellence : Best-in-class operation for reliability and security of the network and continuous Improvement

           Growth ambitions           • Follow the growth plan to invest in conventional and renewable
                                      • Increased focus on renewables
                                      • Increased present outside of Thailand

      New Businesses        • Battery value chain
                            • Expansion in S-curve and adjacent businesses
                                                                                                                                                                      3
Q1/2021 | Highlight
Q1/21 Events &Highlights Q1/21 Performance
The restructuring of power business in PTT Group Gross profit & Gross profit margin
Public by power plant type
24.77% 44.45%*
32% Gross profit
29% 30%
2,819.7 margin
Million shares
Unit: THB MM 5,365 5,339 Gross profit
20.78%
2% 4,931 1% VSPP & others
10.00%* 2%
YoY
After the transaction completed, PTT and SMH will hold 44.45%
0.5%
shares of GPSC and expected to be completed by Q2/2021. 71% 80% SPP
75%
QoQ
Stable demand from 8%
industrial customers 27% 23% IPP
19%
Q1/20 Q4/20 Q1/21
Strong performance from affiliates Net Income
1,973
Unit: THB MM
Sales of 50% shares in GRP 1,580 1,458
YoY
(ownership 100% 50%)
25%
QoQ
GLOW Energy Phase 5 resumed
35%
normal operation since 2-Apr-21
Q1/20 Q4/20 Q1/21 4
GPSC : Q1/2021 Highlight

Financial Performance &
2021 Outlook

Strategic Directions (3S)
     •   Synergy and Integration
     •   Selective Growth
     •   S-Curve

Sustainability at GPSC

Update of Projects

Q&A

 5                                 5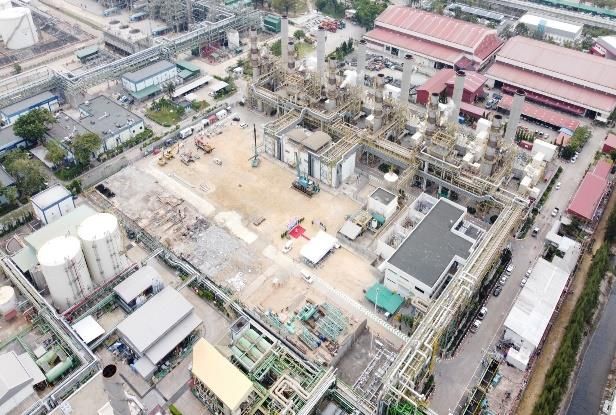
Q1/2021 Key Drivers
                 Electricity Sales volume (GWh) &
                                                                                  Natural Gas Cost 2020 - Q1’2021 (THB/MMBTU)
                 Steam Sales volume ('000 tons)
                                                                                   280 281
     5,093                   4,984                   4,940            270 270                   273

       6                      20                       5
                                                                                                       259 257

                                     3,739                 3,705            260 262 257
                                                                                                                           242
                                                                                                                                                      237 239 239
             3,254                                                    252                       252                 231           232
     3,219                   3,234                   3,149                                             247                                     226
                                                                                                                                        213
                                                                                                              232
                                                                                                                    227
                                                                                                                           219
                                                                                                                                               208 211 210 210
                                                                                                                                  203 203
     1,868                   1,730                   1,786

    Q1/20                    Q4/20                   Q1/21                                            IPP           SPP (blended gas cost)

                  IPP   SPP     VSPP      Steam                                      Coal Cost 2020 - Q1’2021 (USD/Ton JPU)

                                                                      99
                           Ft (THB/kWh)                                                                96
                                                                             89          87     87
                                                                                    85                         83   82
                                                                                                                           79           82
                                                                                                                                  77           78
                                                                      88                                                                              74
                                                                                                                                                            71     73
                                                                                         76                         78
  -0.1160       -0.1160       -0.1243                                        72     73                 73      75
                                                                                                                           70           71                  72     67
                                                                                                69                                67
                                           -0.1532       -0.1532                                                                               65     63
  M1-M4/20      M5-M8/20      M9-M12/20    M1-M4/21      M5-M8/21

             Ft for M1-M8/2021 is –15.32 Satang/unit.
                                                                                                             IPP          SPP

                                                       Change +/(-)                           End-month FX (THB/USD)
IPP’s Availability Rate (%) Q1/20 Q4/20 Q1/21
                                                   YoY  QoQ
                                                                            M1/20             31.30            M10/20           31.37         M1/21        30.17
Sriracha Power Plant           95%      90% 99.8% 5%    10%
                              100%           76% (24%) (14%)                M2/20             31.78            M11/20           30.45         M2/21        30.21
GIPP                                    90%
GHECO-One                      96%      94%  59% (37%) (35%)                M3/20             32.83            M12/20           30.21         M3/21        31.51
                                                                        Average           31.97                                 30.68                      30.63        6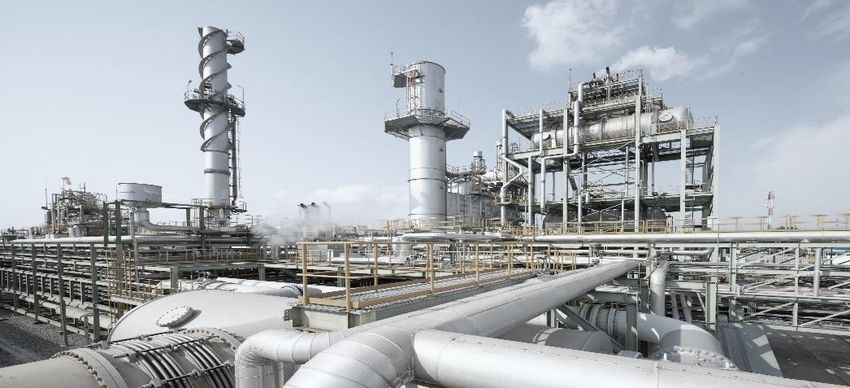
Q1/2021 vs Q1/2020 (YoY) Net Profit

 (Unit : THB million)                                      Net profit +393 MTHB (+25%)

                                Margin Volume                                     •   Gain on sale of GRP
                                Impact  Impact                                        (Net tax)
                       Total       -569    +426
                •   Lower margin due to GE Ph.5 incident
                    and GHECO-One plan outage

                                                                                                            Mainly from lower
                                                                                                            finance cost
                                                       •   Higher dividend from RPCL
                                                       •   Higher share of profit from
                                                           affiliates mainly from XPCL

                                                                                                                                7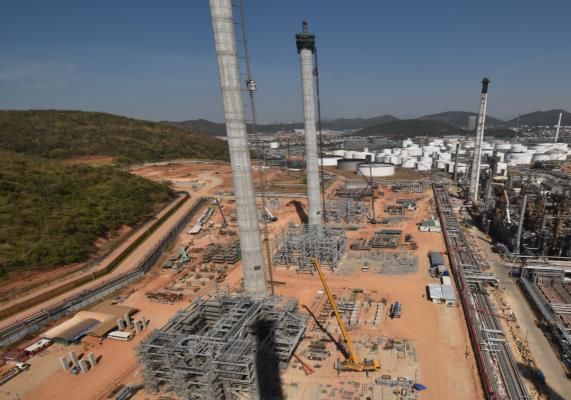
Q1/2021 vs Q4/2020 (QoQ) Net Profit

 (Unit : THB million)                                    Net profit +515 MTHB (+35%)

                                    •   Lower maintenance cost
                                                                                 •   Gain on sale of GRP shares
                                    •   Lower advisory fee and                       & Higher performance
                                        employee benefit

                                                                  •   Lower dividend from RPCL
                                                                  •   Lower share of profit from affiliates
                                        Margin   Volume
                                                                      mainly from XPCL
                                        Impact   Impact
                            Total           -114     +159

                    •   Lower margin GHECO-One’s plan outage
                    •   Higher margin from steam sales to
                        industrial customers

                                                                                                                  8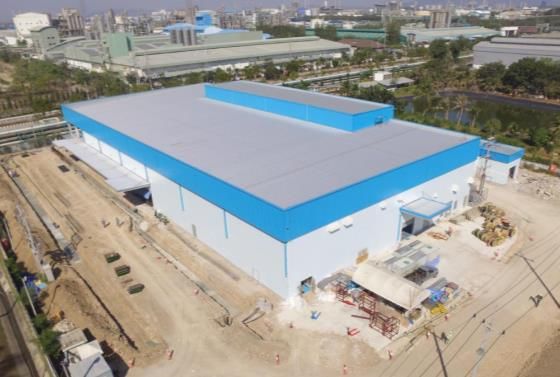
Financial Positions and Debt Profile

                                 Summary of Financial Position                                                            Total Interest-Bearing Debt | THB million

                                  Total Asset                Total Liabilities and Equity                                           Short-term loans
                                  (THB million, %)                       (THB million, %)
                                                                                                                          and current portion of long-term loans

                                                                                                                                THB 15,071 million | 14%
                                      +0.5%                                     +0.5%

                                                                                                                                                                   104,322
         Current Asset 17%                                    4%                              4%    Current Liabilities
                                                       16%                                                                         Non-current portion of
Investment in associates 5%                            6%     19%                             19% Debentures                  long-term loans and debentures

                                                              22%                             22% Long-term borrowing            THB 89,251 million | 86%
        Property, Plant                                39%
                        39%
        and equipment
                                                              11%                             11% Other non-current
        Financial lease                                                                           liabilities
                                                       3%
        and receivable 3%

     Other non-current
                                                       36%    44%                               44% Equity                  As of Q1/2021:
                assets 36%
                                                                                                                            •   Average cost of debt: 3.06%
                                                                                                                            •   Average remaining tenor: 5.3 year

           Total debt to equity and net debt to equity ratio | times                                                                       Credit ratings

                                                               Total Debt to Equity (Total D/E)
                                                               Net Debt to Equity (Net D/E)

                              1.34x                                                                                                BBB-
                                                     1.29x                   1.26x
                                   0.82x                     0.75x                      0.67x                                       AA-

                                                                                                                                 A+(tha)
                               Q1/20                  Q4/20                      Q1/21

                                                                                                                                                                             9
2021 Outlook
Performance Outlook Key Assumptions (Un it: USD/B B L)
Synergy value from acquisition of GLOW is 100
(Unit: USD/BBL)
Dubai Brent Max-Min
Brent Consensus
Consensus
(Max)
expected to be THB >800 million (after tax)
80
in 2021.
60
Demand of electricity and steam in the MTP area
increased by 4%, approximately. 40
In 2021 , average gas price is expected to be higher
20
5% from Q1/2021, while coal price is expected to
maintain from Q1/2021. 0
GLOW Energy Phase 5 Plant resumed to normal
operation in 2-Apr-2021. Insurance payment claim is
ongoing. • Natural gas price is forecasted to increase slightly
in the same direction with crude oil with lag time
GPSC is in the process of sharpening our strategic plan 6 – 12 months.
for responding and dealing with the challenges. - NG price increased slightly in Q1/2021.
- Blended gas cost of SPP portfolio is expected
Project Closing and COD in 2021 10% increase at year-end.
• Coal price
- Coal price increased slightly in Q1/2021.
- Coal price range is expected about US$ 85-90
Solar projects of Rayong Waste to Energy Storage Unit
25 MW in Taiwan Energy Project 30 MWh p.a. per ton (NewCastle) at year-end.
expected to closing expected to COD expected Start of regular
in Q2/2021 in Q2/2021 production in Q2/2021 10GPSC : Q1/2021 Highlight
Financial Performance &
2021 Outlook
Strategic Directions (3S)
• Synergy and Integration
• Selective Growth
• S-Curve
Sustainability at GPSC
Update of Projects
Q&A
11 11Strategic Directions and Growth Strategy | 3S Strategy
Synergy Capture
SYNERGY &
INTEGRATION Customer Centric
ROE Uplift
Thailand Business Development
International Business Development
SELECTIVE GROWTH
Co-investment with PTT
New Businesses
Battery manufacturer with own R&D
S-CURVE BUSINESS System Integrator
Digital Energy
12S1 Synergy and Integration
Synergy and Integration
Q1/2021, the recognized synergy value is Key Synergy Initiatives
approx. THB 224 mm (After tax)
mainly from operation and maintenance, the management • Enhance reliability in Maptaput
of power and steam network integration via Power and Steam Integration
and coal ash management • Aligning best practice to increase
maintenance and procurement
THB >1.6 bn per year
productivity and cost saving
recurring synergy from
• Corporate Function & IT Synergy
Ramp up with full synergy value contribution by 2024
Operational Excellence (OpEx)
Strengthen the core = Foundation for future
• Best-in-class operation
“To be Top of
Operational Excellence • Customer-centric utility service provider
in power and utilities
business” Explore & Innovate
• Build capabilities
• Setup and scale up S-curve and new business
13S2 Selective Growth
Thailand
GPSC Selective Growth
Taiwan
Thailand International
Vietnam
India
Conventional & Renewable Conventional Renewable
China
Myanmar
Way forward to sustainable growth Focusing on power plant projects
by Leveraging PTT Group’s Networking
Renewable
Energy*
10-yr Target 8 GW
88% Commited 12% 70% 30% will be a “new energy platform”
5,055 MW** 5-yr Target In renewable for PTT Group Investing especially in
equity capacity
renewable energy businesses internationally
Conventional
Energy through:
Pooling assets,
resources & Expertise Financial capability
Note: * Renewable energy mentioned on this page covers energy from solar, wind, waste, hydro, etc. 14S3 S-Curve Business
Expansion with
Business Ecosystems
Manufacturing
Scale-up
Commercial
Scale
Pilot projects and One-stop service
smart solution provider
proof of concept
Digital Energy and
Pilot Scale Expand business
R&D / Lab Business Collaboration
• Sharing of experience
• Joint procurement of Electrode Active Materials Key enabler for GPSC’s other s-curves
with strong competitive advantage
• Right to offtake product to Thailand and etc.
Possible acceleration if market develops faster
Development and Achievements
24 February 2021 : 26 March 2021: 29 April 2021 :
GPSC and OR unveiled G-BOX MOU with 9 companies to develop a
Collaboration with Swap & Go
for swappable battery packs of common battery pack and to develop a
150 kWh G-Box, a Battery Energy motorcycles battery swapping platform for charging
Storage System at PTT station stations.
15S3 S-Curve Business
GPSC has built capabilities across different segments of the value chain,
with focus on stationary battery ESS and light duty EV battery pack
Segments Value Chain
Manufacturing
Battery cell Battery disposal &
Battery technology Raw materials
manufacturing recycling
24M and Collaboration with Pilot plant 30MWh
Batteries plan for Own R&D AXXIVA with Scale-up plan
Start of regular production in Q2/2021
LFP battery cell Module/ Energy mgmt. System C&I / Grid
Stationary
manufacturing System design system integration customers
Stationary Battery Own design / Own system /
ESS Own production By CHPP
with partner with partner
Battery cell Module/ Pack Battery mgmt. Battery pack Manufacturing
manufacturing design system assembly & Distribution
Applications
Own production Own design / Own system /
Light-duty EV Outsource
: LFP Battery with partner with partner
battery pack/system
MOU with Swap & GO MOU with Swap & GO
MOU with 9 EV companies MOU with 9 EV companies
Mobility
Own production Own design / Own system /
Heavy-duty EV Outsource
: LFP Battery with partner with partner
battery pack/system
MOU with EVT MOU with EVT
Co- with AXXIVA /
Passenger EV Partner with Partner with
Plan for NMC Outsource
battery pack/system AXXIVA AXXIVA
Battery production
Agreement with AXXIVA Agreement with AXXIVA Agreement with AXXIVA
Status: Operated On plan Future plan 16GPSC : Q1/2021 Highlight
Financial Performance &
2021 Outlook
Strategic Directions (3S)
• Synergy and Integration
• Selective Growth
• S-Curve
Sustainability at GPSC
Update of Projects
Q&A
17 17Q1/2021 | Move towards sustainability
Sustainability & Climate Change Strategy
Sustainability Management Long Term Values Creation Innovative & Sustainable Energy
Framework
To be Listed in Aim to
Power Accessibility
Enhance stability of access by
investing in distributed energy
DJSI NET ZERO
technologies and infrastructure
Human Intelligence
Quality of Life Empowerment Analytics
Empower better living by providing Enhancing our
occupational training program, light for a capability of
Building sustainability analytics
better life program and zero-waste village
performance of
sustainability for Sustainability
our people Strategy
Long Term Value
Creation Innovative
Eco - system & Sustainable
Energy
Eco-system of driving clean energy,
cultivating the Circular Economy concept and
easing environmental impacts
Sustainability
Integration
Embedding sustainability in
our products, processes and
management
Sustainable Innovation
Sustainable Innovation for the
corporation to drive improvement
initiatives through Artificial
Intelligence (AI) and Blockchain,
innovation culture and youth social
innovation
18Sustainability | Net Zero Framework
The route to net zero for utilities
INTERNAL EXTERNAL
Reduce fossil Grow Enhance Trading /
fuel usage renewables infrastructure Offsets
Adopt best practice Execute the growth ESS with renewable Study carbon
operational strategy as planned by energy generation credits, emissions
excellence Develop solar and support and EMS trading schemes,
Retrofit wind power plants Implement digital shadow carbon
non-renewable Integrate distributed transformation pricing, etc.
power plants, etc. solar and Switch to Study and adopt
microgrid, etc. CCUS, etc.
Renewable
Energy
30%
Conventional
Energy
70%
Note: ESS : Energy Storage System
EMS : Energy Management System
CCUS : Carbon Capture, Utilization and Storage 19GPSC : Q1/2021 Highlight
Financial Performance &
2021 Outlook
Strategic Directions (3S)
• Synergy and Integration
• Selective Growth
• S-Curve
Sustainability at GPSC
Update of Projects
Q&A
20 20Project under
Update of Projects construction
Semi-Solid Energy Storage Unit | 30 MWh Rayong Waste to Energy (WTE)
S ta r t o f r e g u l a t i o n SCOD | Q2/2021
production | Q2/2021
Capacity 30
(MWh/yr.) Electricity 9.8
(MW)
SPP Replacement - Stage 1 | Glow Energy Ph. 2 Energy Recovery Unit (ERU)
SCOD | Q4/2022 SCOD | 2023
Electricity 192 Electricity 250
(MW) (MW)
Steam 300 Steam 175
(ton/hr.) (ton/hr.)
21Q&A SESSION
Feedback survey
IR Contact:
Pongsak Plaingam +662 140 4646
Suthathip Charoenkij +662 140 5318
ir@gpscgroup.com
www.gpscgroup.comQ1/2021 Operating Results
Overall operating results of the Company change +/(-)
and its subsidiaries (unit: THB million) Q1/20 Q4/20 Q1/21
YoY QoQ
Operating revenue 18,308 16,532 16,624 (9%) 1%
Cost of sales (excluding depreciation and amortization) (12,943) (11,601) (11,285) (13%) (3%)
Gross profit 5,365 4,931 5,339 (0.5%) 8%
Selling and administrative expenses (418) (528) (434) 4% (18%)
Other operating income 4 5 5 25% (8%)
EBITDA 4,951 4,409 4,910 (1%) 11%
Depreciation and amortization (2,074) (2,046) (2,053) (1%) 0%
EBIT 2,877 2,362 2,856 (1%) 21%
Finance costs (1,041) (965) (974) (6%) 1%
Other non-operating income and expenses 174 133 264 52% 98%
Dividend received and shares of profit of associates and
(68) 367 297 537% (19%)
joint ventures
Income tax expenses (254) (141) (453) 78% 222%
Profit before FX and extraordinary items 1,688 1,757 1,990 18% 13%
Net foreign exchange gain (loss) (30) 12 2 106% (85%)
Net profit 1,658 1,769 1,992 20% 13%
Non-controlling interests (78) (311) (19) (76%) (94%)
Net profit for the Company 1,580 1,458 1,973 25% 35%
Adjusted Net Income 1,948 1,813 2,359 21% 30%
Gross profit margin (%) 29% 30% 32% 3% 2%
Net profit margin (%) 9% 9% 12% 3% 3%
Adjusted Net Income margin (%) 11% 11% 14% 3% 3%
23S3 GPSC Battery : G-CELL and Applications
G-CELL Core Values
Semi-Solid Battery Unique Design
Safer
Greener
Shorter Remove 40% No binder Low Risk
Reliable Process Inactive Material Needed of Contamination
Application and Target Market for Semi-Solid Energy Storage Unit (30 MWh p.a.)
Target applications Target market
Energy - Charging station PTT Group network
Commercial &
Storage Industrial - Industrial Estate
Reputable commercial
Micro-Grid - Remote Area & Industrial
Residential (RESS) - Property Development Government offices,
E-Mobility and others - ESS Mobility and others University, Hospitals
E-Mobility
- Battery for EVs EVs Provider
- Battery swapping (Bus, Motorcycle, Tuktuk)
Lead Acid Replacement Battery Swapping Battery Pack Energy
EV-Bus ESS x EV Charger & Car Charing for EV Platform 24S3 Applications and Achievement in Re ne wable & S ma rt E ne rgy P roje ct s
6 MW Smart Energy Project at Suranaree University
SMART ENERGY MANAGEMENT To create a low carbon university
✓ 1.39 MW renewable energy (solar roof + floating) AI &
✓ 1.2 MWh ESS, Renewable optimization and Zero-import building 1.74 MW 4.312 MW 100-200 kWh Smart Energy
Solar Rooftop Floating Solar Lithium-ion BESS Platform
✓ Blockchain P2P energy trading, EV chargers and Artificial Intelligence
High efficiency BESS with management of solar power generation
Blockchain-based smart grid and AI
Cutting-edge innovation and smart energy platform
@Wangchan Valley
Smart Natural Innovation Platform
SMART Energy Management
Clean Energy Generation
Flexibility Distributed
Generation
Cost Efficient No Clean
Energy Shedding
ESS FOR GC’s INNOVATION CENTER First offshore floating solar farm
(Launched: Feb 2020) 100 kW installed capacity for seaside of PTT Tank
✓ Increase gas engine efficiency
✓ Peak shift with ESS
✓ 250kW/1.5MWh
✓ Emergency backup power PTT Tank : Cut the electricity cost and reduce carbon dioxide emission
GC developed special plastic “InnoPlus HD8200B”
CHPP designed and installed the floating solar system 25Sustainability at GPSC | CSR / CSV / SE
Embedded sustainability to our strategy to build
“Long Term Value Creation, Innovation & Sustainable Energy”
LIGHT FOR BETTER LIFE GPSC YOUNG SOCIAL INNOVATOR
Small-scale Solar PV in remote areas
Solar Rooftop to Schools in Rayong
▪ GPSC delivered Solar Rooftop
System to 3 schools (25.9 kW)
in Wangchan Valley in Rayong
▪ Lower emission of green house
gas 93.5-187 tons of
carbon/year
2 golden prizes and 1 silver
Solar Rooftop to Hospital in Koh Sichang prize from 2020 The 6th
World Invention Innovation
Contest (WiC) in Seoul
▪ GPSC and Thailoil delivered
Solar Rooftop System (53.46
kW) to Koh Sichang Hospital
to improve energy security of ZERO WASTE VILLAGE
the hospital
Solar Rooftop to Hospital in Mae Hong Son
▪ GPSC and TOP delivered Solar
Rooftop System (40.5 kW) to
Thanyarak Hospital in Mae Hong
Son Delivering a waste management learning center
to Baan Phai community in Rayong
26GPSC’s Prudent Financial Policy
GPSC’s FINANCIAL POLICY
1 Net Debt to Equity ≤ 1.0x
2 Net Debt to EBITDA ≤ 4.0x
3 Dividend Policy | Minimum dividend at the rate of not less than
30% of the net profit
according to the financial statements of the Company after the deduction of tax, reserved funds
as required by law (with additional conditions)
27GPSC Power Plant Portfolio (1/2)
Equity
Total Equity Power Operating Industrial
Shareholding Steam
Name Type capacity capacity Power water COD Tenor
(%) (T/H)
(MW) (MW) capacity (Cu.m/H)
(MW)
IPP
Sriracha IPP GPSC (100%) 700 700 700 - 80 2000 25
Glow IPP IPP GLOW (95%) 713 677 677 - - 2003 25
Huay Ho IPP GLOW (67%) 152 102 102 - - 1999 30
GHECO-One IPP GLOW (65%) 660 429 429 - - 2012 25
XPCL IPP GPSC (25%) 1285 321 321 - - 2019 29
RPCL IPP GPSC (15%) 1400 210 210 - - 2008 25
Total IPP 4,910 2,439 2,439 - 80
SPP
CUP-1 SPP GPSC (100%) 226 226 226 890 720 2006 10-15
CUP-2 SPP GPSC (100%) 113 113 113 170 510 2008 15
CUP-3 SPP GPSC (100%) - - - 280 770 2009 15
Rayong Expansion (CUP-3) SPP GPSC (100%) 15 15 15 - - 2019 n/a
CUP-4 SPP GPSC (100%) 49 49 49 140 - 2019 Long-term
Glow Energy Phase 1 SPP GLOW (100%) - - - 250 1,340 1994 -
Glow Energy Phase 2 SPP GLOW (100%) 281 281 281 300 1,180 1996 3
Glow Energy Phase 4 SPP GLOW (100%) 77 77 77 137 2,050 2005 25
Glow Energy Phase 5 SPP GLOW (100%) 328 328 328 160 - 2011 -
Glow SPP 2/ GLOW SPP 3 SPP GLOW (100%) 513 513 513 190 150 1999 25
Glow SPP 11 Phase 1 SPP GLOW (100%) 120 120 120 - 360 2000 25
Glow SPP 11 Phase 3 SPP GLOW (100%) 42 42 42 - - 2006 -
Glow SPP 11 Phase 2 SPP GLOW (100%) 110 110 110 - 212 2012 25
Glow Energy CFB 3 SPP GLOW (100%) 85 85 85 79 - 2010 -
IRPC-CP Phase 1 SPP GPSC (51%) 45 23 23 86.7 - 2015 25-27
IRPC-CP Phase 2 SPP GPSC (51%) 195 99.4 99.4 66.3 - 2017 25
Note: Equity capacity includes 100% stake in GLOW, ERU and GRP1
28GPSC Power Plant Portfolio (2/2)
Equity
Total Equity Power Operating Industrial
Shareholding Steam
Name Type capacity capacity Power water COD Tenor
(%) (T/H)
(MW) (MW) capacity (Cu.m/H)
(MW)
NNEG SPP GPSC (30%) 125 38 38 9 - 2016 25
NNEG Expansion SPP GPSC (30%) 60 18 18 3 - 2020 21
BIC-1 SPP GPSC (25%) 117 29.25 29.25 5 - 2013 25
BIC-2 SPP GPSC (25%) 117 29.25 29.25 5 - 2017 25
Total SPP 2,618 2,196 2,196 2,771 7,292
VSPP and others
Rayong WTE (under construction) VSPP GPSC (100%) 9.8 9.8 - - - 2021 18
Glow Energy Solar Plant VSPP GLOW (100%) 1.55 1.55 1.55 - - 2012 25
CHPP VSPP GPSC (100%) 5 5 5 - - 2008 30
CHPP (Solar) VSPP GPSC (100%) 5 5 5 - - 2016 25
ISP1 Solar GPSC (99%) 20.8 20.59 20.59 - - 2017 20
GRP (NPS, WXA, PPS) VSPP GPSC (50%) 39.5 19.75 19.75 - - 2014-15 25
GRP1 (Solar in Taiwan) -
Solar GRP (90%) 55.8 25.11 - - 2016-21 20
(Under closing process)
TSR (SSE1) VSPP GPSC (40%) 80 32 32 - - 2013 25
NL1PC Hydro GPSC (40%) 65 26 26 - - 2019 24
Chonburi Clean Energy (CCE) VSPP GLOW (33%) 8.6 2.87 2.87 - - 2019 20
Private PPA Solar GPSC Gr. (100%) 21.90 21.90 4.08 2018-21 Long-term
Total VSPP and others 313 170 117 - -
ERU
ERU (under construction) Cogen GPSC (100%) 250 250 - 175 - 2023 25
Total ERU 250 250 - 175 -
Total capacity 8,091 5,055 4,752 2.946 7,372
Note: Equity capacity includes 100% stake in GLOW, ERU and GRP1
292021 Maintenance Schedule | Sriracha and Rayong Plants
2021
Site Description Duration Q1 Q2 Q3 Q4
Jan Feb Mar Apr May Jun Jul Aug Sep Oct Nov Dec
GTG-13 22 Days 12/7 MI 2/8
CUP-1
22 Days 12/7 3Y 2/8
HRSG-13
GTG-21 22 Days 9 MI 30
CUP-2
HRSG-21 22 Days 9 3Y 30
5 Days 15/11 RMI 9/12
GTG-41
CUP-4
HRSG-41 11 Days 27/6 1Y 7/7
HRSG#1 14 Days 15/11 3Y 28/11
14 Days 15/11 3Y 28/11
HRSG#2
SRC
Steam Turbine.10 25 Days
15/11 CI 23/11
GT-11 8.33 Days
RDF 7 Days 7 MNI 13
BMH Machine
Notes: Rayong Site Notes: Sriracha Site
GTG GTG
HRSG
HGPI Hot Gas Path Inspection for Gas Turbine 14 days 1Y One Year Inspection HRSG CI Combustion Inspection for Gas Turbine 8 days HRSG
11 days
MI Major Inspection for Gas Turbine 22 days 3Y Three Year Inspection HRSG HGPI Hot Gas Path Inspection for Gas Turbine 26 1Y One Year Inspection HRSG 8 days
14 days
STG days 3Y Three Year Inspection HRSG 33 days
Others
Minor Minor Inspection for Steam Turbine 15 days 1Y One Year Inspection NG Station Test MO Major Overhaul for Gas Turbine 33 Other
Online
1MO 2nd Major Overhaul for Steam Turbine 23 days 5Y Five Year Inspection NG Station (NDT) days 1Y One Year Inspection NG Station Test Online
Online
2MO 2nd Major Overhaul for Steam Turbine 27 days FO Forced Outage RCIE Rotor and Casting Inspection Evaluation 49 5Y Five Year Inspection NG Station (NDT) Online
Depending on
AB days FO Forced Outage Depending on physical damage
physical damage
1Y One Year Inspection Aux. Boiler 11 days
3Y Three Year Inspection Aux. Boiler 13 days
302021 Maintenance Schedule | IRPC-CP
2021
Main Descripti Q1 Q2 Q3 Q4
Duration
Unit on
Jan Feb Mar Apr May Jun Jul Aug Sep Oct Nov Dec
Block 1
CTG 21 B 20 Days 20
HRSG 21 B 20 Days 20
CTG 22 B 20 Days 20
HRSG 22 B 20 Days 20
STG 23 MI 20 Days 20
Block 2
CTG 31 B 20 Days 20
HRSG 31 B 20 Days 20
CTG 32 C 22 Days 22
HRSG 32 C 22 Days 22
STG 33 MI 20 Days 20
Aux. 15
YI 15 Days
Boiler
Notes:
MI Major Inspection
YI Yearly Inspection Aux Boiler 15 days
B CTG/HRSG Inspection Level B 20 days
C CTG /HRSG Inspection Level C 22 days
Excluded 1 Day maintenance
312021 Maintenance Schedule | GLOW's Main Units
2021
Main Units Description Duration Q1 Q2 Q3 Q4
Jan Feb Mar Apr May Jun Jul Aug Sep Oct Nov Dec
GHECO-ONE Minor Inspection 37 Days 1/1 2Y 6/2
GIPP: UNIT 1 Minor Inspection 5 Days 27/9 3Y 1/10
GIPP: UNIT 2 Minor Inspection 5 Days 10 3Y 14
CFB 3 Minor Inspection 7 Days 22/4 3Y 12/5
Phase 5 Minor Inspection 5 Days 29/3 1.25 2/4
GSPP11 18 3Y 31
Minor Inspection 14 Days
(Plant 2)
GSPP11
Major Inspection 5 Days 10 5.7Y 14
(Plant 2)
32Fair Value Measurement of Net Assets from Acquisition of Glow
unit: THB million
Book Value of Fair Value of Differential Amortization of Fair Value Measured from Net Assets acquired
Items from GLOW during 2019 - 2051
GLOW GLOW Value
(Computed based on 100% of GLOW shares)
107,655 155,500 47,845 THB million
Assets
2,000
(56,246) 1,800
Liabilities (66,497) (10,251)
1,600
Net Assets of GLOW at 51,409 1,400
89,003 37,594
14 March 2019
1,200
Non-Controlling 1,000
(32,092)
interests at 30.89%
800
Total Net Asset
obtained GLOW at 56,911 600
69.11% 400
Goodwill 36,090 200
0
Proportion of
2019 2021 2023 2025 2027 2029 2031 2033 2035 2037 2039 2041 2043 2045 2047 2049 2051
acquisition cost 93,001
69.11%
GPSC has completed the acquisition of 69.11% on 14 March 2019 at a total of THB 93,001 million, the company
has measured the fair value of GLOW net assets as follows:
• The fair value uplift of THB 37,594 million from Purchase Price Allocation (PPA)
• The fair value recognition of net assets acquired from GLOW will be amortized yearly (based on the remaining
period of the contract, 5 to 31 years).
• Goodwill will be subjected to an impairment test on a yearly basis.
33Disclaimer
The information contained here is being furnish on a confidential basis for discussion purposes only and only for the use of the recipient, and may be
subject to completion or amendment through the delivery of additional documentation. Except as otherwise provided herein, this document does not
constitute an offer to sell or purchase any security of engage in any transaction. The information contained herein has been obtained from sources
that Global Power Synergy Public Company Limited (“GPSC”) considers to be reliable; however, GPSC makes no representation as to, and accepts no
responsibility or liability for, the accuracy or completeness of the information contained herein. Any projections, valuations and statistical analyses
contained herein have been provided to assist the recipient in the evaluation of the matters described herein; such projections, valuations and
analyses may be based on subjective assessments and assumptions and may utilize one among alternative methodologies that produce differing
results;
34 accordingly, such projections, valuations and statistical analyses are not to be viewed as facts and should not be relied upon as an accurate34
representation of future events. The recipient should make an independent evaluation and judgement with respect to the matters contained herein.You can also read