SEA-Salga-SACN City Power Presentation - Presented by: Paul Vermeulen Manager DSM and SSM City Power - Sustainable ...

Page created by Carol Reyes
 
CONTINUE READING
SEA-Salga-SACN City Power Presentation - Presented by: Paul Vermeulen Manager DSM and SSM City Power - Sustainable ...
SEA-Salga-SACN
City Power Presentation

 Presented by: Paul Vermeulen
    Manager DSM and SSM
          City Power
SEA-Salga-SACN City Power Presentation - Presented by: Paul Vermeulen Manager DSM and SSM City Power - Sustainable ...
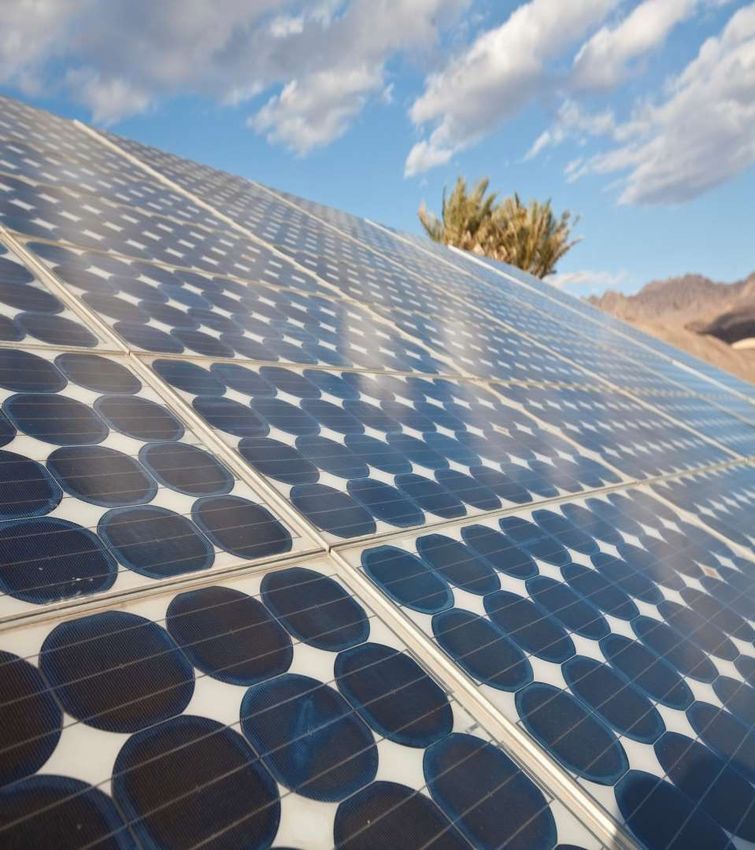
Contents
1   Drivers of change

2   Key trends

3   What is in the headlines?

4   What are the key challenges

5   What are the key opportunities

6   What is COJ doing?
SEA-Salga-SACN City Power Presentation - Presented by: Paul Vermeulen Manager DSM and SSM City Power - Sustainable ...
Drivers of change

01
SEA-Salga-SACN City Power Presentation - Presented by: Paul Vermeulen Manager DSM and SSM City Power - Sustainable ...
Transformational change in P&U is being driven
                                                                    by numerous factors
                                                   Significant investment is required to
                                                   update or replace power, gas and
                                                   water assets.

                                                               Infrastructure
     Aging workforce and challenges of                                                                  Generation mix is shifting to cleaner
                                                                investment
     the new digital economy require                                                                    sources, including natural gas and
                                                                                    Changing
     effective knowledge transfer and          Talent and                                               renewables, and is becoming more
                                                                                   energy mix
     fresh thinking.                            diversity                                               decentralized.
                                                                                     and DG

                                                                                                             Customers are being offered choices
New and powerful entrants have
begun to offer customers innovative
                                            New                 Sector in                  Empowered         to manage their energy use, through
                                         competitors         transformation                 customers        both distributed generation (DG) and
home energy management products
                                                                                                             energy management solutions.
and services.

                                                Regulatory
                                               frameworks                          Digitization
       Regulatory compact is under                                                                  Smart meters, “big data” and
       pressure to accommodate changing                         Market and                          analytics can be used to optimize
       customer demands and encourage                             policy                            energy delivery, improve energy
       innovation.                                               reforms                            efficiency and enhance customer
                                                                                                    experiences.

                                                   Federal and state mandates are
                                                   driving restructuring, creating
                                                   incentives and imposing new rules.

                                                                                                                                                4
SEA-Salga-SACN City Power Presentation - Presented by: Paul Vermeulen Manager DSM and SSM City Power - Sustainable ...
Key trends

02
SEA-Salga-SACN City Power Presentation - Presented by: Paul Vermeulen Manager DSM and SSM City Power - Sustainable ...
Global demand for electricity is expected to
                                                                increase at 2.1% CAGR through 2040 with
                                                              most growth coming from emerging markets

Growth in electricity demand by region, 201240 (CAGR)                                    Electricity generation in OECD and non-OECD countries

                                                            4.0%                         30.0

                                                                           3.3%          25.0

                                              2.7%                                       20.0
                                2.5%
    Global average: 2.1%
                                                                                         15.0
                  1.4%
                                                                                         10.0
     0.8%
                                                                                           5.0

                                                                                           0.0
    OECD       E.Europe        Latin  Middle East           Africa       Asia (inc                 1990      2012       2020      2025       2030       2035      2040
                Eurasia       America                                     China,
                                                                          India)                                        OECD            Non-OECD
Source: World Energy Outlook (WEO) 2014                                                  Source: WEO 2014

CAGR: Compound Annual Growth Rate – The year-over-year growth rate of an investment over a specified period of time
OECD: Organisation for Economic Co-operation and Development, an international economic organisation of 34 countries, founded to stimulate economic progress and world trade

►     World electricity demand is expected to increase by more than three-fourths over the period 201240, growing at an average rate of
      2.1% per year.
►     The most dramatic growth in demand will come from Africa (4% CAGR).
►     Asia, led by China and India, is also expected to experience dramatic growth in electricity demand of 3.3% CAGR through 2040.

                                                                                                                                                                               6
SEA-Salga-SACN City Power Presentation - Presented by: Paul Vermeulen Manager DSM and SSM City Power - Sustainable ...
Meeting this demand will require enormous
                                                                    infrastructure investment of more than
                                                                            US$23t in power and gas alone

Investment in supply infrastructure, 201440 (2013 US$b)                             Drivers of capex

                            Total       Total        Total           Total                              ►   Aging power stations
                                                                                     Replacement
                            power       power        gas
                                                                                     cycle              ►   High expenditure on asset replacement
                            plant       T&D          T&D*
Europe                          2,109          970             303           3,382
E.Europe/Eurasia                  835          526             417           1,778   Environmental      ►   Government-imposed environmental
                                                                                     targets                targets imply massive spend
Middle East                       479          273             241            993
India                            1227          788             70            2,085
Africa                            776          848             241           1,865                      ►   Power demand to grow especially in
                                                                                     Demand growth
                                                                                                            emerging markets
Asia-Pacific                    4,180        3,536             588           8,304
OECD Americas                   1,952        1,215             586           3,753
Non-OECD Americas                 593          530             93            1,216
                                                                                        More than US$23.3t globally in power and gas
World                          12,151        8,686        2,539          23,375

* Gas T&D values are for the period 2014-35 in 2012 US$b
Sources: IEA, WEO 2014; World Energy Investment Outlook 2014

In addition, the OECD estimates that more than US$1t per annum needs to be invested globally just to replace and maintain water infrastructure.

                                                                                                                                                    7
SEA-Salga-SACN City Power Presentation - Presented by: Paul Vermeulen Manager DSM and SSM City Power - Sustainable ...
Coal-fired generation is expected to continue to
                                                                  account for a significant share of global
                                                                                         electricity supply
Global coal-fired electricity generation is expected to grow from 9.2TWh in 2012 to 12.2TWh in 2040,
representing a CAGR of 1.02%.

Coal-fired electricity generation                                                        Global electricity generation by source
                                                                                                    22,721TWh                             40,104TWh
                16
                14                                                                                      21%
                                                                                                                                              33%
                12                                                                                      11%
 Trillion kWh

                10                                                                                                                            12%
                                                                                                        22%
                 8
                                                                                                                                              24%
                 6
                 4                                                                                      41%
                 2                                                                                                                            31%

                 0                                                                                      5%                                    1%
                  2010      2015       2020        2025   2030       2035     2040                     2012                                 2040
                                   United States     Rest of World                            Oil      Coal       Natural gas       Nuclear    Renewables
Source: US Energy Information Administration International Energy Outlook 2013          Source: IEA WEO 2014
Reference

►               Coal will still be a dominant fuel source for power generation in 2040, accounting for more than 31% of global generation, but there will be a
                massive decline from its 40%-plus share today.
►               Natural gas-fired generation is expected to maintain its 22%-24% share of global generation, which will still imply a huge expansion in natural
                gas absolute volumes.
►               The real global growth story of course is renewables, which are expected to overtake coal as the primary source of power generation by 2040.

                                                                                                                                                                  8
SEA-Salga-SACN City Power Presentation - Presented by: Paul Vermeulen Manager DSM and SSM City Power - Sustainable ...
Fossil fuels will hold a dominant position in
                                                          global electricity generation for several
                                                     decades, with renewables gaining ground …

New capacity additions by region, 201440

                                                                                             25%
                                  43%             40%
                                                                        49%
         63%                                                                                 13%                  60%
                                                                                                                               69%
                                   1%              5%
                                                                        6%
                                  34%                                                        43%
                                                                        14%                                        4%
          2%
                                                  46%
                                                                                                                                5%
         28%                                                                                                      32%
                                                                        30%                                                    19%
                                  17%                                                        19%
           3%                                      9%                                                              3%               6%
         3%                        5%                                   1%                   1%                  2%            0%
    Latin America                Africa       Middle-East        Asia, Asia-Pacific   E.Europe/Eurasia      OECD Americas   OECD Europe

* Renewables include hydro-power plants.
                                                   Oil    Coal    Gas     Nuclear     Renewables*
Source: IEA WEO 2014

►   Renewables will represent the lion’s share of new capacity installed over the next couple of decades in every region.

                                                                                                                                          9
SEA-Salga-SACN City Power Presentation - Presented by: Paul Vermeulen Manager DSM and SSM City Power - Sustainable ...
… and growth in renewable energy investment
                                                                         shifting to emerging markets

Non-hydro renewables share of power generation                                    Investment in renewables by region, 2013
by region
                                                                           8.2%                                                         Middle East & Africa
                                                                                                  Oceania
                                                                                                  US$9b                                 US$9b

                                                             5.7%                 Central &                          4%4%
                                                                                  South America                 5%                               Europe
                                            4.9%                                                                                  24%
                                                                                  US$12b                                                         US$57b

                           3.1%
                                                      2.8%                                               22%
                                     2.0%                           1.9%          North America &
                    1.3%                                                          Caribbean
    0.2% 0.4%                                                                     US$52b
                                                                                                                                                 Asia
                                                                                                                            41%
    Middle East    Asia-Pacific        North          Central &      Europe                                                                      US$98b
     & Africa                        America &         South
                                     Caribbean        America                     Total = US$237b

                                    2002      2012                                Solar PV has attracted the highest annual investment for the past three
                                                                                  years (US$112b in 2013).
Source: BP Statistical Review of World Energy, 2013                               Source: EY analysis of BNEF data

►    For most regions, the share of non-hydro renewables in the                   ►   Investment in renewable energy sources across Europe and
     generation mix at least doubled between 2002 and 2012.                           North America peaked in 2011 at $108b and $62b, respectively.
►    In Europe, driven by subsidies and government incentives, the                ►   Investment is shifting to emerging markets, led by China as they
     share of non-hydro renewables in total generation quadrupled from                pursue clean power sources and reduce dependence on fossil fuel
     2% in 2002 to just over 8% in 2012.                                              generation.

                                                                                                                                                               10
State mandates and the need for energy
                                                        efficiency are driving the deployment of
                                                               smart meters across the globe …

Expected smart meter penetration (by region, 201222)

                                                                 “Smart technology has already cut load
                                                                 growth for utilities by half through energy
                                                                 conservation. Adding distributed
                                                                 generation and storage systems would
                                                                 accelerate that trend.”
                                                                                                 – GTM Research

Source: Navigant Research report, 2013

                     smart meters are expected to be installed           CAGR is expected in the smart meter
                     by 2022, (currently 313m), bringing the             revenue in Europe through 2020, making it
      1.1b           global market for smart meters to US$22b
                                                                 9.4%    the fastest growing region.
                     by 2020.

                     penetration to be achieved in US with the           of overall shipments of smart meters in
                     deployment of 65m by 2015. Almost                   2012 were attributable to Asia-Pacific and it
 45%-50%             US$3b has been invested in smart meters
                                                                 49.2%   is expected to remain the largest regional
                     in the US.                                          market in terms of volume.

                                                                                                                     11
Although recent electrical energy
                                      sales were flat growth is expected

* Excludes Sandton, Soweto; Natural Gas represents piped gas from eGoli gas   14
What is in the headlines

03
The latest headlines
                                                         Nuclear Energy: a 'secure' option for South Africa     BRICS bank a global game changer , says Eskom’s
Load shedding drags down sub-Saharan growth
                                                         Although South Africa could procure more energy        Molefe: The launch of the Brics New Development
report Gross domestic product (GDP) growth rate in       from other African countries to help plug its energy   Bank would change global development finance,
sub-Saharan Africa will average 4.2% in 2015,            gap, nuclear energy would be a more secure option      said Eskom‟s Brian Molefe on Thursday. “They will
according to the latest World Bank report. In its        in the long run, says former South African Nuclear     talk about global development finance before and
Global Economic Prospects report for June 2015, the      Energy Corporation CEO Dr Rob Adam. He told            after Ufa,” said Molefe, acting CEO of South Africa‟s
World Bank made a 0.4% downward revision of the          attendees at a South African National Energy... Full   power utility and head of the nation‟s section of the...
                                                         Article                                                Full Article
region's GDP growth rate. The report attributed this
to... Full Article

                                                         Solidarity launches plan to help households in           Angola says to spend $432m on electricity
                                                         unlikely event of electricity blackout: Trade            meters: Angola's government plans to spend
                                                         union Solidarity, in conjunction with KragDag            $432-million to roll out over a million electricity
The National Energy Regulator of South Africa                                                                     meters by 2017, the State news agency said, in
(Nersa) on Monday rejected Eskom’s application for       and Maroela Media, has launched an
                                                                                                                  a move that could help boost revenues for
a further 2015/16 tariff hike in addition the 12.69%     emergency plan to assist households in the               power producers. Energy Minister Joao
already granted for the year. Nersa chairperson          event of a total power blackout, owing to the            Baptista Borges said the meters would be
Jacob Modise announced that, owing to a number of        ongoing problems at State-owned electricity              linked to a prepaid system, which is... Full
deficiencies in the application, the regulator... Full
                                                         provider Eskom. The plan offered practical tips          Article
                                                         on how households could... Full Article
Article

                                                                                                                                                                 16
What are the key challenges

04
Power and Utilities: Key challenges and risks

Key challenges:                                    The top 10 Global risks:
►   Load shedding                                  ►   Compliance and regulation
►   Theft (copper) and vandalism                   ►   Commodity price volatility and access
►   Economic downturn and increasing electricity       to competitively priced long-term fuel
    costs                                              supplies
►   Municipal finances                             ►   Political intervention in power and
►   Skills and capacity shortages                      utilities (P&U) markets
►   Service delivery protests                      ►   Uncertainty in climate policy and
►   Illegal connections                                carbon pricing
►   State of infrastructure and development        ►   Significant shifts in the cost and
    affordability                                      accessibility of capital
►   Industry direction – embedded generation,      ►   Capital project execution
    alternative energy, technology (DG), etc.      ►   Economic shocks and resulting short-
                                                       term energy demand shocks
                                                   ►   War for talent
                                                   ►   Aging generation and network
                                                       infrastructure
                                                   ►   Managing planning and public
                                                       acceptance

                                                                                                18
What are the key opportunities

05
Utilities need to innovate across the value chain
        to derive competitive advantage and turn
             disruptive threats into opportunities
                         The top 10 opportunities:

                         1. Rising emerging markets’ energy demands
                            (including poverty reduction and access to
                            power)

                         2. Acquisitions or alliances to gain new
                            capabilities (including growing skills base)

                         3. Growth in energy and ancillary services
                            markets (including sustainable jobs)

                         4. Enhancing relationships with external
                            regulatory and compliance bodies

                         5. Improving public perceptions (including
                            customer control)

                         6. Increased focus on investor relations
                            programs and communications (including
                            security of supply to drive investor appetite)

                         7. Integration of distributed energy resources
                            (including necessity to innovate)

                         8. Increased investment in generation capacity
                            and delivery infrastructure in emerging
                            markets (including security of supply and
                            network investment)

                         9. Rising energy innovation in emerging markets

                         10.Improving onshore and offshore wind supply
                            chain efficiency

                                                                           20
In summary
►   Global demand for electricity is expected to increase more than two-thirds between now and 2040.
    ►   Meeting electricity demand will require about US$21t of investment in power infrastructure over this period.
    ►   This amount more than doubles when gas pipeline and water infrastructure investment is included.
►   Fossil fuel generation is expected to remain a significant part of the global generation mix in coming decades.
    ►   Coal-fired generation is expected to continue to account for a significant share of global electricity supply
    ►   The shift to renewable energy is a global growth trend with investment shifting to emerging markets.
►   Utilities can turn disruptive threats into opportunities by:
    ►   Investing in smart metering and grid modernisation for a more intelligent, responsive and reliable network.
    ►   Expanding beyond the meter service offerings such as demand response and home energy management.
    ►   Investing in distributed generation, energy storage and microgrids.
    ►   Optimising the capture, storage and analysis of big data from smart meters and intelligent devices.
►   African power and utilities is always a hot topic in the media
►   Utilities need to innovate across the value chain to turn disruptive threats into opportunities
    Challenges:                                                                  Opportunities:
    ►   Load shedding                                                            ►   Rising emerging markets’ energy demands.
    ►   Theft and vandalism                                                      ►   Growth in energy and ancillary services markets.
    ►   Municipal finances                                                       ►   Enhancing relationships with external regulatory and
                                                                                     compliance bodies and the customer
    ►   Aged infrastructure
                                                                                 ►   Increased focus on investor relations programs
    ►   Skills and capacity shortages
                                                                                 ►   Rising energy innovation in emerging markets
06   City of Johannesburg

22                               22
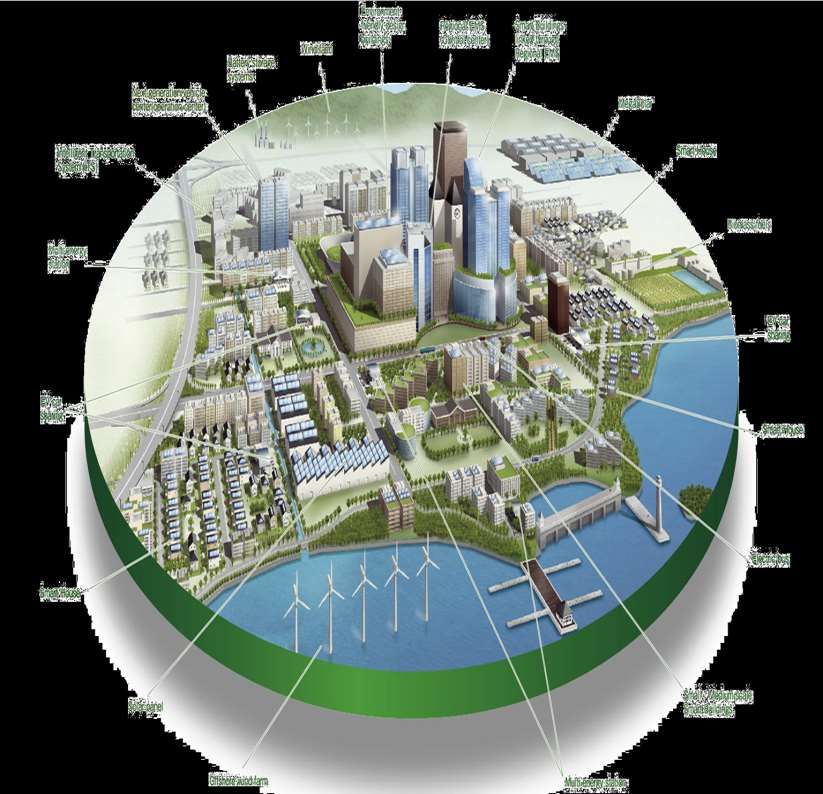
A City of the future…

             Interconnected

               Integrated

              Participatory

                Efficient

                Sharing

             Distributed GX

             Energy Diverse

                 Smart
1. Improved quality of life and development-driven resilience for all
2. Provide a resilient, liveable, sustainable urban environment – underpinned by
   infrastructure supportive of a low-carbon economy
3. An inclusive, job-intensive, resilient and competitive economy that harnesses
   the potential of citizens
4. A high performing metropolitan government that pro-actively contributes to and
   builds a sustainable, socially inclusive, locally integrated and globally
   competitive Gauteng City Region
                                               - Growth and Development Strategy (GDS) 2040

                                                                                    24
A future view of energy availability

       Electricity                 Natural Gas                Automotive Fuels      How do we manage this
                                                               Automotive Fuels
• In the short to medium term (without a bankable anchor project) the increase of piped natural gas
   resources to the City is unlikely (for power generation purposes) and this won’t add significantly
   to the diversification of energy supply and security;
• The current electricity business model has a key asset in terms of the network (wires) but limited
   short term options for diversification exists (Eskom, Kelvin);
• The future electricity business model will be based on the utilisation of the network (wires) as
   an asset and:
    – diversify the input sources of energy (Distributed generation, PV, Batteries Storage) to
      become more resilient, cleaner and less dependant on the national grid;
    – be able to use the grid in the trading of electricity. This will be dependent on the smart grid
      and sufficient telecommunications infrastructure (TELCO) and
    – provide value added services to customers to negate anticipated revenue losses
• New electrical technologies innovation makes it a critical point for GHG emissions projects           25
Supply and demand options
                                                                                  available to the City
                                                                           A combination of these sources leads to
   Technology options                                                      increases diversity in the supply mix and
   (with high level consideration of technical,                            decrease net emissions.
   economic and market potential)

 National grid    Kelvin upgrade   Ops. efficiency        Demand
                                                                               + Ownership options
                                                                                    (besides national grid)

                                                        management                  • Utility owned
                                                      Energy Efficiency             • Customer owned (own supply)
                                                                                    • Third party / customer owned (grid supply /
                                                                                      wheeling)
                                                                                    • Partnerships (e.g.. PPP)

  Demand          Fuel switching WTE & landfill gas    Cogen and biogas
  reponse              (gas)
                                                                               +     Opportunity to be utilised as
                                                                                     an embedded or distributed
                                                                                     solution
                                                                                     (whether likely to be pursued as distributed or
                                                                                     embedded/onsite solutions)
Gas turbines     Solar (PV and CSP) RE incl Wind      Energy storage

                                                                                  Greener options
                                   Other technology

                      …            innovations including Joburg
                                   Water Hydro conduit Dams
                                                                                                                                       26
  Nuclear
Utilities globally are grappling
                                                               with these challenges

Largest generation company in the US       RWE is one of Europe’s five leading      Germany’s biggest utility distributing
and a vertically integrated utility that   electricity and gas companies – i.e. a   across Europe – vertically integrated
includes a retail business.                generation, trading and distribution     (Gx, Tx & Dx).
                                           business.
                                                                                    Move to “carbon-lite” electricity grid;
                                            “Our traditional business model is      “spinning off” conventional, centralised
                                            collapsing under us”. Referring to      fossil fuel generation assets; focusing
2010               2014                     flat demand for electricity             instead on distributed generation,
                                            - November 2013, Peter Terium,          including solar, storage, and micro-grids
 “As part of our continued
                                            CEO of RWE
 commitment to consumers, NRG                                                       “I think everyone understands at this
 has embraced the idea of                                                           point that value creation is moving
 enabling customers to make their           “A significant part of our business     downstream, to the customer, from
 own energy choices.” - David               model is now facing new                 the commodity side to the solution
 Crane, CEO of NRG                          challenges,”                            side. So E.on is striving hard in
                                            “Whatever we do in terms of cost        Europe to go to those parts of the
 “Sustainability is our reality             and Capex-cutting won’t fully           value chain where we are close to
 We're partnering with businesses           compensate the profit loss we see       our 25 million customers, where we
 to build a more sustainable                in conventional power generation.”      enable them and can share with
 future.”                                   RWE CFO, Bernhard Guenther              them the advantages of efficiency.
                                                                                                                   - 5 Dec 2013

       Moving from volumetric to value will take courage, but some are taking the first steps

                                                                                                                             27
Shareholder Mandate

Drive                           Whilst
• Increasing and securing the   • Reducing the burden of cost on
  supply of energy                the consumer
• Acquiring electricity from    • Balancing the financial
  renewable and alternative       sustainability of the business,
  sources                         delivery of services and
                                  Shareholder goals
• Reducing greenhouse gas
  emissions                     • Moving to the “Smart City”
                                  concept via a Smart Grid and
• Strategic use of a mix of       integration with other City
  technologies and energy         initiatives (e.g. transport)
  sources to achieve goals

                                                                    28
Time of Use Tariffs                  Basket of energy options

Load shedding            IPP PV                Renewable             City – Waste to

                                      240
  mitigation           applications            Energy tariff             Energy

Embedded GX             PPA MTN /              Rural Gas/PV           City – Landfill

                                                                                          30
                                                                3
   policy                 ABSA                   systems                   Gas
                                                                           City –
  Demand               Solar Water                Diesel
                 60

                                                                20
                                                                     Gravitational feed
  Response              Heaters                 Generation                  GX

                       Demand Side
                 200

                                                                     Electric Vehicles
   Kelvin                                     Battery Storage            charging
                       Management

Smart meter /          Gas Turbines
                                       112
                                                Independent Power Producers /
                 80

Load Limiting            (OCGT)                  Embrace Renewable Energies
                       Own Rooftop
                 20

Ripple Control                                   Structural               Open
                                       6

                           PV                    Changes               Grid/Trading

    Immediate                         Short term                 Longer term
DISCUSSIONS /
 THANK YOU

                30
You can also read