Comparison between Conventional Unenhanced and Virtual Unenhanced Imaging of Hepatopancreaticobiliary System with Third-Generation Dual-Source ...
←
→
Page content transcription
If your browser does not render page correctly, please read the page content below
Published online: 2021-06-18
         THIEME
                                                                                                                                        Original Article         1

        Comparison between Conventional
        Unenhanced and Virtual Unenhanced Imaging
        of Hepatopancreaticobiliary System with
        Third-Generation Dual-Source Dual-Energy CT—An
        Observational Study
        Swathigha Selvaraj1 Niyas N.P.1 Rupa Renganathan1 Rajkumar Ramasamy1
        Rinoy Ram Anandan1 Venkatesh Kasi Arunachalam1 Mathew Cherian1

        1 Department of Radiology, Kovai Medical Center and Hospital,      Address for correspondence Venkatesh Kasi Arunachalam,
         Avanashi Road, Coimbatore, India                                  DMRD, DNB, FRCR, Department of Radiology, Kovai Medical
                                                                           Center and Hospital, Avanashi Road, Coimbatore, 641014, India
                                                                           (e-mail: drkasivenkatesh@yahoo.co.in).

        J Gastrointestinal Abdominal Radiol ISGAR

          Abstract                           Objectives The aims of our study were to assess the comparability of conventional
                                             unenhanced images (CUIs) of hepatopancreaticobiliary system with virtual unen-
                                             hanced images (VUIs) derived from arterial and portal venous phases acquired in a
                                             third-generation, dual-source, dual-energy CT (DECT), and also to assess the best
                                             dataset among these VUIs. We also calculated the radiation effective dose (ED) reduc-
                                             tion by eliminating noncontrast acquisition.
                                             Materials and Methods 60 patients were included in our study. Unenhanced images
                                             in single energy and contrast-enhanced images in dual-energy mode were acquired.
                                             Arterial virtual unenhanced (AVU) and portal virtual unenhanced (PVU) images were
                                             generated and compared with CUI, using both objective and subjective methods. The
                                             ED was calculated separately for each phase. Statistical significance between differ-
                                             ence in mean attenuation values were analyzed using ANOVA and unpaired student
                                             t-test.
                                             Results In our study, the difference in mean attenuation of liver, spleen, and pan-
                                             creas between the three phases—CU, AVU, and PVU—were insignificant with p-value
          Keywords                           > 0.05. This indicates that the values were comparable. Among the VUI, AVU images
          ► True unenhanced                  were statistically superior in image quality. Elimination of noncontrast CT from triple
          ► Virtual unenhanced               phase abdominal imaging can achieve an average ED reduction of 39%.
          ► Third generation                 Conclusions We conclude that VUI generated in third-generation, dual-source DECT
          ► Dual source                      has diagnostic image quality and can replace the CUI in triple-phase studies, with a
          ► Dual energy                      mean ED reduction by 39%. The VUI obtained from arterial phase is superior to those
          ► Radiation dose                   obtained from portal venous phase.

                                             DOI https://doi.org/          ©2021. Indian Society of Gastrointestinal and Abdominal Radiology
                                             10.1055/s-0041-1730095        This is an open access article published by Thieme under the terms of the Creative
                                             ISSN 2581-9933                Commons Attribution-NonDerivative-NonCommercial-License, permitting copying
                                                                           and reproduction so long as the original work is given appropriate credit. Contents
                                                                           may not be used for commercial purposes, or adapted, remixed, transformed or
                                                                           built upon. (https://creativecommons.org/licenses/by-nc-nd/4.0/).
                                                                           Thieme Medical and Scientific Publishers Pvt. Ltd. A-12, 2nd Floor,
                                                                           Sector 2, Noida-201301 UP, India
2   Virtual unenhanced imaging with third-generation dual-source dual-energy CT                                           Selvaraj et al.

    Introduction
    Beginning from the era of single-slice, sequential CT scanner
    and advancing toward multislice spiral CT, with ultrafast true
    isotropic volume imaging, the technology has undergone an
    enormous change over the last few decades. Conventional CT
    scanners which operate at single energy provide morpholog-
    ical information only, with little material specific informa-
    tion. This is overcome by the use of dual-energy techniques
    which use two X-ray spectra to obtain two sets of images and
    data, which are collected on the principle “different mate-
    rials show different attenuation at different energy levels.”
    Dual-energy CT (DECT) is also referred to as “spectral CT”
    because of the usage of two different energy spectra.1
       Some of the uses of DECT in hepatopancreaticobiliary
    imaging include detection and staging of hypervascular liver
    lesions, such as hepatocellular carcinoma and hypervascular
    liver metastasis, which are more conspicuous on low-energy
    images (e.g., 80 kVp) than they are on high-energy images
    (e.g., 140 kVp) in the arterial phase of enhancement, deter-
    mining the components of a hepatic lesion, which helps in                                Fig. 1 (A) Axial contrast-enhanced portal venous phase image and
    characterizing the lesions, such as hepatic adenoma or hepa-                             the iodine color-coded image (B), Virtual unenhanced image (C)
                                                                                             and iodine-only image (D) generated using liver virtual noncontrast
    tocellular carcinoma if fat is present within the lesion, dif-
                                                                                             (VNC) software from the portal venous dataset.
    ferentiating simple cysts from hypovascular metastasis and
    fatty infiltration from hypoattenuating pancreatic masses and
    necrosis, with the help of water and iodine density images.2-5                           objective and subjective methods, identifying the best data-
       A triple-phase study is used for characterization of liver                            set among the arterial/portal venous VUI, and calculation of
    lesions. By using DECT with the above advantages, it is pos-                             the percentage of radiation effective dose (ED) reduction by
    sible to identify and characterize the lesions with greater                              eliminating noncontrast acquisition.
    accuracy. But there is a concern about the radiation dose.
    Radiation exposure required for DECT depends on the tech-                                Materials and Methods
    nology used. The aim is to use the same possible dose as
    would be used in a single-energy CT (SECT), so that addi-                                Patient Selection
    tional information can be obtained without an increase in                                This study was approved by the local ethical and scientific
    dose. The specific parameters influencing the radiation dose                             committee, and a written informed consent was obtained
    are tube current, pitch, and energy. If low-tube currents are                            from all participants. All patients who came to the radiology
    used, dual-energy images may be obtained with radiation                                  department for evaluation of the hepatopancreaticobiliary
    doses similar to those used to acquire single energy images.                             system and who were subjected to DECT between November
    This dose reduction is further aided by replacing the conven-                            2018 to November 2019 with varied clinical profile such as
    tional unenhanced images (CUI) by the virtual unenhanced                                 cirrhosis, hepatocellular carcinoma, fatty liver, cholangiocar-
    images (VUI).6,7                                                                         cinoma, metastasis, and liver lesion characterization were
       VUI are a set of images which are obtained by using the                               included in this study. The patients who were being evaluated
    technique of material decomposition into iodine, fat, and                                as donor for liver transplant program/who underwent tran-
    water. These images are generated by subtracting the iodine                              sarterial radioembolization (TARE) or transarterial chemo-
    signal from contrast images, whereas iodine-only images are                              embolization (TACE) for hepatocellular carcinoma/metastatic
    obtained by selectively choosing the contrast density mate-                              lesions were excluded from the study.
    rial images (►Fig. 1).8,9 For obtaining good VUI, effective sep-
    aration of the two datasets is required. This can be achieved                            Methodology
    to an acceptable level with the new third-generation,                                    The study was done on a third-generation, dual-source DECT
    dual-source DECT scanners, with the use of 100 kV in one                                 scanner (Somatom force, Siemens Healthcare).
    and 150 kV in the other tube, thicker prefilter, and advanced                               CUI in single-energy mode and contrast-enhanced,
    modeled iterative reconstruction (ADMIRE) algorithm.10                                   dual-phase images (late arterial and portal venous) in
       The aim of our study was to assess whether VUI gener-                                 dual-energy mode were acquired. Both sets were acquired
    ated in third-generation, dual-source DECT can replace the                               with a pitch of 1. In single-energy scan, the tube voltage used
    CUI in studies done for hepatopancreaticobiliary system. The                             was 120Kv. In dual-energy, tube A operates at 100kVp and
    objectives include assessment of the comparability of CUI                                tube B at 150kVp. The patient was placed in supine position
    with VUI derived from arterial and portal venous phases by                               with extended arms.

    Journal of Gastrointestinal and Abdominal Radiology ISGAR   Vol. 00   No. 0/2021   ©2021. Indian Society of Gastrointestinal and Abdominal   Radiology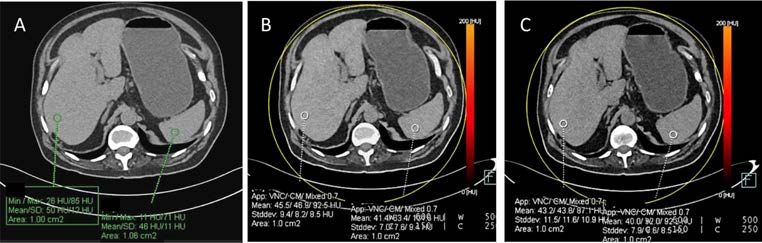
Virtual unenhanced imaging with third-generation dual-source dual-energy CT                                            Selvaraj et al.      3

   We used Omnipaque 350mg/mL as the contrast agent at a                               Statistical Analysis
flow rate of 4 mL/s, followed by 20 mL saline flush, using an                          The results were collected in a Microsoft Excel file. Statistical
automated dual-syringe power injector through an 18-gauge                              Package for Social Sciences (SPSS) version 21was employed
intravenous (IV) access placed in the right median cubital                             to analyze data. HU measurements were numeric; variables
vein. The volume of contrast was decided based on the weight                           had a Gaussian distribution, so that mean values and stan-
of the patient. The contrast scan was performed by using a                             dard deviation (SD) could be calculated. All measurements
bolus tracking software application. Region of interest (ROI)                          were expressed as the mean value ± SD.
was placed in the abdominal aorta and when Hounsfield                                     The difference in mean attenuation values between the
units (HU) of 150 was reached, the scan was triggered with                             CU, AVU and PVU groups were compared by ANOVA; p-value
a delay of 15 seconds for arterial phase and 60 seconds for                            < 0.05 was considered significant and > 0.05 was considered
portal venous phase. In conventional unenhanced (CU) and                               insignificant.
portal venous phases, the scan coverage was from the dia-                                 The difference in mean attenuation values between the
phragm to the level of the ischial tuberosities, and in the arte-                      individual groups were compared in required areas, using
rial phase, the scan coverage was to the iliac crests.                                 unpaired student t-test, and p-value < 0.05 was considered
   ADMIRE software, Siemens Healthcare, was used for                                   significant and > 0.05 was considered insignificant.
reconstruction of images, and analysis was done in Syngo.via                              The mean dose length product (DLP) was measured for CU
workstation, using the inbuilt Liver VNC software. VUI were                            phase, arterial enhanced phase and portal venous enhanced
generated from arterial and portal venous phase images.                                phase separately. The ED in mSv was calculated using the for-
                                                                                       mula ED = DLP × k, where k is a constant and its value for
Image Analysis                                                                         abdomen and pelvis is 0.015. The percentage of dose reduced
The images from each patient was separated into three sets,                            by avoiding noncontrast scan was then calculated.
namely, CU, arterial virtual unenhanced (AVU), and por-
tal venous virtual unenhanced (PVU) images. The objective
                                                                                       Results
image analysis was done by comparing the HU values, and
the subjective image analysis was done using the five-point                            About 60 patients who underwent dual energy, triple-phase
scale for anatomical details and artifacts.                                            CT imaging for proven or suspected lesion in hepatopancre-
   Objective image analysis: The attenuation of liver, spleen,                         aticobiliary system were included. Mean age of the sample
pancreas, portal vein, aorta, and lesion in all the three data-                        group was 51.5 years, with range between 31 to 72 years.
sets were measured. 1 cm2 circular ROI in the liver, pancreas,                         Among the 60 patients, males contributed to the major
spleen and larger lesions and 0.5 cm2 ROI in the portal vein,                          number, accounting for approximately 62% of the total,
aorta, calcifications and smaller lesions were placed, and                             and females formed the rest of the total (38%). Since all the
the corresponding attenuation was measured. The ROI was                                patients underwent scanning for known or suspected hepa-
placed in the liver and spleen at the level of portal vein bifur-                      tobiliary pathology, they presented with varied clinical pro-
cation, and in the pancreas, portal vein and aorta at the level                        files and diagnoses, among which cirrhosis was the most
of portal vein formation. The maximum possible circular ROI                            common proven/suspected diagnosis.
was used for gallbladder calculus.
   Subjective image analysis: This scoring criteria was devel-                         Objective Criteria
oped on the basis of the previous studies done by Li et al and                         The p-value for difference in mean attenuation of liver,
De Ceccoa et al as shown in ►Table 1.11,12                                             spleen, pancreas and gallbladder calculus size was insig-
                                                                                       nificant. The attenuation values were comparable with no
Table 1 Subjective image analysis criteria based on artifacts                          significant difference between CU, AVU, and PVU images
and anatomical details                                                                 (►Table 2). Similar results were obtained for both solid and
 Grade    Artifacts                       Anatomical details and                       cystic lesions, identified during the scan. The p-values for
                                          lesions                                      difference in mean attenuation of aorta, portal vein, inferior
                                                                                       vena cava (IVC), and gallstone were significant and were not
 I        Severe artifacts                Organs—not assessable,
                                          lesions—not visible                          statistically comparable.
 II       Artifacts affecting diag-       Anatomical details of
          nostic information              organs—not clearly visible,                  Subjective Score
                                          lesions—not clear                            The subjective score was analyzed using a five-point scale
 III      Obvious artifacts but           Anatomical details of                        ranging from grade 1 to 5, where 1 was the least and 5 was
          acceptable                      organs and lesions—seen to                   the best possible score. The mean subjective score obtained
                                          an acceptable extent                         for AVU and PVU were 4.01 ± 0.61 and 3.7 ± 0.46 (mean ±
 IV       Artifacts were seen in          Organs and lesions—seen                      SD), respectively. The p-value for individual differences of
          other organs not inter-         clearly                                      subjective score between AVU and PVU was 0.001, indicat-
          fering with the diagnosis
                                                                                       ing that the difference in image quality was statistically sig-
 V        Minimum or no artifacts         Organs and lesions—seen
                                                                                       nificant and AVU images was superior among the two sets
                                          clearly
                                                                                       of VUI.

                 Journal of Gastrointestinal and Abdominal Radiology ISGAR   Vol. 00    No. 0/2021   ©2021. Indian Society of Gastrointestinal and Abdominal   Radiology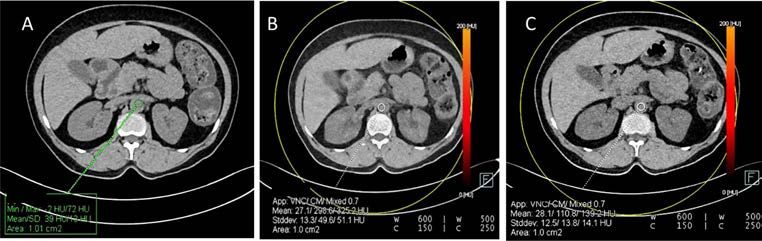
4   Virtual unenhanced imaging with third-generation dual-source dual-energy CT                                           Selvaraj et al.

    Table 2 Mean attenuation and SD in conventional unenhanced and virtual unenhanced images and their p-values
                                                                          CU             AVU              PVU               p-value              Significance
      Liver                                              Mean             54.05          50.98            50.73             0.327                Insignificant
                                                         SD               11.05          11.15            11.31
      Spleen                                             Mean             46.67          45.91            45.42             0.17                 Insignificant
                                                         SD               2.54           3.9              3.82
      Pancreas                                           Mean             41.93          39.26            39.19             0.168                Insignificant
                                                         SD               8.17           7.27             6.48
      Lesion                                             Mean             51.83          37.71            40.26             0.862                Insignificant
                                                         SD               81.81          45.23            51.61
      Size of GB calculi                                 Mean             0.94           0.9              0.85              0.984                Insignificant
                                                         SD               0.41           0.4              0.41
      GB calculus attenuation                            Mean             818.29         383.86           376.57            0.048                Significant
                                                         SD               488.96         290.36           243.75
      Aorta                                              Mean             44.31          34.71            33.71             0.001                Significant
                                                         SD               5.86           7.5              6.72
      IVC                                                Mean             42.01          34.33            33.76             0.001                Significant
                                                         SD               5.66           6.34             6.29              6.39
      Portal vein                                        Mean             36.59          34.78            33.86             0.001                Significant
                                                         SD               6.34           6.29             6.39
    Abbreviations: AVU, arterial virtual unenhanced; CU, contrast unenhanced; GB, gallbladder; IVC, inferior vena cava; PVU, portal virtual unenhanced;
    SD, standard deviation.
    Note: p-value < 0.05—significant

    Radiation Dose                                                                           new third-generation, dual-source, dual-energy CT with the
    Mean DLP and effective dose were calculated (►Table 3). It                               usage of ADMIRE algorithm as against the previously used
    was found that there was a significant effective dose reduc-                             filtered back projection (FBP). It was found that the lesion
    tion of 39% when we removed the noncontrast unenhanced                                   detection rate was increased to approximately 80% and dose
    acquisition from the total examination and replaced them                                 reduction was achieved to approximately 41% when com-
    with virtual unenhanced images.                                                          pared with the second-generation CT scanners.8 According to
                                                                                             our study, it was found that the difference in mean attenua-
                                                                                             tion of liver, spleen and pancreas between the three phases—
    Discussion
                                                                                             CU, AVU and PVU images—were insignificant, with p-value >
    In this modern era, with technological advancements, DECT                                0.05(►Fig. 2). This indicated that there was complete separa-
    by using different photon energies has gained worldwide                                  tion of iodine from these organs, and values were comparable
    acceptance, because of its material decomposition meth-                                  with no significant difference between the attenuation val-
    ods and promising potential in radiation dose reduction. It                              ues, even in patients with fatty infiltration of the liver. This is
    has immense advantages over single-energy CTs right from                                 in agreement with De Ceccoa et al, in that there is no statis-
    lesion detection, characterization, and differentiation.4                                tically significant difference in the mean attenuation values
       However, in the previously used first- and second-                                    of the liver, spleen, and psoas muscles between CU, AVU and
    generation, dual-source CTs, certain disadvantages like poor                             PVU images.12 Graser et al also found no statistical difference
    spatial resolution, motion-related artifacts, increased noise                            in mean attenuation values of the liver and renal parenchyma
    and increased radiation dose existed and hence they did not                              between CU and VUI derived from the postcontrast nephro-
    become popular.13-16 These problems were addressed in the                                graphic phase dataset.17 In a study done by Durieux et al, they

    Table 3 Mean and SD of DLP and radiation ED in conventional unenhanced and enhanced phases
                                                                                       DLP                                               Radiation ED
      Phase                                                     Mean                         SD                      Mean                              SD
      Conventional unenhanced                                   407.27                       77.07                   6.11                              1.16
      Arterial enhanced                                         230.6                        40.89                   3.45                              0.61
      Portal venous enhanced                                    423.18                       72.97                   6.33                              1.11
    Abbreviations: DLP, dose length product; ED, effective dose; SD, standard deviation

    Journal of Gastrointestinal and Abdominal Radiology ISGAR   Vol. 00   No. 0/2021   ©2021. Indian Society of Gastrointestinal and Abdominal   Radiology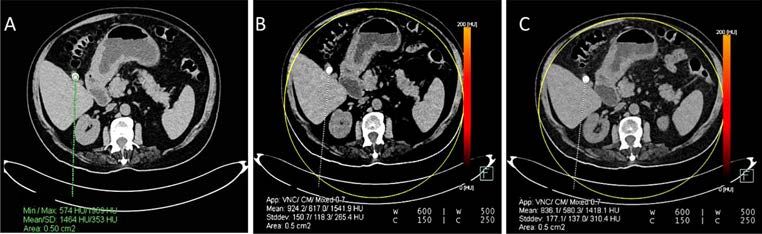
Virtual unenhanced imaging with third-generation dual-source dual-energy CT                                            Selvaraj et al.      5

Fig. 2 Attenuation of liver and spleen in (A) noncontrast unenhanced image (B) arterial virtual unenhanced image (C) portal venous virtual
unenhanced image.

observed no statistically significant difference between CU                             portal vein in AVU and PVU images showed no significant
and PVU in the solid organs, including liver and spleen.18                              difference compared with CU images.19 The mean reduction
   In our study, the difference in mean attenuation of aorta,                           in HU between the CUI and VUI were ≤ 10 HU in all these
IVC and main portal vein (MPV) between the CUI and VUI                                  vessels in both phases in our study. The clinical significance
were significant with p-value < 0.05, indicating that the                               of this minimal attenuation difference is debatable.
attenuation values are underestimated by VUI for these ves-                                Significant reduction of mean HU value with mild reduc-
sels (►Fig. 3). In our study, we used a liver-specific algorithm,                       tion in size of calcified gallbladder stones was noted in our
a three-material decomposition algorithm (iodine, fat, and                              study. The difference in p-value (0.048) was significant,
water). The general algorithm uses a two-material decom-                                indicating that they are not comparable. The mean HU val-
position algorithm (iodine and water). These algorithms                                 ues in VUI were underestimated when compared with CU
affect the calculation of the VU datasets and the correspond-                           images, indicating that calcium was subtracted along with
ing attenuation values. The underestimation of attenuation                              iodine in VUI (►Fig. 4). However, there was no statistically
values in vessels in our study could be secondary to the                                significant difference in mean size of the gallbladder stones
three-material decomposition algorithms. This is in concor-                             between the CU and VUI (►Fig. 5). De Ceccoa et al quoted in
dance with the study done by De Ceccoa et al which showed                               their study that calcified liver lesions and gallbladder calculi
that statistically significant reduction in the mean attenu-                            showed a decrease in HU, and small calculus were completely
ation was observed in the aorta.12 However, Laukamp et al                               subtracted in the VUI.12 In another study done by Lee et al,
concluded in their study that the attenuation of aorta and                              they found out that calcium stones were underestimated in

Fig. 3 Attenuation of aorta in (A) noncontrast unenhanced image (B) arterial virtual unenhanced image (C) portal venous virtual unenhanced
image.

Fig. 4 Attenuation of gallbladder calculus in (A) noncontrast unenhanced image (B) arterial virtual unenhanced image (C) portal venous virtual
unenhanced image.

                  Journal of Gastrointestinal and Abdominal Radiology ISGAR   Vol. 00    No. 0/2021   ©2021. Indian Society of Gastrointestinal and Abdominal   Radiology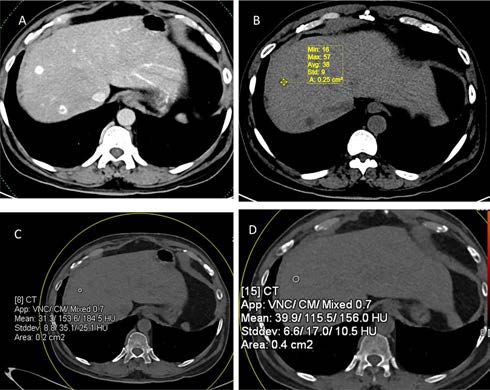
6   Virtual unenhanced imaging with third-generation dual-source dual-energy CT                                           Selvaraj et al.

    Fig. 5 Size of gallbladder calculus in (A) noncontrast unenhanced image (B) arterial virtual unenhanced image (C) portal venous virtual unen-
    hanced image.

    size and HU in VUI when compared with true noncontrast                                   is statistically superior in image quality when compared with
    images.20 Hence, CUI should be preferred over VUI in eval-                               the portal venous VUI. This result is similar to the study done
    uation of patients with suspected biliary colic or vascular                              by De Ceccoa et al, which showed that AVU were slightly supe-
    pathologies.                                                                             rior to PVU in lesion detection.12 This can be explained by the
       Out of 60 patients in our study, 24 patients had parenchy-                            fact that in arterial phase, contrast has not filled in the inter-
    mal lesions. Eighteen of them had solid lesions and the rest                             stitial space completely and can be washed off easily. However,
    had cystic lesions. The parenchymal lesions include hepa-                                in a study done by Lehti et al, they have concluded that PVU
    tocellular carcinoma (HCC), metastasis, abscess, cysts, and                              images are superior than AVU images and better approximate
    calcified granuloma in the liver, angiomyolipoma, cyst in the
    pancreas, and GB carcinoma. The mean HU of all the lesions
    detected during the scan in CUI and VUI were analyzed using
    ANOVA and the p-value of 0.8 was obtained, which was found
    to be insignificant, indicating VUI were comparable to CUI in
    lesion detection and characterization. Also, we separated the
    enhancing noncalcified solid lesions and cystic lesions sep-
    arately and did a statistical analysis. The p-value for differ-
    ence in mean attenuation was insignificant in both the solid
    and cystic groups and measured 0.82 and 0.58, respectively,
    indicating that VUI were comparable with true noncontrast
    images (►Figs. 6 and 7). There were two lesions with calcifi-
    cation within whose HU values were underestimated in both
    virtual unenhanced datasets when compared with the non-
    contrast image. This is corresponding to the previous study
    done by De Ceccoa et al, in which they stated that VUI were
    superior to noncontrast images in detecting hypoattenuating
    lesions and inferior in detecting calcified lesions.12
       In our study, all the VUI were of score 3 or more, indicat-                           Fig. 6 Axial CT image (A) of a patient with history of carcinoma
                                                                                             thyroid shows hypervascular liver lesions suggestive of metastasis.
    ing that they were suitable for interpretation. The individual
                                                                                             Attenuation of the lesion in noncontrast unenhanced image (B), arte-
    difference between the mean score was statistically signifi-                             rial virtual unenhanced image (C), and portal venous virtual unen-
    cant with p-value < 0.01. This indicates that the arterial VUI                           hanced image (D) shows no significant difference.

    Fig. 7 Axial plain CT image (A) shows multiple cystic lesions of varying sizes in liver. Attenuation of cystic lesion in the right lobe of the liver
    in noncontrast unenhanced image (B), arterial virtual unenhanced image (C), and portal venous virtual unenhanced image (D) shows no sig-
    nificant difference.

    Journal of Gastrointestinal and Abdominal Radiology ISGAR   Vol. 00   No. 0/2021   ©2021. Indian Society of Gastrointestinal and Abdominal   Radiology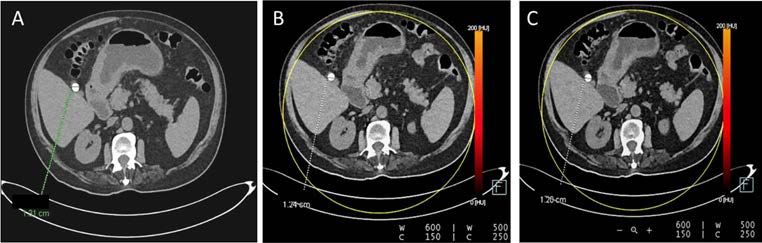
Virtual unenhanced imaging with third-generation dual-source dual-energy CT                                           Selvaraj et al.      7

noncontrast unenhanced (NCU) images.21 The possible rea-                                4 Silva AC, Morse BG, Hara AK, Paden RG, Hongo N, Pavlicek W.
sons could be that their study was done in second-generation,                             Dual-energy (spectral) CT: applications in abdominal imaging.
                                                                                          Radiographics 2011;31(4):1031–1046, discussion 1047–1050
dual-source CT and they have started their arterial phase acqui-
                                                                                        5 Mileto A, Mazziotti S, Gaeta M, et al. Pancreatic dual-source
sition earlier compared with our scans. Complete separation                               dual-energy CT: is it time to discard unenhanced imaging?
of iodine signal is possible in third-generation, dual-source CT                          Clin Radiol 2012;67(4):334–339
because of its advanced hardware and software applications.                             6 Johnson TR, Krauss B, Sedlmair M, et al. Material dif-
    We found in our study that by eliminating conventional                                ferentiation by dual energy CT: initial experience. Eur
unenhanced acquisition from triple-phase abdominal imag-                                  Radiol 2007;17(6):1510–1517
                                                                                        7 Schenzle JC, Sommer WH, Neumaier K, et al. Dual
ing and by substituting it with virtual noncontrast CT, we can
                                                                                          energy CT of the chest: how about the dose? Invest
achieve an average ED reduction of 39%. The results were sim-                             Radiol 2010;45(6):347–353
ilar to the few studies described in previous literature.11,12,22                       8 Solomon J, Mileto A, Ramirez-Giraldo JC, Samei E. Diagnostic
    There were few limitations in our study. This was a sin-                              performance of an advanced modelled iterative reconstruc-
gle institutional study with limited subjects. This study was                             tion algorithm for low contrast detectability with a third
done on the dual-source, dual-energy technique. Hence, the                                generation dual source multidetector CT scanner: poten-
                                                                                          tial for radiation dose reduction in a multireader study.
virtual unenhanced values obtained cannot be generalized to
                                                                                          Radiology 2015;275(3):735–745
other techniques of DECT like rapid kilovolt switching, mul-                            9 De Cecco CN, Buffa V, Fedeli S, et al. Dual energy CT (DECT) of
tilayer detector technique, etc. This study was done using                                the liver: conventional versus virtual unenhanced images. Eur
the contrast agent omnipaque (iohexol) with a flow rate of                                Radiol 2010;20(12):2870–2875
4 mL/sec. The other iodinated contrast agents like iopamidol                           10 Gordic S, Desbiolles L, Stolzmann P, et al. Advanced modelled
                                                                                          iterative reconstruction for abdominal CT: qualitative and
and iodixonal as well as the other flow rates used in other
                                                                                          quantitative evaluation. Clin Radiol 2014;69(12):e497–e504
protocols were not evaluated. We have evaluated the atten-                             11 Li Y, Li Y, Jackson A, et al. Comparison of virtual unenhanced
uation values of only the liver, pancreas, spleen, aorta, IVC,                            CT images of the abdomen under different iodine flow rates.
and MPV. The other organs were not included in this study.                                Abdom Radiol (NY) 2017;42(1):312–321
The lesions were grouped into cystic and solid lesions and                             12 De Cecco CN, Muscogiuri G, Schoepf UJ, et al. Virtual unen-
then analyzed; however, individual lesions like HCC, metas-                               hanced imaging of the liver with third-generation dual-source
                                                                                          dual-energy CT and advanced modeled iterative reconstruc-
tasis, etc. were not statistically analyzed due to their small
                                                                                          tion. Eur J Radiol 2016;85(7):1257–1264
numbers. Some of the other pathologies like hematoma, pan-                             13 Chiro GD, Brooks RA, Kessler RM, et al. Tissue sig-
creatitis, and associated collection were also not evaluated,                             natures       with   dual-energy      computed      tomography.
as we did not encounter these pathologies in our study. With                              Radiology 1979;131(2):521–523
the paucity of available studies, further studies are necessary                        14 Millner MR, McDavid WD, Waggener RG, Dennis MJ,
to fully evaluate the potential of virtual unenhanced images                              Payne WH, Sank VJ. Extraction of information from CT scans at
                                                                                          different energies. Med Phys 1979;6(1):70–71
and to make it a standard of care.
                                                                                       15 Kalender WA, Perman WH, Vetter JR, Klotz E. Evaluation of a
                                                                                          prototype dual-energy computed tomographic apparatus. I.
                                                                                          Phantom studies. Med Phys 1986;13(3):334–339
Conclusion                                                                             16 Kelcz F, Joseph PM, Hilal SK. Noise considerations in dual
Virtual unenhanced images generated in the third-generation,                              energy CT scanning. Med Phys 1979;6(5):418–425
                                                                                       17 Graser A, Johnson TR, Hecht EM, et al. Dual-energy CT in
dual-source, dual-energy CT possesses diagnostic image
                                                                                          patients suspected of having renal masses: can virtual
quality and can replace the conventional unenhanced images
                                                                                          nonenhanced images replace true nonenhanced images?
in triple-phase studies done for the hepatopancreaticobiliary                             Radiology 2009;252(2):433–440
system. In our study, the virtual unenhanced image obtained                            18 Durieux P, Gevenois PA, Muylem AV, Howarth N, Keyzer C.
from arterial phase is superior to those obtained from portal                             Abdominal attenuation values on virtual and true unen-
venous phase. A mean ED reduction of 39% can be achieved                                  hanced images obtained with third-generation dual-source
                                                                                          dual-energy CT. AJR Am J Roentgenol 2018;210(5):1042–1058
by eliminating conventional unenhanced acquisition.
                                                                                       19 Laukamp KR, Ho V, Obmann VC, et al. Virtual non-contrast
   Conflict of Interest                                                                   for evaluation of liver parenchyma and vessels: results from
                                                                                          25 patients using multi-phase spectral-detector CT. Acta
   None declared.
                                                                                          Radiol 2019;0(0):1–10
                                                                                       20 Lee HA, Lee YH, Yoon KH, Bang DH, Park DE. Comparison of
                                                                                          virtual unenhanced images derived from dual-energy ct with
References
                                                                                          true unenhanced images in evaluation of gallstone disease. AJR
   1 Johnson TR. Dual-energy CT: general principles. AJR Am                               Am J Roentgenol 2016;206(1):74–80
     J Roentgenol 2012;199(5(Suppl):S3–S8                                              21 Lehti L, Söderberg M, Höglund P, Wassélius J. Comparing arte-
   2 Coursey CA, Nelson RC, Boll DT, et al. Dual-energy mul-                              rial- and venous-phase acquisition for optimization of virtual
     tidetector CT: how does it work, what can it tell us,                                noncontrast images from dual-energy computed tomography
     and when can we use it in abdominopelvic imaging?                                    angiography. J Comput Assist Tomogr 2019;43(5):770–774
     Radiographics 2010;30(4):1037–1055                                                22 Kaza RK, Raff EA, Davenport MS, Khalatbari S. Variability
   3 Raptopoulos V, Karellas A, Bernstein J, Reale FR,                                    of CT Attenuation measurements in virtual unenhanced
     Constantinou C, Zawacki JK. Value of dual-energy CT in differ-                       images generated using multimaterial decomposition
     entiating focal fatty infiltration of the liver from low-density                     from fast kilovoltage-switching Dual-energy CT. Acad
     masses. AJR Am J Roentgenol 1991;157(4):721–725                                      Radiol 2017;24(3):365–372

                 Journal of Gastrointestinal and Abdominal Radiology ISGAR   Vol. 00   No. 0/2021   ©2021. Indian Society of Gastrointestinal and Abdominal   Radiology
You can also read