2018 ENVIRONMENTAL, SOCIAL, GOVERNANCE, AND SUSTAINABILITY REPORT - Compliant with Edison Electric Institute (EEI) Template
←
→
Page content transcription
If your browser does not render page correctly, please read the page content below
2018 ENVIRONMENTAL, SOCIAL, GOVERNANCE,
AND SUSTAINABILITY REPORT

Compliant with Edison Electric Institute (EEI) Template
ENVIRONMENTAL, SOCIAL, GOVERNANCE, (ESG)
AND SUSTAINABILITY REPORT

ESG / SUSTAINABILITY GOVERNANCE
At DTE Energy, the responsibility for environmental stewardship and sustainability
rests at the highest levels of the company.

BOARD OF DIRECTORS
Elected annually by our shareholders, the Board of Directors meets regularly to lead the
company in fulfilling its mission and achieving its goals. With respect to sustainability, the
Board of Directors:
  • B
     ears responsibility for creating long-term value for shareholders while ensuring that
    the company operates in an environmentally sensitive and socially responsible manner
  • O
     versees company management and assesses the effectiveness of management
    policies and decisions, including management’s development and execution of the
    company’s strategies
  • Approves all major environmental initiatives

PUBLIC POLICY AND RESPONSIBILITY COMMITTEE (PPRC)
A subcommittee of the Board of Directors, the Public Policy and Responsibility Committee
(PPRC) consists of four independent directors, tasked with reviewing the company’s
performance as a responsible corporate citizen and promoting policies to enable the
company to respond appropriately to its social responsibilities. In this role, the PPRC:
  • Advises the Board of Directors on emerging ESG issues, including climate change
  • Receives and reviews reports from management relating to ESG risks and opportunities
  • Meets regularly, including in executive sessions without management present
  • Retains independent outside professional advisers, as needed

                                                          2018 ENVIRONMENTAL, SOCIAL, GOVERNANCE, AND SUSTAINABILITY REPORT   1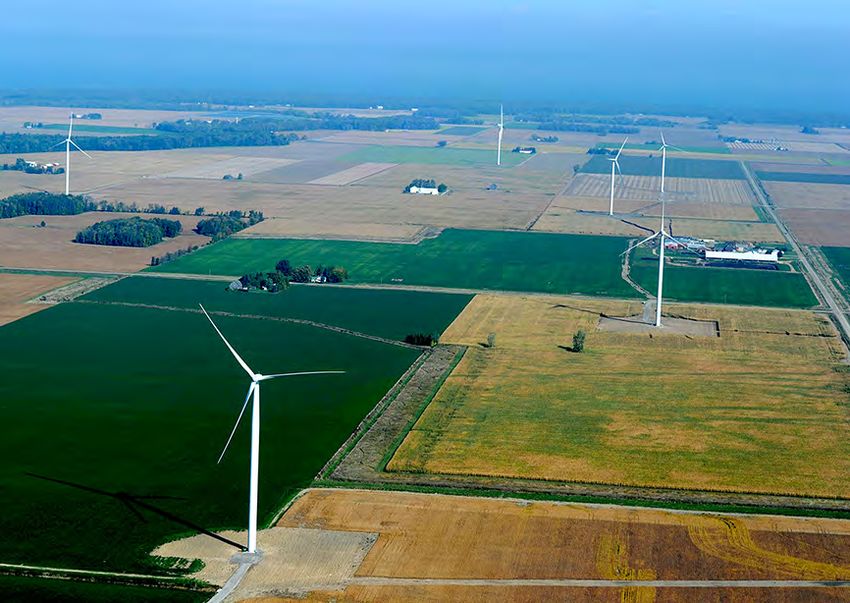
SENIOR MANAGEMENT — GOVERNMENT, REGULATORY AND
COMMUNITY (GRC) AND FORCE FOR GROWTH (FFG) COMMITTEES
Our chairman and CEO, together with other senior leaders of the company, exercise
leadership in our sustainability initiatives. Through the GRC, FFG, and other leadership
committees, DTE Energy’s senior management:
 • Executes the company’s ESG strategy in consultation with the Board of Directors
 • Manages our environmental compliance processes and carbon reduction aspirations
 • M
    obilizes our employees, resources and partner organizations to strengthen and
   promote prosperity in our communities
 • Reports to Board of Directors on outcomes of ESG initiatives
 • Manages risks associated with environmental and sustainability opportunities
 • Receives compensation tied to achievement of company goals, including ESG targets

VICE PRESIDENT — ENVIRONMENTAL MANAGEMENT AND
RESOURCES (VP-EMR)
Under the direction of senior management, the VP-EMR oversees the company’s ESG
operations. In managing our sustainability initiatives, the VP-EMR:
 • R
    epresents the company on environmental issues with the public and in environmental
   regulatory and legislative development
 • Coordinates environmental studies and conducts environmental audits
 • Supervises a department of approximately 75 people

ENVIRONMENTAL, SOCIAL AND GOVERNANCE TEAM
The cross-functional ESG Team was formed to coordinate and execute the company’s multiple
streams of ESG disclosure. With members from legal, corporate communications, investor
relations, environmental compliance, technical accounting, and the corporate secretary,
the ESG team:
 • E
    valuates potential ESG disclosure platforms and templates, and makes recommendations
   to management
 • Reviews peer company disclosures for best practices
 • C
    ollects internal ESG data and drafts disclosure documents in consultation with relevant
   business units
 • Incorporates input from management and board reviewers

                                                        2018 ENVIRONMENTAL, SOCIAL, GOVERNANCE, AND SUSTAINABILITY REPORT   2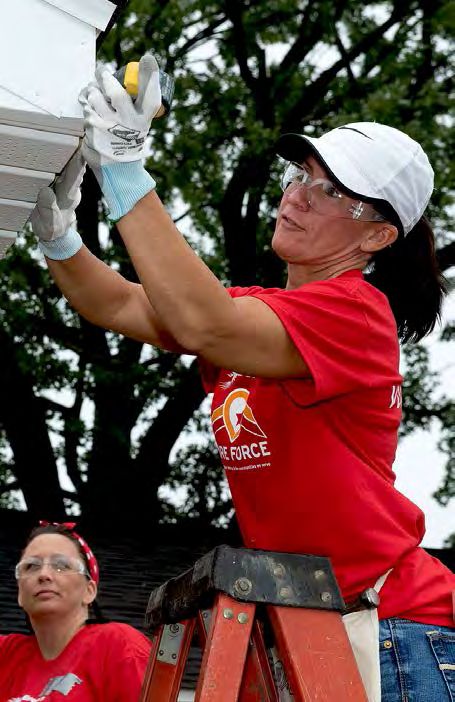
SUSTAINABILITY STRATEGY
DTE Energy recognizes that operating a sustainable business enterprise
requires us to:
     1. Address the transformational challenge of climate change
     2. Develop renewable energy assets
     3. Support our local communities

   DTE Energy is pursuing an ambitious carbon reduction agenda, including
   a plan for the closure of all remaining coal-fired units, with the ultimate
   goal of more than 80 percent reduction in carbon emissions by 2050,
   consistent with the scientific consensus for limiting global warming to
   2 degrees Celsius.

CLIMATE CHANGE
Background
DTE Energy is strongly committed to sharply reducing carbon emissions in a manner that
is safe, maintains reliability and affordability for our customers. We have invested substantial
time and resources in building a strategy to address climate change, which our chairman and
CEO, Gerry Anderson, has described as the defining policy issue of our era. Well before the
August 2015 announcement of the U.S. Clean Power Plan and the December 2015 adoption
of the Paris Agreement, DTE Energy had started its transition toward a lower carbon profile
for our generation fleet. Since 2005, we have reduced our carbon dioxide emissions by
approximately 24 percent.

Carbon Reduction Plan
DTE Energy’s commitment to provide energy that is both
affordable and sustainable resulted in our industry-leading
May 2017 announcement: we are undertaking a broad
sustainability initiative to dramatically reduce the
company’s carbon emissions. This comprehensive plan
includes (1) steady retirement of all our remaining
coal generation units, (2) construction of at least an
additional 4,000 megawatts of renewable generation,
(3) construction of up to 3,500 megawatts of new
natural gas generation, (4) heavy investment in energy
waste reduction and reducing peak demand, together
with extensive investment in modernization of the
electric grid and gas infrastructure. This plan will
achieve a 30 percent reduction in CO2 emissions from
2005 levels by the early 2020s, a 45 percent reduction by 2030, a 75 percent reduction by
2040 and an 80 percent or higher reduction by 2050. We will continue to review technology
development, electricity demand and economics and make additional low and zero emission
modifications to the plan in the best interest of our customers.

                                                         2018 ENVIRONMENTAL, SOCIAL, GOVERNANCE, AND SUSTAINABILITY REPORT   3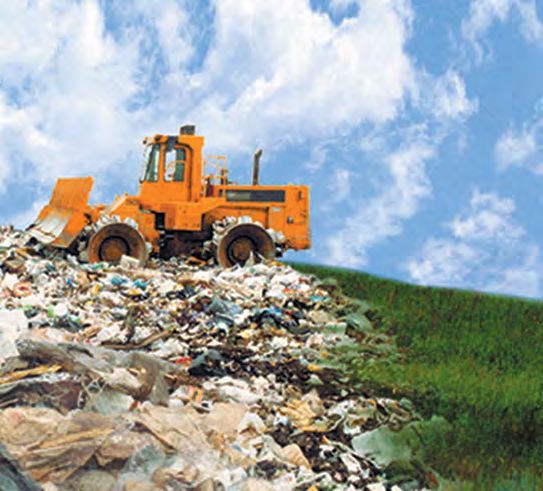
Scenario Analysis
The feasibility of our carbon reduction plan was confirmed in the 2017 Integrated Resource
Plan (IRP) filed with the Michigan Public Service Commission (MPSC) by our electric utility. In
the IRP, we analyzed multiple scenarios, including different sensitivities relating to gas prices
and electricity market prices, as well as different cost and performance curves for renewable
technologies. In evaluating these scenarios, it became clear that our IRP can support very
robust carbon reduction targets. Our carbon reduction plan assumes a tighter reduction curve
than mandated by the Clean Power Plan and higher levels of renewable generation.

Two Degree Scenario
Through our carbon reduction plan DTE Energy’s is committed to being a part of the
                                                                                                       80%CARBON
                                                                                                         REDUCTION
solution to the global climate crisis. There is broad scientific consensus that achieving
80 percent carbon reduction by 2050 will be necessary to begin to limit the global
temperature increase below two degrees Celsius over preindustrial levels.
                                                                                                      2050

                                                         2018 ENVIRONMENTAL, SOCIAL, GOVERNANCE, AND SUSTAINABILITY REPORT   4
ACHIEVING DTE’S SUSTAINABILITY GOALS
Our carbon reduction commitment is not mandated. As such, it is essential that we pursue
the commitment in a manner that supports two other critical priorities our customers
expect: reliability and affordability. The greatest threat to our carbon commitment would
come from choosing (or being asked to adopt) an approach to achieving it which threatens
either affordability or reliability.
For this reason, we are focused on pursuing the most economic path to sharp carbon
reductions, with a keen eye on reliability. At present, as we continue to retire baseload coal
units, our analysis calls for adding both high-efficiency natural gas generation (to backfill
baseload energy and provide 24x7 reliability) and significant new renewable investments
(primarily wind in the near-term, with increasing solar deployment over time).
We filed an IRP with the MPSC, which considered several scenarios with a range of
assumptions. The proposed 2017 IRP is supported by all the scenarios we considered
as part of the planning process. This 2017 IRP lays the foundation to reach the 80 percent
by 2050 carbon reduction target consistent with the scientific community’s consensus to
limit global warming less than 2 degrees Celsius by 2050.

These scenarios include assumptions for:
  • High and low gas prices (from $2.70 in the near term and rising to $8.40 by 2035)
  • Renewables (ranging from only when economic up to 50 percent of the portfolio)
  • CO2 (ranging from no CO2 price up to $40 per ton for allowances)

Base assumptions considered in the 2017 IRP include:
  • Majority of existing coal facilities retired by 2030 (exception Monroe Power Plant)
  • M
     ultiple energy efficiency programs deliver annual energy savings of 1.5 percent
    (exceeding the Michigan minimum energy savings requirement)
  • Demand response programs are expected to grow over the next 5 to 10 years

                                                         2018 ENVIRONMENTAL, SOCIAL, GOVERNANCE, AND SUSTAINABILITY REPORT   5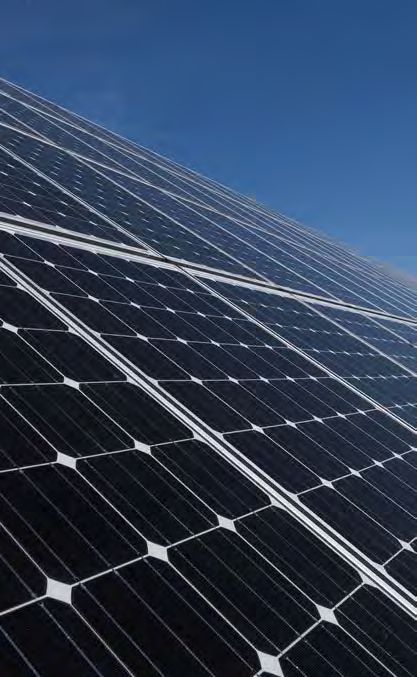
Assumptions that are critical to the success of the plan include:
 • A
    vailability, cost and siting of renewable resources. If renewable costs decrease and
   availability increases more than we have forecasted, renewables become more attractive
   in our plan. Conversely, if we continue to encounter challenges to siting wind renewables,
   solar or natural gas may be more attractive options in our plan. We have studied the
   economics of battery storage intensively. While we are deploying them for specific uses
   on our distribution grid, batteries are not yet economic to serve in conjunction with
   renewables as a baseload power replacement. As battery prices fall over time, their
   potential uses will expand.
 • A
    vailability and affordability of natural gas. Replacing coal with natural gas yields a
   ~70 percent reduction in CO2 and high efficiency gas power plants are currently a very
   economical means to backfill a portion of the coal-fired generation we are retiring with
   a highly reliable, low-carbon resource. Our plan assumes that natural gas will continue
   to be an available and affordable fuel source. Natural gas will play an important role in
   ensuring electric reliability and if our ability to use this fuel source were to be limited,
   we may need to alter our plan.

DTE will continue to evaluate changes in load, energy/commodity markets, regulatory rules,
legislative requirements, environmental impacts and technologies that may affect the plan.

                                                         2018 ENVIRONMENTAL, SOCIAL, GOVERNANCE, AND SUSTAINABILITY REPORT   6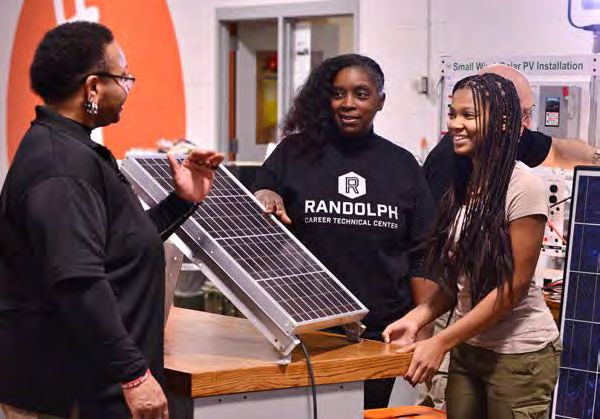
RENEWABLE GENERATION
History and Targets
DTE Energy has complied with all state-mandated targets for renewable energy. Previous
legislation had required a 10 percent renewable standard by 2015, which we have met or
exceeded each applicable year. The most recent energy legislation sets a 12.5 percent
renewable energy target by 2019 and 15 percent by 2021. DTE Energy is well positioned to
meet these future goals with the addition of new generation resources currently planned
or under development. Our carbon reduction plan anticipates that by 2040 our electric
generation portfolio will consist of 20 percent nuclear, 40 percent renewables and
40 percent natural gas.
Wind Energy
Since 2009, DTE Energy has developed substantial wind
energy resources in Michigan, driving Michigan into the
top 15 states in the nation for wind production. In 2017,
we generated or contracted for more than 3 million
megawatt hours of wind-generated electricity, enough
to power more than 370,000 homes.
We see wind energy as an important part of our future
generation portfolio; it is currently the most efficient and
cost-effective form of renewable energy for our region
of the country. With much of our wind generation
concentrated north of Detroit (particularly in Huron
County), we are exploring other areas within Michigan
for potential development. We work diligently to maintain
strong community support as we pursue new wind projects.
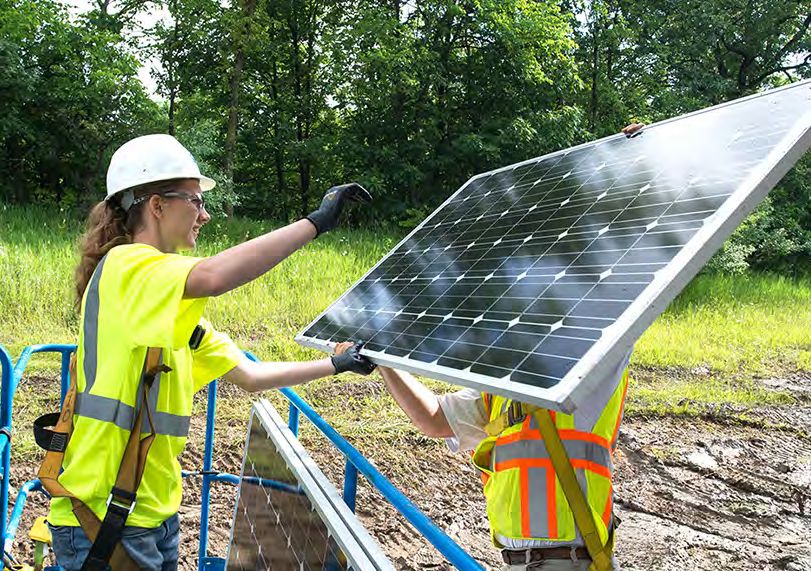
Solar Power
With 31 solar projects in its portfolio, DTE Energy
continues to be Michigan’s largest producer of solar
energy. We recently opened our Lapeer Solar Park,
situated on more than 250 acres and comprised of
200,000 solar panels — one of the largest utility-owned
solar parks in the Midwest. We also developed a large
urban solar array at Detroit’s O’Shea Park. This project
is the result of a unique public-private partnership with
the City of Detroit in which DTE Energy redeveloped
nearly 10 acres of previously vacant land, helping to
revitalize the surrounding neighborhood. In 2017, our solar
projects generated more than 82,000 megawatt hours.
We have additional solar projects in various stages
of planning. We anticipate that the price of solar panels
and the costs of installation and will continue to decline,
making solar power an increasingly attractive element to
include in our renewable portfolio.
2018 ENVIRONMENTAL, SOCIAL, GOVERNANCE, AND SUSTAINABILITY REPORT 7
Biomass Generation
DTE Energy’s non-utility Power and Industrial Projects
group is a national leader in developing landfill-gas
capture systems and in converting small coal-fired
power plants to run on biomass fuels, generating enough
renewable energy to supply the equivalent of 238,000
homes. In addition, this group operates facilities at
several coal-fired power plants to treat coal prior to
combustion, resulting in reduced emissions of nitrogen
oxide and mercury. DTE Energy continues to pursue
growth opportunities in renewable energy and
environmental controls.

                                                     2018 ENVIRONMENTAL, SOCIAL, GOVERNANCE, AND SUSTAINABILITY REPORT   8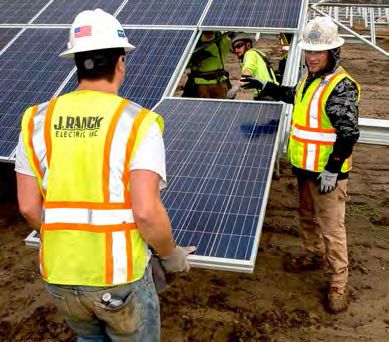
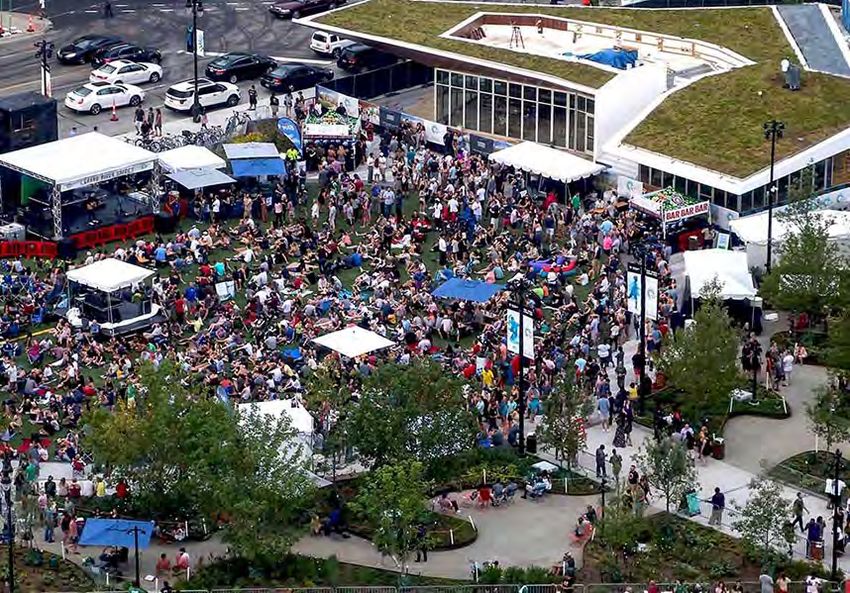
COMMUNITY ENGAGEMENT
Our Aspiration
DTE Energy aspires to be a force for growth in the communities where we live
and serve. This aspiration grew out of our employees’ genuine desire to help build
a better future for Michigan and its communities during the economic crisis of
2009-2010. When our employees asked, “What can we do to help this still struggling
region?” we responded by asking them to play a critical role in becoming a best-
operated company that provides our customers with excellent service, and use
our economic scale to help our communities grow and prosper.
To be a force for growth in our communities, we have organized our efforts
around the following focus areas:

Environmental Leadership
 • In addition to our carbon reduction plan outlined
   above, we have initiatives underway aimed at
   reducing our company’s own utilization of energy,
   water and waste by 25 percent by 2022.
 • T
    hrough energy efficiency programs, we will help our
   customers reduce their utilization of energy over the
   next five years, in both gas (1 percent annual reduction)
   and electricity (1.5 percent annual reduction).
 • O
    ur chairman and CEO, Gerry Anderson, was
   presented with the Individual Climate Leadership
   Award at the Climate Leadership Conference in
   March 2018, for exemplifying extraordinary
   leadership in addressing climate change.

Economic Progress
 • D
    TE Energy is helping to lead the establishment of
   a regional economic development organization for
   Southeast Michigan to drive the region’s overall
   development strategy, facilitate collaboration among
   existing development agencies, and centralize
   research and analytical tools for the region.
 • O
    ur chairman and CEO, Gerry Anderson, helped
   launch a working group of regional CEOs and other
   private sector leaders to discuss critical issues
   facing the region and to coordinate efforts on
   specific initiatives critical to the success of
   Southeast Michigan.

                                                           2018 ENVIRONMENTAL, SOCIAL, GOVERNANCE, AND SUSTAINABILITY REPORT   9
Education and Employment
• W
e provide 300 co-op and internship opportunities
annually for disadvantaged students attending
college, and by 2022 we plan to annually fund
and provide 700 comprehensive summer job
experiences for youth from challenged backgrounds.
• O
ver the next five years, DTE Energy and its
contractors will hire 1,000 individuals who have
multiple barriers to employment, and will provide
wrap-around training and mentoring to enable their
success and advancement.
• W
e are leading a transformation in skilled trades
training, including expansion of a technical education
high school for 700 day-time students and 700 adult
night students. We are also enhancing our support
of the FIRST Robotics Competition and its mission
to inspire young people to be science and
technology leaders and innovators.
Community Transformation
• W
e are executing a comprehensive campus and
neighborhood development plan around our Detroit
headquarters, and we are redeveloping existing
properties in our portfolio with an eye to being a
catalyst for neighborhood revitalization.
• T
hrough the DTE Energy Foundation, we support
communities across the state with grants to
non-profit organizations focused on conservation,
education, diversity and culture.
Volunteerism
• D
TE Energy is committed to fostering best-in-class
volunteerism among employees, and by 2020 we
will see 50 percent of our employees actively
volunteering in the community, with a quarter
of the volunteer hours in highly impactful skills-based efforts.
Political Leadership
• In the political arena, DTE Energy supports key legislation impacting our employees and
communities through targeted engagement with business and policy leaders and support
for sensible policies at the local, state and federal levels.
2018 ENVIRONMENTAL, SOCIAL, GOVERNANCE, AND SUSTAINABILITY REPORT 10ESG/SUSTAINABILITY QUANTITATIVE INFORMATION
Parent Company: DTE Energy
Operating Company(s): DTE Electric, DTE Gas, Power and Industrial Projects, Citizens Gas
Business Type(s): Vertically Integrated
State(s) of Operation: MI (for gas and electric utilities)
State(s) with RPS Programs: MI
Regulatory Environment: Regulated
Report Date: 2/28/18
BASELINE LAST YEAR CURRENT YEAR NEXT YEAR
METRICS 2005 2016 2017 2018
ACTUAL ACTUAL ACTUAL PROJECTION
PORTFOLIO
Total Available Nameplate Generation Capacity at end of year (MW)
Coal 7,733 6,874 6,178 6,178
Natural Gas 2,683 3,090 2,957 2,957
Nuclear 1,154 1,217 1,161 1,161
Petroleum 666 365 325 325
Total Renewable Energy Resources 997 1,813 1,845 2,016
Biomass/Biogas 8 321 321 31
Geothermal N/A N/A N/A N/A
Hydroelectric 989 989 1,019 1,019
Solar N/A 54 56 64
Wind N/A 449 449 612
Net Generation for the data year (MWh)
Coal 41,764,875 27,178,381 26,559,727 28,646,000
Natural Gas 1,033,086 2,164,304 2,230,042 1,187,000
Nuclear 8,753,555 9,146,766 9,565,994 8,477,000
Petroleum 7,800 12,130 80,188 4,000
Total Renewable Energy Resources 551,685 3,423,349 3,677,031 3,836,000
Biomass/Biogas N/A 671,919 529,414 N/A
Geothermal N/A N/A N/A N/A
Hydroelectric N/A 22,895 56,841 N/A
Solar N/A 23,994 82,204 N/A
Wind N/A 2,704,541 3,008,572 N/A
Investing in the Future: Capital Expenditures, Energy Efficiency (EE), and Smart Meters
Total Annual Capital Expenditures (in millions) $722 $1,503 $1,574 $1,900
Incremental Annual Electric Savings from EE Measures (MWh) N/A 631,000 677,000 706,721
Incremental Annual Investment in Electric EE Programs (in millions) N/A $89 $93 $106
Percent of Total Electric Customers with Smart Meters (at end of year) 0% 98% 99% 100%
Retail Customer Count (at end of year)
Commercial 126,706 114,212 109,709 N/A
Industrial 2,235 1,962 1,294 N/A
Residential 2,043,475 2,034,084 1,830,641 N/A
2018 ENVIRONMENTAL, SOCIAL, GOVERNANCE, AND SUSTAINABILITY REPORT 11BASELINE LAST YEAR CURRENT YEAR NEXT YEAR
METRICS 2005 2016 2017 2018
ACTUAL ACTUAL ACTUAL PROJECTION
EMISSIONS
GHG Emissions: Carbon Dioxide (CO2) and Carbon Dioxide Equivalent (CO2e)
Owned Generation
Carbon Dioxide (CO2)
Total Owned Generation CO2 Emissions (MT) 39,177,354 28,948,987 29,765,976 29,034,666
Total Owned Generation CO2 Emissions Intensity (MT/Net MWh) 0.752 0.690 0.707 0.689
Carbon Dioxide Equivalent (CO2e)
Total Owned Generation CO2e Emissions (MT) N/A 29,153,373 Pending N/A
Total Owned Generation CO2e Emissions Intensity (MT/Net MWh) N/A 0.695 Pending N/A
Purchased Power
Carbon Dioxide (CO2)
Total Purchased Generation CO2 Emissions (MT) 806,515 5,982,810 4,229,577 2,878,725
Total Purchased Generation CO2 Emissions Intensity (MT/Net MWh) 0.695 0.695 0.695 0.695
Carbon Dioxide Equivalent (CO2e)
Total Purchased Generation CO2e Emissions (MT) N/A 5,931,029 4,192,970 N/A
Total Purchased Generation CO2e Emissions Intensity (MT/Net MWh) N/A 0.689 0.689 N/A
Owned Generation + Purchased Power
Carbon Dioxide (CO2)
Total Owned + Purchased Generation CO2 Emissions (MT) 39,983,869 34,931,798 33,995,553 31,913,391
Total Owned + Purchased Generation CO2 Emissions Intensity
(MT/Net MWh) 0.751 0.691 0.705 0.689
Carbon Dioxide Equivalent (CO2e)
Total Owned + Purchased Generation CO2e Emissions (MT) N/A 35,084,402 4,192,970 N/A
Total Owned + Purchased Generation CO2e Emissions Intensity
(MT/Net MWh) N/A 0.694 0.087 N/A
Non-Generation CO2e Emissions
Fugitive CO2e emissions of sulfur hexafluoride (MT) N/A N/A N/A N/A
Fugitive CO2e emissions from natural gas distribution (MT) N/A 568,837 564,730 N/A
Nitrogen Oxide (NOx), Sulfur Dioxide (SO2), Mercury (Hg)
Generation basis for calculation Fossil
Nitrogen Oxide (NOx)
Total NOx Emissions (MT) 59,805 18,731 19,635 17,688
Total NOx Emissions Intensity (MT/Net MWh) 1.15E-03 4.47E-04 4.66E-04 4.20E-04
Sulfur Dioxide (SO2)
Total SO2 Emissions (MT) 198,334 47,396 44,161 45,755
Total SO2 Emissions Intensity (MT/Net MWh) 3.81E-03 1.13E-03 1.05E-03 1.09E-03
Mercury (Hg)
Total Hg Emissions (kg) 748.4 104.3 80.8 108.5
Total Hg Emissions Intensity (kg/Net MWh) 1.44E-05 2.49E-06 1.92E-06 2.57E-06
2018 ENVIRONMENTAL, SOCIAL, GOVERNANCE, AND SUSTAINABILITY REPORT 12BASELINE LAST YEAR CURRENT YEAR NEXT YEAR
METRICS 2005 2016 2017 2018
ACTUAL ACTUAL ACTUAL PROJECTION
RESOURCES
Human Resources
Total Number of Employees 11,360 10,302 10,422 N/A
Total Number on Board of Directors/Trustees 13 13 13 N/A
Total Women on Board of Directors/Trustees 2 2 2 N/A
Total Minorities on Board of Directors/Trustees 3 3 3 N/A
Employee Safety Metrics
Recordable Incident Rate N/A 0.45 0.67 N/A
Lost-time Case Rate N/A 0.15 0.21 N/A
Days Away, Restricted, and Transfer (DART) Rate N/A 0.24 0.37 N/A
Work-related Fatalities N/A 0 0 N/A
Fresh Water Resources
Water Withdrawals – Consumptive (billions of liters/Net MWh) 1.57E-06 1.72E-06 1.80E-06 N/A
Water Withdrawals – Non-consumptive (billions of liters/Net MWh) 1.03E-04 9.53E-05 9.52E-05 N/A
Waste Products
Percent of Non-hazardous Municipal Solid Waste Diverted N/A N/A N/A N/A
Percent of Coal Combustion Products Beneficially Used N/A 49.77% 49.17% N/A
2018 ENVIRONMENTAL, SOCIAL, GOVERNANCE, AND SUSTAINABILITY REPORT 13You can also read