Environmental evaluation of pareto optimal renovation strategies: a multidimensional life-cycle analysis
←
→
Page content transcription
If your browser does not render page correctly, please read the page content below
E3S Web of Conferences 172, 18003 (2020)                                                                  http://doi.org/10.1051/e3sconf/202017218003
NSB 2020

       Environmental evaluation of pareto optimal renovation
       strategies: a multidimensional life-cycle analysis
       Yanaika Decorte1,*, Marijke Steeman1, Nathan Van Den Bossche1, and Klaas Calle1
       1Ghent University, Faculty of Engineering and Architecture, Department of Architecture and Urban Planning, Sint Pietersnieuwstraat
       41 B4, 9000 Ghent, Belgium

                     Abstract. The substantial contribution of buildings in the energy consumption and emissions renders the
                     existing building stock a key element to tackle the climate crisis. Consequently, defining a deliberate
                     decision-making process gains importance. Decisions are currently often based on building codes, budget,
                     and in the best case Pareto optimality of the energy performance and the net present value of the life-cycle
                     cost. The growing attention to sustainability, however, raises questions about the effect of environmental
                     considerations on the outcome of the Pareto optimal solutions. This study quantifies the effect of including
                     the environmental aspect as a third dimension to the current evaluation approach. Therefore, the most
                     appropriate renovation measures are selected using a multidimensional Pareto optimization. The method is
                     applied to a residential high-rise building in Belgium. Firstly, the Pareto front is constituted based on life-
                     cycle costing and life-cycle assessment separately. Subsequently, the respective results are combined into
                     an integrated life cycle approach by enumerating the LCA results as an external cost to the LCC results.
                     The results show that the Pareto optimal solutions from a financial and environmental perspective do not
                     coincide. Although the financial aspect dominates, adding the environmental cost eliminates low-
                     performant financial optima, leading to optimal solutions with a larger insulation thickness.

       1 Introduction                                                          environmental objectives, is considered [5,7]. This
                                                                               approach does not align with the rising focus on
       Over 90% of the European existing building stock was                    sustainability [6].
       built before 1990 [1]. The substantial contribution of                      Hence, this paper examines the impact of both
       these buildings in the global energy consumption and                    environmental considerations and a life-cycle approach
       greenhouse gas emissions renders the existing building                  on the initial Pareto optimal renovation set outcome,
       stock a key element to tackle the climate crisis and to                 solely based on the construction costs and the energy
       improve its energy performance.                                         performance of a building. A preliminary multi-
           By 2050, the European greenhouse gas emissions                      dimensional decision-making tool is developed
       need to be cut by 80-95% [2]. A vast 97% of the                         combining life-cycle costing (LCC), life-cycle
       buildings need to be renovated to meet these 2050                       assessment (LCA) and Pareto optimisation to find the
       climate targets, whereas the current European renovation                most appropriate renovation strategies for an individual
       rate is only 1%, which is clearly insufficient to reach                 case.
       those goals [3]. Increasing the renovation rate could                       Subsequently, the calculation tool is tested on a
       significantly reduce both the global energy consumption                 residential high-rise building, Kielpark. Since for high-
       and the environmental impact of the existing building                   rise buildings the façade takes up the largest share of the
       stock [4].                                                              building envelope components, seven façade renovation
           To tackle the urgent need of increased renovation                   strategies are evaluated from a financial and
       rates, a wide range of renovation strategies is available.              environmental point of view. First, a comparison is made
       However, the uncertainty about which strategy provides                  between the results considering initial costs only and
       the optimal fit for an individual case counterbalances this             life-cycle cost, both on financial and environmental
       accessibility. Establishing a deliberate decision-making                level. Subsequently, the financial and environmental
       method considering different renovation measures thus                   Pareto front is constituted separately to finally enumerate
       gains prominence [5,6].                                                 the LCA results as an external cost to the LCC results.
           Whereas to date determining an optimal renovation
       solution is simply based on a trade-off between the
       (code-compliant) energy performance, the construction
       costs and in a best-case scenario the net present value of
       the life-cycle cost, barely any other dimension, such as

       *
           Corresponding author: yanaika.decorte@ugent.be

  © The Authors, published by EDP Sciences. This is an open access article distributed under the terms of the Creative Commons Attribution License 4.0
  (http://creativecommons.org/licenses/by/4.0/).
E3S Web of Conferences 172, 18003 (2020)                                                         http://doi.org/10.1051/e3sconf/202017218003
NSB 2020

       2 Methodology
                                                                              Besides the system boundaries, the functional unit
                                                                          and total lifespan are equated. Generally, a life span of
       2.1 Multidimensional decision-making tool                          10 to 20 years is assumed in LCC studies. This is in
       For this study, two existing methods - life-cycle costing          contrast to most LCA studies, where a longer lifespan of
       (LCC) and life-cycle assessment (LCA) - are combined               60 years is more common. In this work, an average
       into one single decision-making tool, evaluating both the          lifespan of 30 years is considered for both LCA and
       financial and the environmental impact of seven                    LCC. Based on the results, an estimate of the impact of a
       different façade renovation strategies based on Pareto             shorter or longer period can also be evaluated.
       optimisation. This tool is later tested on a case study,
       explained in §2.2.                                                 2.1.2 Life cycle costing (LCC)
           First, an LCC study determines the most feasible
       façade renovation measures from a financial perspective.           To calculate the life-cycle cost, the commonly used Net
       Subsequently, to evaluate whether the financially                  Present Value (NPV) method is adopted from a
       optimal solutions are also viable regarding the                    microeconomic point of view including taxes and
       environmental impact, an LCA study is in turn                      excluding subsidies to get results independent of future
       performed. The ambition is in the end to get an insight in         policy changes [6].
       the relative importance of LCC and LCA, and in the                    The NPV is determined by enumerating the initial
       difference between the initial decisions made from a               costs and all periodic and annual costs during a
       financial point of view and the final outcome based on             predefined lifespan discounted to the year of the
       the enumeration of both results.                                   investment [10].

                                                                                NPV=ICF + PV(ECF) + PV(MCF) – PV(RVF)             (1)
       2.1.1 Boundary conditions
                                                                          ICF      Financial initial cost               [€]
       In order to limit disparities, the boundary conditions             ECF      Financial operational energy cost    [€]
       related to the LCC and LCA study are to the extent                 MCF      Financial maintenance cost           [€]
       possible harmonised. In this way, a comparison of both             RVF      Financial residual value             [€]
       studies can be made on an equal basis and an                       PV       Present value                        [-]
       enumeration of the individual results is justified.
           The boundary conditions refer to several aspects.                  As shown in (1), no replacement costs will occur as
       First of all, the system boundaries, i.e. the process stages       the lifespan of the individual constituting elements is
       included in the life-cycle analysis, of both studies should        assumed larger or equal to the period considered in this
       be at least comparable. Not all aspects are assumed in             research.
       both studies, since the weight of the different process                Firstly, the initial financial cost includes demolition,
       stages differs from a financial and environmental                  building materials, labour, indirect costs (e.g. equipment,
       perspective. For example, the construction and                     transport,…) and 6% VAT. The cost data are mainly
       maintenance phase are excluded in the LCA study                    collected from the ASPEN price dataset regarding new
       because of the high uncertainties and the relatively               buildings published in 2014 [11]. As these prices evolve
       limited impact [8,9]. The same applies for the end-of-life         rapidly, they are updated to 2019 based on the historical
       phase. On the one hand, there is a large range of possible         evolution data of the ABEX [12]. An additional 10%
       waste treatment processes of which the impact is still             cost is added related to the attention to construction
       unknown or insecure. On the other hand, the current                details.
       waste processes are assumed for future processes. These                Secondly, to calculate the operational energy cost,
       procedures will probably change, rendering the results             data is collected from Eurostat based on the gas prices
       uncertain and unreliable [9]. An overview of the system            for household consumers in the first half of 2019. An
       boundaries regarding LCC and LCA, respectively, is                 energy price of 0.0429 €/kWh is applied [13].
       shown in table 1.                                                      Thirdly, the maintenance cost is based on
                                                                          maintenance cost data, collected from the ASPEN price
          Table 1. System boundaries included in LCC and LCA.
                                                                          dataset regarding renovations published in 2003 [14],
                                                   LCC     LCA            and on the maintenance period. Maintenance costs
                                                                          independent of the renovation strategies such as washing
                         Demolition                 ×                     the windows and painting the interior surface are not
                         Materials                  ×        ×            included.
         Initial phase
                         Transport                  ×        ×                Fourthly, to calculate the residual value of each
                         Construction               ×                     façade renovation strategy, the initial cost is multiplied
                         Replacement                ×        ×            by the ratio of the remaining lifespan and the initial
                                                                          lifespan. The lifespan of S1, S2 and S4 is 30 years,
         Usage phase     Maintenance                ×                     whereas the lifespan of the other strategies is 50 years
                         Operational energy use     ×        ×            (see table 3, section 2.2.2). The façade will thus have a
         End of life     Residual value             ×                     remaining lifespan of 0 or 20 years, respectively.

                                                                      2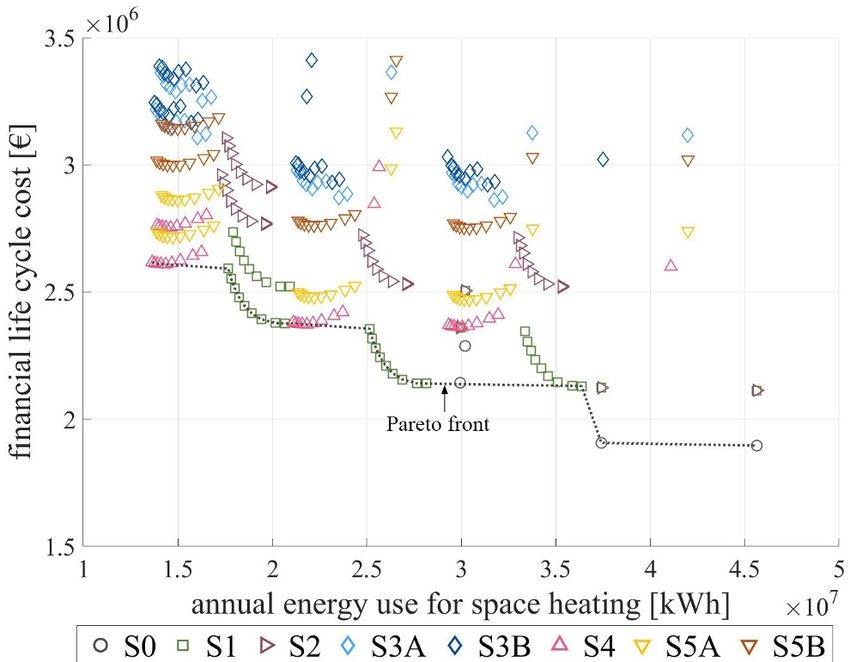
E3S Web of Conferences 172, 18003 (2020) http://doi.org/10.1051/e3sconf/202017218003
NSB 2020
Finally, in order to convert the future costs to a Note that this simplified approach does not
present value, different economic parameters are compensate for user behaviour and might overestimate
defined. Since the discount rate is often considered equal the energy use for poorly insulated buildings, and
to the interest rate for bank loans, a financial discount underestimate the energy use of well-insulated buildings.
rate of 1,8% is preferred [15,16]. Besides that, a growth
rate for energy prices of 1,6% is defined to consider Qh=0.024 × H × HDD / ηsys (2)
energy price evolutions [17]. Whereas the prices of
Qh Annual heating demand [kWh]
building materials and labour also fluctuate in time, the
H Heat loss coefficient [W/K]
corresponding growth rate is further neglected in the
HDD Heating degree days per year [-]
analysis.
ηsys Heating system efficiency [-]
2.1.3 Life cycle assessment (LCA) To determine the heating system efficiency, the
building is assumed to be heated by a central gas
The environmental impact assessment is conducted using condensing boiler with an average efficiency of 0.90. An
SimaPro version 9.0.0.49 with the Swiss Ecoinvent additional loss factor of 30% is considered related to
database version 3.5 as the life-cycle inventory database distribution losses [22].
containing all required input flows that fit the European Furthermore, the number of degree days per heating
context [18]. season is estimated in a simplified way for the next 30
Furthermore, the MMG assessment framework [19], years based on a declining trend of the average number
developed by the Public Waste Agency of Flanders of degree days measured in Belgium per ten years since
OVAM, is preferred for several reasons to quantify the 1960. These numbers are calculated using 16.5°C as the
environmental impact. Firstly, the method is created for indoor and outdoor temperature above which heating is
and adapted to the Belgian context. In addition, a wide no longer required. The assumed degree days per year
range of impact categories are taken into account are 2155, 2066, 1977 and 1888 in 2020, from 2021 to
consisting of seven standard CEN indicators according 2030, from 2031 to 2040 and from 2041 to 2050,
to the European standard CEN TC 350 and ten additional respectively [22].
CEN+ indicators covering the Belgian policy themes.
Finally, other commonly used methods, such as the
ReCiPe method [20], define an environmental impact 2.1.5 Pareto optimisation
score expressed in points. However, this hampers the
In this research, three criteria – LCC, LCA and the
comparison with the LCC results expressed in euros, and
operational energy use are evaluated. As pareto
thus the decision-making process. The MMG method on
optimisation is often used to simultaneously optimise
the contrary, determines an aggregated score by
multiple criteria, this concept is most appropriate in this
weighing the results through monetary valuation. Each
study [9].
individual environmental impact indicator is linked to a
Moreover, a multi-objective optimisation approach is
monetarisation factor which indicates an environmental
followed. The optimisation objectives are a minimal
damage cost. The sum of all monetised impact indicators
operational energy use, initial financial cost, life-cycle
results in the final environmental cost [19].
financial cost, initial environmental cost and life-cycle
In contrast to the financial costs, the environmental
environmental cost. These different objectives can
results are not discounted in this research since no
potentially lead to a different ranking of the optimal
general agreement is yet established in literature on a
renovation strategies.
suitable discount rate [21].
As shown in Table 1, both the embodied and
operational energy are included in the LCA study. The 2.2 Case study
construction phase is not included, but 5% material loss
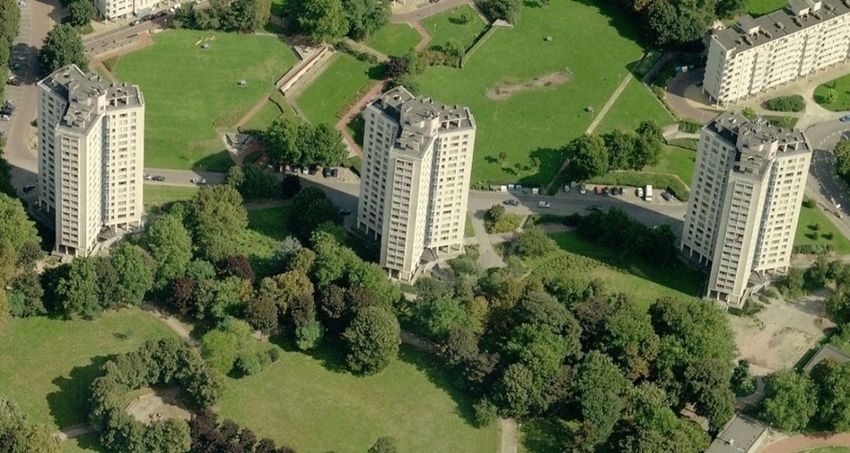
during this phase is considered [19]. A part of the The selected case study is one of the three 60 years old
materials is lost due to e.g. storage, cutting losses, identical residential high-rise buildings situated on the
careless handing. Kielpark site in Antwerp, Belgium. The building
contains 96 social apartments spread over 16 floors.
2.1.4 Energy calculations
To get an insight in the operational energy use, a
simplified steady state model is used based on the
degree-days method. In this work, only the energy
demand for space heating is considered (2). All other
types of energy demand (e.g. domestic hot water demand
and electricity demand for auxiliary installations and
household appliances) is assumed identical for the
different renovation strategies and is therefore not
simulated. This allows to only evaluate the difference in
energy performance due to the façade renovation.
Fig. 1. The existing Kielpark high-rise buildings.
3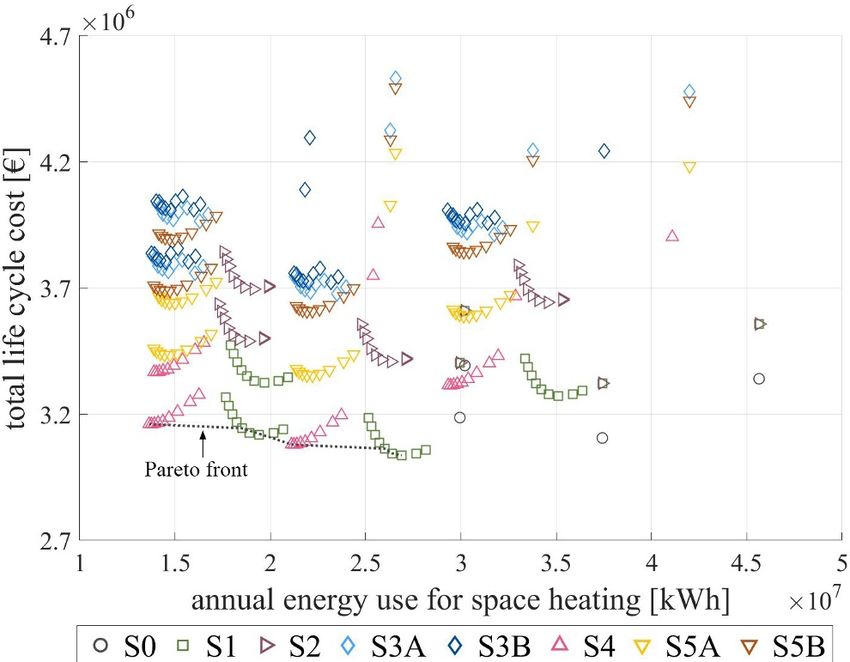
E3S Web of Conferences 172, 18003 (2020)                                                        http://doi.org/10.1051/e3sconf/202017218003
NSB 2020

       2.2.1 Existing façade properties                                  (C) are included to allow a more realistic comparison
                                                                         with the façade renovation scenarios. Per renovation
           The building façade consists of a concrete structure          scenario, an insulation thickness of 0mm is added. In this
       with uninsulated brick cavity walls in between the                way, conservation costs are estimated on the basis of a
       structure. Moreover, the façade is mainly clad with               cladding renewal and maintenance according to the
       60mm thick prefabricated concrete panels. Five                    related renovation scenario (i.e. C1, C2, C3A, C3B, C4,
       difference façade assemblies can be distinguished (E1-            C5A, C4B). This does not apply to the interior wall
       E5). The individual properties together with the window           insulation systems. Here, only an additional maintenance
       (W) properties are listed in Table 3. The windows are             cost related to the existing interior plaster is included.
       composed of an aluminium frame without thermal break                  Subsequently, four different window solutions are
       and single glazing. The roof and floor are assumed to be          defined: retaining the existing window (W0), replacing
       already insulated resulting in an U-value of 0.24 W/m²K           the single glazing by HR++ glazing (U=1.10 W/m²K)
       and 0.30 W/m²K, respectively. The total mean U-value              (W1), replacing the glazing and frame with HR++
       of the existing building is 2.53 W/m²K.                           glazing (U=1.10 W/m²K) and an aluminium window
           The analysis will also cover the results related to the       frame (U=2.10 W/m²K) (W2) or a PVC window frame
       original building before the renovation. This baseline            (U=1.90 W/m²K) (W3).
       scenario will be referred to as Scenario 0 (S0).                      The combination of all above mentioned measures
                   Table 2. Existing façade properties.
                                                                         described above results in 280 different combinations
                                                                         (10 insulation thicknesses, 7 wall systems, 4 window
                                Area             U                       scenarios).
                                [m²]          [W/m²K]
                    E1          2124            1.10
                    E2          524             2.68                     3 Results
                    E3          414             2.93
                                                                             This paper examines the impact of life-cycle
                    E4          344             1.44
                                                                         assessment on the initial Pareto optimal renovation set
                    E5          319             2.10
                                                                         outcome typically only based on the financial
                    W           1920            5,05
                                                                         construction costs and the energy performance. This part
                                                                         therefore highlights the importance of a multi-faceted
           As the financial system boundaries include
                                                                         decision-making basis. In particular, noticeable
       demolition costs and some renovation strategies require
                                                                         differences in trends are investigated, while less attention
       the demolition of the façade components, the existing
                                                                         is paid to the individual results. Moreover, the results are
       construction is also simulated in the LCC analyse. The
                                                                         solely based on one specific case. This paper therefore
       adopted renovation scenarios (S1-S5) will consequently
                                                                         does not intend to provide general guidelines about the
       differ in what part of the existing façade construction is
                                                                         best solution to be used in renovation projects.
       being demolished.
                                                                             The graphs shown in this section report all 280
                                                                         scenarios and the base-line scenario in one scatter plot.
       2.2.2 Façade renovation scenarios                                 This results in different point clouds with a specific
                                                                         colour (please refer to table 3 for the colour assigned to
       Table 3 gives an overview of all the different scenarios          each scenario). Each strategy consists of four linearly
       considered.                                                       curved point clouds associated with the four different
                  Table 3. Façade renovation strategies.
                                                                         window solutions, in which each individual point
                                                                         represents a different insulation thickness. The optimal
          Façade renovation scenarios                                    scenarios are encircled in black. This approach allows to
                                                                         easily interpret the figures and to quickly identify
          Interior – aerated concrete                       S1
                                                                         specific trends related to each studied scenario.
          Interior – timbre frame wall                      S2               In the section 3.1, the importance of a life-cycle
          Exterior – open joint concrete                   S3A           approach is first analysed comparing the initial financial
          Exterior – closed joint concrete                 S3B           costs with the life-cycle financial costs (Fig. 2) and the
          Exterior – ETICS                                  S4           initial environmental costs with the life-cycle
          Exterior – small glass fibre concrete            S5A
                                                                         environmental costs (Fig. 3). Further-more, the impact of
                                                                         a multi-objective approach is examined in the section 3.2
          Exterior – large glass fibre concrete            S5B
                                                                         by expressing the financial life-cycle results, the
                                                                         environmental life-cycle results as a function of the
           For each strategy, nine different insulation                  energy performance (Fig. 4-6). In order to show all
       thicknesses are included in the analysis, i.e. 50mm,              criteria in one blanket graph, the financial and
       60mm, 80mm, 100mm, 120mm, 140mm, 160mm,                           environmental life-cycle costs are enumerated and
       180mm and 200mm.                                                  depicted as a function of the operational energy use
           The baseline scenario (S0) is a rather unrealistic            (Fig. 7).
       scenario considering the age and the state of the
       building. If the building is not renovated, the
       maintenance will rise because of the more frequent
       repair works. Therefore, several conservation scenarios

                                                                     4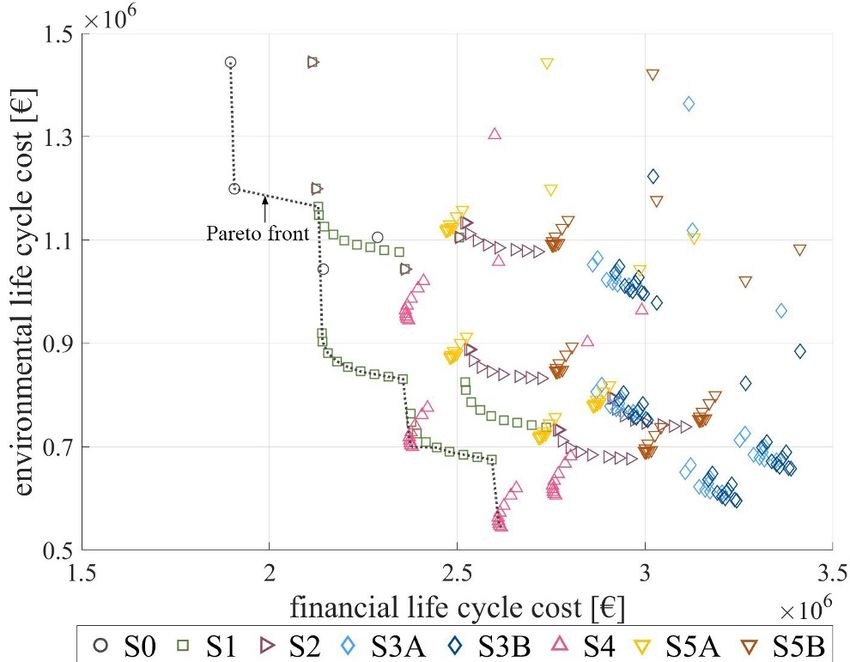
E3S Web of Conferences 172, 18003 (2020)                                                               http://doi.org/10.1051/e3sconf/202017218003
NSB 2020

               Fig. 2. Financial: initial versus life-cycle cost.                  Fig. 3. Environmental: initial versus life-cycle cost.

              Fig. 4. Financial versus environmental life-cycle cost.          Fig. 5. Financial life cycle cost versus operational energy use

         Fig. 6. Environmental life cycle cost versus operational energy use     Fig. 7. Total life cycle cost versus operational energy use

                                                                        5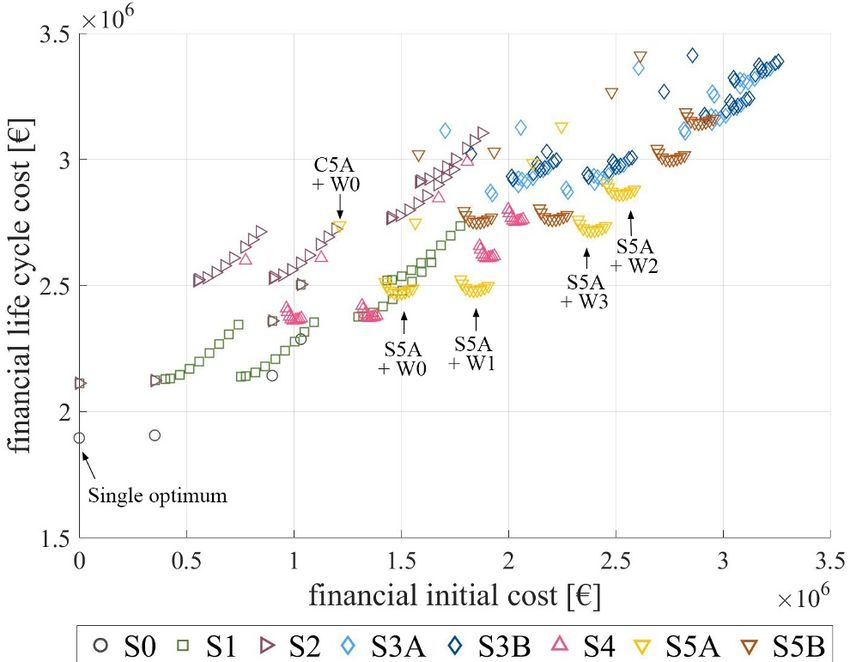
E3S Web of Conferences 172, 18003 (2020)                                                          http://doi.org/10.1051/e3sconf/202017218003
NSB 2020

       3.1 A life-cycle approach for decision-making                       the initial costs compared to the life-cycle costs. For the
                                                                           remaining strategies it is clear that the environmental
                                                                           optimum relates to an insulation thickness above
       3.1.1 Initial versus life-cycle financial cost
                                                                           200mm.
       Figure 2 compares the financial initial cost with the                   Furthermore, the steep downward trend of S1 and S4
       financial life-cycle cost. Considering all renovation               contrasts with the slow decline and spread initial costs of
       scenarios, only one Pareto optimum is noticed, i.e. the             S5A and S5B. Respectively, this indicates that only a
       non-renovated situation. In other words, no alternative             limited additional environmental cost is required for S1
       strategy has either a lower initial cost nor a lower life-          and S4 to achieve significant operational energy savings
       cycle cost. This is mainly due to the ratio of the different        and that, on the other hand, for S5A and S5B large
       contributing costs. The relatively large share of the               additional initial environmental costs yield small long-
       initial costs – up to 63% of the total lifecycle cost – as          term savings.
       opposed to the supplementary limited share of energy                    Furthermore, investing in new glazing and/or new
       cost, causes the various renovation measures not paying             PVC windows is profitable from an environmental point
       off compared to the non-renovated situation.                        of view as only the scenarios with new aluminium
           Furthermore, analysing the seven different                      windows are never part of the Pareto front.
       renovation strategies (colours) separately, the initial cost
       is in most cases not compensated by the resulting energy            3.2 A multidimensional approach for decision-
       savings. This is particularly evident on the basis of the               making
       upward trend of the interior insulation strategies S1 and
       S2. A higher initial cost always results in a higher life-
       cycle cost.                                                         3.2.1 Life-cycle financial versus environmental cost
           On the other hand, the results of scenarios S3A, S3B,
                                                                           Comparing Figure 2 and 3 already gives a first
       S4, S5A and S5B show that it is only profitable to invest
                                                                           impression of the importance of a multidimensional
       in renovation measures up to a certain insulation
                                                                           decision-making process. Pareto-optimal results related
       thickness. This is visible in Figure 2 based on the initial
                                                                           to financial and environmental costs clearly do not
       decreasing trend, which then increases again from the
                                                                           coincide given the observed opposite trends. Although it
       lowest life-cycle financial cost, i.e. the optimal insulation
                                                                           is rarely profitable to invest in renovation measures from
       thickness. The downward trend shows that for a small
                                                                           a financial point of view, not renovating is a sustainable
       additional investment, a considerable reduction of the
                                                                           option from an environmental point of view.
       life cycle cost is obtained.
                                                                               The discrepancies between, and relative weight of the
           Figure 2 also shows that none of the scenarios in
                                                                           financial life-cycle costs and the environmental life-
       which windows are replaced are part of the pareto front.
                                                                           cycle costs are shown in Figure 4. Considering all
       Hence, investing in more performant windows is not a
                                                                           renovation scenarios, 28 Pareto solutions are found. The
       cost-optimal choice.
                                                                           solutions contain scenario S0 with and without
                                                                           replacement of the glazing, various scenarios of S1
       3.1.2 Initial versus life-cycle environmental cost                  (50mm-60mm-W0, 50-200mm-W1, 120-200mm-W3)
                                                                           and of S4 (120mm-200mm-W2, 120mm-200mm-W3).
       Figure 3 in turn depicts the initial environmental cost as              The renovation strategies evaluated separately, show
       a function of the life-cycle environmental cost. The                remarkably different trends which correspond to the
       original non-renovated solution is only a pareto optimum            opposite trends mentioned before. The results regarding
       due to its zero initial cost, whereas the life cycle cost is        internal insulation strategies S1 and S2 show a similar
       significantly higher than the various alternative pareto            decreasing trend with a large spread in financial life-
       optimal scenarios. Note that, when assuming that only               cycle costs meaning that a large increase of the financial
       the cladding is renewed (cf. insulation thickness zero),            life-cycle costs leads to an small decrease of the
       not renovating the building is no longer an optimal                 environmental life-cycle cost resulting in several optimal
       option. The figure clearly shows that environmental                 solutions. On the other hand, the point cloud shape of
       considerations lead to solutions with a higher energy               S4, S5A and S5B is vertically curved. The kink in the
       performance. This is strongly related to the proportional           curve represents the scenario with the lowest financial
       contribution of the different phases to the life-cycle              life-cycle cost. From that point on a rather limited
       costs. In contrast to the financial results, the operational        financial increase leads to lower environmental life cycle
       energy savings (and thus environmental benefits) due to             costs causing larger insulation thicknesses to be more
       a larger insulation thickness outweighs the initial                 optimal.
       environmental cost.
           Analysing the considered renovation scenarios
       separately, all curved point clouds show a declining                3.2.2 Life-cycle financial cost versus operational
       trend up to a certain minimum. This is again linked to                     energy use
       reaching the optimal insulation thickness. In this study,
                                                                           In a best case scenario decisions are currently based on a
       this optimal insulation thickness is only reached for
                                                                           trade-off between the operational energy use for space
       strategy S5A and S5B due to the higher contribution of
                                                                           heating and the financial life-cycle cost. Figure 5 depicts

                                                                       6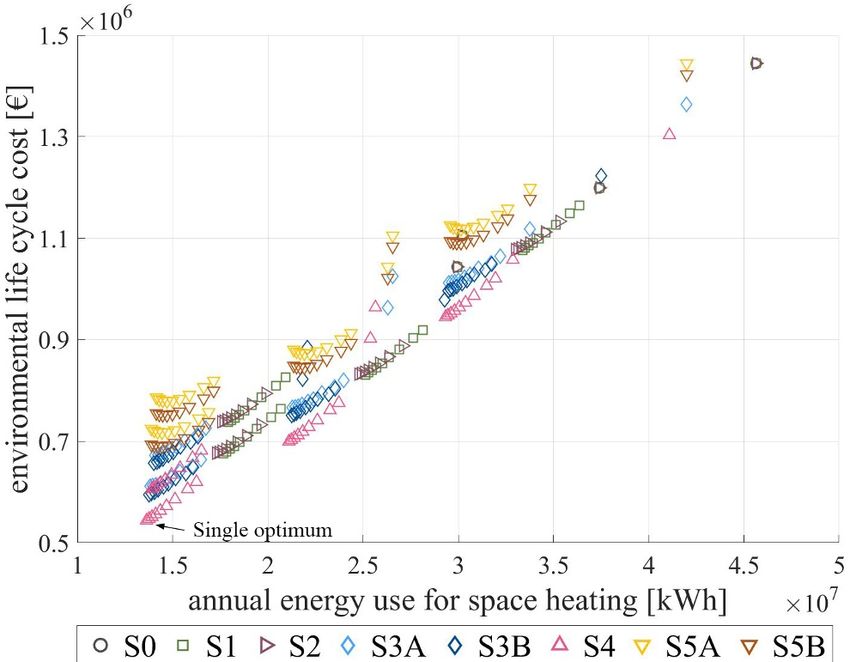
E3S Web of Conferences 172, 18003 (2020)                                                          http://doi.org/10.1051/e3sconf/202017218003
NSB 2020

       this relation. The same 28 Pareto optima are found as in                By depicting the initial costs in relation to the life-
       Figure 4. This does not mean that environmental                     cycle cost, life-cycle thinking seems relevant in the
       considerations are negligible, but this is largely due to           decision-making process both from a financial and an
       the small proportional contribution of the initial material         environmental point of view. Whereas the conventional
       impact on the total environmental cost.                             mind-set is to keep the construction costs to a minimum,
           While strategies S1 and S2 show a significant spread            annual operational energy savings could potentially
       of the financial life-cycle cost for a given decrease in            compensate the initial costs. This statement is verified
       operational energy use, there is only a limited difference          from an environmental perspective as the extra initial
       between the financial life-cycle costs regarding the other          cost to increase the insulation level is most often
       three strategies for the same decrease in operational               compensated by the associated energy savings.
       energy use.                                                         According to the financial results this applies only to a
                                                                           limited number of scenarios.
                                                                               Moreover, the results show that the financial and the
       3.2.3 Life-cycle   environmental           cost      versus
                                                                           environmental Pareto optimal solutions do not coincide.
             operational energy use
                                                                           This is mainly due to the different contribution of each
       As shown in Figure 6, an analogous comparison is made               life cycle phase regarding LCC and LCA. Considering a
       between lifecycle environmental costs and operational               lifespan of 30 years, the obtained operational energy
       energy use. Whereas 28 scenarios seem to be optimal                 savings do not compensate the initial financial cost
       from just a financial point of view, there is only one              leading to only one optimum, the non-renovated
       option Pareto optimal based on environmental                        situation. This is in contrast to the substantial
       considerations, namely scenario S4 with the largest                 contribution of the operational energy use to the
       insulation thickness (200mm). This option appears to be             environmental life-cycle costs resulting in multiple
       also optimal from a financial perspective.                          optima with a larger insulation thicknesses. However,
           Furthermore, a uniform linear trend can be identified           this proportional contribution is strongly dependent on
       for all considered strategies. For a specific decrease in           the assumed lifespan. While the operational phase will
       operational energy use, the environmental life-cycle cost           gain importance considering a longer lifespan, the
       decreases. The straight upward point clouds again                   influence of the operational energy costs will be limited
       emphasise the substantial contribution of the operational           for shorter lifespans.
       energy use in the LCA analysis compared to declining                    The combined Pareto front of both aspects correlates
       and horizontal point clouds of the LCC analysis.                    strongly with the financial figure. Although the financial
                                                                           aspects seem to dominate, adding the environmental cost
                                                                           to the financial cost eliminates financial-optimum
       3.2.4 Total life-cycle cost versus operational energy               options. causes a shift of the Pareto front to more
             use                                                           performant scenarios.
                                                                               Considering a life-cycle approach and multiple
       Finally, to get an idea of the Pareto optimal solutions
       taking into account both financial and environmental, the           dimensions in the decision-making process clearly
       environmental life-cycle cost is enumerated to the                  influences the cost-based results and provides a more
                                                                           substantiated evaluation of different renovation
       financial life-cycle cost and then plotted in relation to the
                                                                           strategies.
       operational energy use for space heating.
           The combined Pareto front, illustrated in Figure 7,
       strongly correlates with the financial figure based on the          References
       observed point cloud shapes. Although, the financial
       aspect seems to dominate, adding the environmental cost             1. I. Artola, K. Rademaekers, R. Williams, and J.
       to the financial cost eliminates some financial-optimal                Yearwood,. Boosting building renovation: What
       results excluding 20 options of the 28 financial optima.               potential and value for Europe? European Union
       This leaves 8 scenarios optimal.                                       (2016)
           Moreover, a shift of the Pareto front is noticed                2. European Commission. Going climate-neutral by
       leading to optimal solutions that have a larger insulation             2050: A strategic long-term vision for a prosperous,
       thickness. Note that, the original non-insulated situation             modern, competitive and climate-neutral EU
       is no longer part of the Pareto front.                                 economy. European commission: EU publications
                                                                              (2019)
       4 Conclusions                                                       3. BPIE. Future-proof buildings for all Europeans.
                                                                              BPIE Buildings Performance Institute Europe,
       The aim of this paper was to quantify the effect of                    Belgium (2019)
       integrating life-cycle and multidimensional thinking in             4. Eurima. Renovation tracks for Europe up to 2050.
       the decision-making process considering different                      Ecofys, Germany (2012)
       renovation strategies, in contrast to the standard
       approach which is only based on the financial                       5. K. Mjörnell, A. Boss, M. Lindahl, S. Molnar,
       construction costs and the operational energy use for                  Sustainability, 6, 4227-4245 (2014)
       space heating.                                                      6. L. Malmgren, K. Mjörnell, Sustainability, 7, 12521-
                                                                              12538 (2015)

                                                                       7
E3S Web of Conferences 172, 18003 (2020) http://doi.org/10.1051/e3sconf/202017218003
NSB 2020
7. D. Heidenthaler, M. Gnigler, M. Leeb, M.
Embacher, and P. Schweizer, P. IOP Conference
Series: Earth and Environmental Science,
323:012003 (2019)
8. W. Debacker, K. Allacker, L. Delem, A. Janssen, F.
De Troyer, C. Spirinckx, T. Geerken, and J. Van
Dessel, Delft University of Technology : ERSCP and
EMSU conference proceeding (2010)
9. G. Verbeeck, K.U. Leuven: PhD thesis (2007)
10. J. Van der Veken, J. Creylman, and T. Lenaerts,
Kenniscentrum Energie, Geel, Belgium (2013)
11. Aspen. Aspen index pro - nieuwbouw. Aspen , East
Flanders, Belgium (2014)
12. ABEX (2019). Historisch overzicht van de index: de
ABEX index sinds 1914. Retrieved from
https://www.abex.be/nl/indexen-tijdschriften/index-
abex/historisch-overzicht-van-de-index/
13. Eurostat. Gas prices for household consumers – bi-
annual data (from 2007 onwards). Eurostat (2019).
14. Aspen. Aspen index pro - renovatie. Aspen, East
Flanders, Belgium (2003).
15. K. Allacker, K.U.Leuven: PhD thesis 2010
16. Federal planbureau. Economische vooruitzichten
2019-2024 – versie van februari 2019. Federaal
Planbureau, Brussels, Belgium (2019)
17. Federal planbureau. Het Belgische energielandschap
tegen 2050 – Een projectie bij ongewijzigd beleid.
Federaal Planbureau, Brussels, Belgium (2017) (in
Dutch)
18. Ecoinvent Centre (2018). Ecoinvent 3.5. Available
at: https://www.ecoinvent.org/database/older-
versions/ecoinvent-35/ecoinvent-35.html
19. OVAM. Milieugerelateerde materiaal-prestatie van
gebouwelementen. OVAM, Mechelen, Belgium
(2012)
20. M.A.J. Huijbregts, et al., ReCiPe 2016: A
harmonized life cycle impact assessment method at
midpoint and endpoint level - Report I:
Characterization. RIVM Report 2016-0104 (2016)
21. C. Sáez, and J. Requena, Ecological Economics,
712-725 (2007)
22. K. Calle, De ontwikkeling van (kosten)optimale
gevelrenovatiestrategieën voor resientiële
hoogbouw. Ghent University: Master thesis (2015)
8You can also read