Industry Name - Oilfield Services Quarterly Update | Q3 2020
←
→
Page content transcription
If your browser does not render page correctly, please read the page content below

Oilfield Services
Quarterly Update | Q3 2020

[Industry Name]

                             MNPCF.ca
Market Update

  Alberta Oil Production Curtailment To Be Lifted By End Of 2020
  Since January 2019, the Alberta government has been limiting oil production to align with the province’s export
  capacity, attempting to protect the value of its oil by helping prevent Canadian crude from selling at large
  discounts. The price gap between western Canadian heavy crude and US light oil had ballooned to more than
  USD $40/barrel in late 2018.
  However, due to the COVID-19 pandemic and resulting economic downturn, forecasts show that inventories are
  expected to remain low, with sufficient export capacity to allow the industry to operate efficiently without
  government intervention. The government continues to have the regulatory authority to curtail oil production
  through December 2021, but with 16% of Alberta’s crude oil production still offline, the Alberta government will
  limit production only if emerging market conditions make the limits absolutely necessary.
  The Alberta government will monitor production, pipeline capacity, and rail shipments to ensure that production
  matches the provinces export capacity. Should forecasts show inventories approaching maximum capacity,
  production limits will be put back in place.1

  Alaska To Alberta Rail Line
                                                                 US President Donald Trump issued a presidential permit granting
                                                                 Alberta Railway Development Corporations (A2A) approval to
                                                                 build, own, and operate a $22 billion railway connecting the Alaska
      Delta                                                      Railroad and Alaska tidewater to Northern Alberta.
    Junction
                                                                 The proposed project would see a 2,570km rail line built from Fort
                                               Fort              McMurray, through the Northwest Territories and Yukon, and
                                             McMurray
                                                                 finishing at the Delta junction in Alaska, where it will join Alaska’s
                                                                 already existing rail which connects to ports near Anchorage. The
                                                                 proposed rail line is expected to transport oil, potash and ore,
                                Edmonton
                                                                 container goods, and even passengers.2

  Cenovus Energy To Buy Husky Energy
  On October 25, 2020, Cenovus Energy Inc. announced it has entered into a definitive agreement to purchase
  Huskey Energy Inc. for $3.8 billion in shares. The all-stock transaction was valued at USD $23.6 billion, inclusive
  of debt, creating the third-largest Canadian oil and natural gas producer by total production. The two Calgary-
  based companies will combine under the Cenovus Energy Inc. brand to create a resilient and integrated energy
  leader. Its headquarters will remain in Calgary, Alberta.
  Cenovus CEO Alex Pourbaix said the aim of the deal is to create a company that is stronger, more resilient, and
  operating with "significantly reduced" risk to market volatility. Pourbaix also said “we're going to see more
  continued consolidation.”3

Source: 1) Government of Alberta, Global News - Alberta to lift oil production curtailment at the end of 2020
        2) A2A Rail, CBC - Trump issues presidential permit authorizing $22B railway between Alaska and Alberta
        3) Cenovus website, CBC - Cenovus to buy Husky Energy for $3.8B, designed to 'weather the current environment'            Page 2
Market Update

  Alberta Plans To Export Hydrogen By 2040
  On October 6, 2020, Alberta Premier Jason Kenny announced Alberta will look to use its abundant reserves of
  natural gas to become an exporter of hydrogen by 2040. Hydrogen could play a significant role in Alberta’s
  transition to a cleaner and lower-carbon energy system.
  “The potential for hydrogen is huge,” Kenney said, adding that Alberta could potentially produce some of the
  lowest-cost hydrogen in the world. “Putting Alberta on the global hydrogen map now as this energy source is
  beginning to gain prominence, will be crucial for us to be at the forefront of future changes in energy.”
  Some major oil and gas companies such as Shell, Equinor, and BP have already invested millions on hydrogen
  pilot projects. Faced with low oil prices, restricted international activity, and growing concerns over greenhouse
  gas emissions, investing in hydrogen has taken on a new urgency in the Canadian oilsands.

  Continued Reading
  For additional information on the highlighted topics:

                        ALBERTA OIL PRODUCTION                                                     ALASKA TO ALBERTA
                             CURTAILMENT                                                               RAIL LINE

                          CENOVUS ENERGY AND                                                       ALBERTA HYDROGEN
                           HUSKY ENERGY DEAL                                                             PLANS

Source: Calgary Herald - Alberta announces plans to export hydrogen by 2040, EnergyNow.ca - Big Oil’s Long Bet on Hydrogen Offers a Climate Lifeline   Page 3
Industry Overview
Expert Thoughts

 Raj Sing, Founder & CEO – Fuelled Energy Marketing Inc.

 Fuelled Energy Marketing Inc. (“Fuelled”) operates as an oilfield equipment dealer in Canada. The Company
 offers online platforms for buying and selling oilfield equipment such as air compressors, amine plants, bullets,
 camps and accommodations, coolers, and dehydrators.
 Fuelled was also proud to be named the No. 5 Top Growing Company by the Globe and Mail and the top
 Alberta company on this year’s list.

 What have been the most significant changes that you have seen in the industry and/or your business in the
 past 12 months?
 “The volatility and downward pressure on energy prices has led to some interesting changes in our business and
 industry. With any two-sided marketplace (like Amazon), it is always a challenge to balance inventory and
 demand. The silver lining for Fuelled has been that during these challenging times, equipment owners are more
 motivated to sell equipment and buyers are looking to execute projects more quickly and cost effectively, which
 has led to some positive effects for our business. While capital spend in the industry is down significantly, we
 have still managed to on-board new sellers and buyers on our platform and are now experiencing strong
 positive network effects. Fuelled has also helped shift buying behavior and we are seeing buyers within and
 outside the energy space become more comfortable purchasing heavy equipment online from around the
 world.
 Another significant change for our business, has been in the growth of two newer business lines in Fuelled
 Appraisals and ARMOUREE. Both businesses are positioned well for uncertain and challenging environments.
 With Fuelled Appraisals, we use real data and technology to provide quick and credible equipment valuations,
 which are relied upon by lenders, insurance companies and others. ARMOUREE, which is our subscription
 business for inventory management and peer-to-peer sales (like Kijiji) has also seen strong growth with new
 customers such as the Orphan Well Association (OWA).”

 What challenges or opportunities do you see for your business in the next 12 months?
 “We see an opportunity in the next 12 months to exponentially increase the amount of equipment consigned to
 Fuelled and available online. We also believe that Fuelled will be well positioned to provide value to our
 marketplace participants during what we anticipate being a challenging time in the energy industry.
 Strategically we believe there is an opportunity to cross-verticals with our platform and business model and
 expect this to happen in the coming months. We are fortunate to have a strong and cohesive team at Fuelled
 and this along with our emphasis on culture will be key ingredients for tackling challenges and executing on
 opportunities in the next 12 months.”

                                                                                                             Page 4
MNP Insights
Alberta Oil Patch Market Updates

                                                                  WTI Versus WCS                                                                Q3
                  $90

                  $80

                  $70

                  $60
   $US/bbl

                  $50

                  $40

                  $30

                  $20

                  $10

                   $0

                                                               WCS                WTI               Spread

                                       Average Barrels Of Production Per Day In Alberta
                  4000                                                                                                                          140%

                  3750                                                                                                                          120%

                                                                                                                                                       WCS to WTI Discount
Barrels (000's)

                                                                                                                                                100%
                  3500
                                                                                                                                                80%
                  3250
                                                                                                                                                60%
                  3000
                                                                                                                                                40%

                  2750                                                                                                                          20%

                  2500                                                                                                                          0%
                         Nov

                         Nov

                         Nov
                          Jun
                           Jul

                          Jun
                           Jul

                          Jun
                           Jul
                         Feb
                         Mar

                         Sep

                         Dec

                         Feb
                         Mar

                         Sep

                         Dec

                         Feb
                         Mar

                         Sep

                         Dec
                         Apr
                         May

                         Apr
                         May
                         Aug

                         Oct

                          Jan

                         Aug

                         Oct
                          Jan

                         Apr
                         May

                         Aug

                         Oct

                          Jan

                         Q1     Q2          Q3       Q4          Q1        Q2          Q3        Q4          Q1           Q2          Q3   Q4

                                     2018                                       2019                                           2020

                                            Curtailment Limit                 Output                  WCS to WTI % Discount

Source: Alberta Government (https://www.alberta.ca/oil-production-limit.aspx), (https://www.alberta.ca/budget.aspx) and
(https://www.alberta.ca/alberta-petrochemicals-incentive-program.aspx#toc-0)                                                                      Page 5
Industry Overview
Private Placement, Public Offerings, And Shelf Registration
Canadian Oil And Gas Exploration And Production - Private Placements, Public
Transaction Volume (number of transactions)
400 Offerings, Shelf Registration 60
Transaction Value in ($CAD Billions)
329
300 12.09
233 3.75 40
202 235
200 22.17 0.95
28.42 13.38 166
116
16.53 113 20
100 15.62
1.08 10.33 1.00
1.00 19.93 2.65 7.06 1.25
5.77 5.18 2.38
4.46 6.99 1.47 6.89 1.49
3.46 1.50 1.78 1.00 0.75 1.34
- -
2014 2015 2016 2017 2018 2019 Q3 2020 YTD
Cenovus Energy Inc. Canadian Natural Resources Limited Suncor Energy Inc.
Husky Energy Inc. All other players Encana Corporation
Transaction volume
Canadian E&P Public Capital Raised
• Q3 2020 saw less Canadian Exploration and Production (E&P) capital raised than Q2 2020 ($3,013.0 million vs
$8,283.9 million, respectively). Over 85% of the capital raised came from public offerings by a two major players:
Cenovus Energy Inc. ($1,338.2 million), and Husky Energy Inc. ($1,249.9 million).
• $13,788.7 million of total capital has been raised YTD in 2020, much higher than the $3,267.0 million raised for the
same period in 2019.
Canadian Oilfield Services - Private Placements, Public Offerings, Shelf
80 Registration 5,000
Transaction Value in ($CAD Millions)
64 69
Transaction Volume (# of transactions)
62
4,000
60
1,954
429 150
52 3,000
40
34 110
2,000
589
1,875 2,013
20 360 600
200 19 5 1,000
315 1,723
433 498 469 150 946 87
- -
2014 2015 2016 2017 2018 2019 Q3 YTD 2020
Precision Drilling Corporation Shawcor Ltd. CES Energy Solutions Corp.
Trinidad Drilling Ltd. All other players Mullen Group Ltd.
Transaction volume
Canadian OFS Public Capital Raised
• A total of CAD $65.0 million OFS capital was raised in Q3 2020, compared to just $2.0 million raised in Q2 2020.
All of Q3’s capital raised came from 2 private placements: Calfrac Well Services at CAD $60.0 million, and HTC
Pureenergy Inc. at $5.0 million.
• CAD $86.9 million of total capital has been raised YTD in 2020, substantially lower than the CAD $1.8 billion raised
for the same period in 2019.
Source: Capital IQ. Data as of September 30, 2020.
Note: Data does not contain share buy-backs. Page 6
Industry Overview
M&A Transactions & Performance
Canada - Oilfield Services - M&A Transactions
Transaction Volume (Number of Deals)
1,400 9
Transaction Value ($CAD Millions)
1,288
8 8
1,200 7 7 8
6 7 973 7
1,000 6
1,047 6
5
800 5
4
600 4
3
342 3
400 2
185 199 2
200 58 46 1
22 1 3
- -
Q1 Q2 Q3 Q4 Q1 Q2 Q3 Q4 Q1 Q2 Q3
2018 2019 2020
Transaction value Transaction volume
Transaction Highlights
• In Q3 2020, disclosed transaction value increased dramatically to levels not seen since the end of 2018. However,
transaction volume fell even further as Q3 only saw 2 transactions in the oilfield equipment and services space.
• All of the disclosed transaction value for the quarter came from one large transaction; THRC Holdings, LP’s
unsolicited offer to Calfrac Well Services Ltd. for $972.6 million in early September. THRC Holdings, LP is an
affiliate of Wilks Brothers, LLC.
United States - Oilfield Services - M&A Transactions
100,000 27 27 27 30
Transaction Volume (Number of Deals)
91,964
Transaction Value ($CAD Millions)
90,000 24 24 23 25
80,000
70,000 18 19 19
20
60,000 15
50,000 15
40,000 10
25,728 10
30,000 21,956
20,000 5
3,693 7,672
10,000 2,181 3,394 63 580 325 740
- -
Q1 Q2 Q3 Q4 Q1 Q2 Q3 Q4 Q1 Q2 Q3
2018 2019 2020
Transaction value Transaction volume
Transaction Highlights
• In Q3 2020, transaction volume saw a slight rebound with 15 transactions compared to 10 transaction in the
previous quarter. Disclosed transaction value also saw an increase from the previous quarter but still remained in
the millions.
• The largest contribution to this quarters disclosed transaction value was Liberty Oilfield Services Inc.’s purchase of
Schlumberger Technology Corporation’s onshore hydraulic fracturing business in the United States and Canada
(“OneStim”) for $558.1 million.
Source: Capital IQ. Data as of September 30, 2020.
Notes: Transaction data may not include all OFS related transactions due to database limitations.
Oilfield services transactions include companies with head offices in other countries Page 7
Industry Overview
M&A Transactions & Performance
Canada - Oil And Gas Exploration And Production - M&A Transactions
$6 32 35
Transaction Volume (Number of Deals)
32
29 29
Transaction Value ($CAD Billions)
$5 30
4.8B 23
3.7B 25
$4 21 20 19
16 16 20
$3 15
15
$2 1.8B 1.6B
10
1.0B 1.0B
$1 5
0.3B 0.2B 0.3B 0.3B 0.3B
$0 -
Q1 Q2 Q3 Q4 Q1 Q2 Q3 Q4 Q1 Q2 Q3
2018 2019 2020
Transaction value Transaction volume
United States - Oil And Gas Exploration And Production - M&A Transactions
100 84 85 93.2B 90
Transaction Volume (Number of Deals)
90 75
Transaction Value ($CAD Billions)
80
73
80 70
60
70 60
51 60
60 47
42 50
50
38.6B 40
40 31.4B
27.4B 26
30
30 23.3B
13 20
20 10.6B
5.7B 8.0B
10 1.1B 1.9B 10
7.1B
- -
Q1 Q2 Q3 Q4 Q1 Q2 Q3 Q4 Q1 Q2 Q3
2018 2019 2020
Transaction value Transaction volume
Transaction Highlights
Canadian E&P saw both transaction volume and disclosed value increase in Q3 2020, with seven more transactions
and CAD $1.3 billion more capital deployed than the previous quarter. The two largest Canadian E&P transactions,
which made up a majority of the quarters disclosed value, were:
• ConocoPhillips purchase of certain assets of Kelt Exploration (LNG) Ltd. for CAD $551.0 million; and
• Canadian Natural Resources Limited’s acquisition of Painted Pony Energy Ltd. for CAD $504.7 million
US E&P transaction volume increased from 42 to 51 in Q3 2020 while disclosed transaction value grew substantially
to CAD $31.4 billion compared to a mere CAD $1.9 billion in Q2 2020. The most notable US E&P transaction for the
quarter was:
• The acquisition of Noble Energy by Chevron Corporation for roughly CAD $19.1 billion
Source: Capital IQ. Data as of September 30, 2020. .
Notes: Transaction data may not include all OFS related transactions due to database limitations.
Oilfield services transactions include companies with head offices in other countries
Cenovus Energy Inc. and Husky Energy Inc. deal not included in transaction data as it falls under Q4 2020. Page 8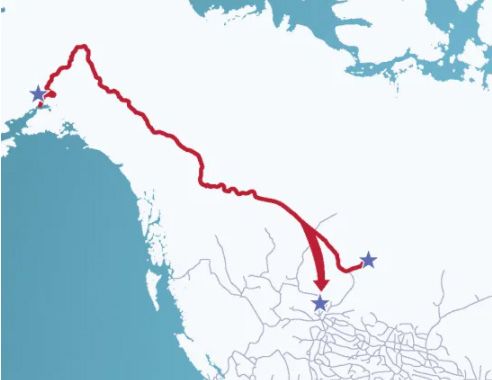
Pipeline Q3 Update

                               Enbridge To Resume Line 5 Operations In The Straits Of
                               Mackinac
                               On September 9, 2020, Enbridge announced it will restart the east segment of Line 5
                               in the Straits of Mackinac after receiving authorization from the Pipeline and
                               Hazardous Materials Safety Administration (PHMSA) and approval from the Michigan
                               Circuit Court.
                               Vern Yu, Executive Vice President and President of Liquids Pipelines said, "The
                               decision to allow the restart of the east segment of Line 5 is very positive for the
                               many residents and businesses in Michigan and the Great Lakes region who depend
                               on the energy Line 5 delivers.“1

                               Construction To Start On The 2021 NGTL System
                               Expansion Project
                               On October 20, 2020, TC Energy Corporation received approval from the
                               Government of Canada for its 2021 NOVA Gas Transmission Ltd. (“NGTL”) System
                               Expansion Project, and is awaiting the details of the updated conditions to be
                               released.
                               The company expects that the approval will allow it to immediately progress
                               construction activities in accordance with regulatory requirements, with compressor
                               station field work expected to begin in December 2020 and pipeline construction
                               activities expected to start in January 2021.2

                               TC Energy Announces Wisconsin Access Project On ANR
                               Pipeline System
                               On October 29, 2020, TC Energy Corporation announced that it will move forward
                               with its Wisconsin Access Project to increase natural gas capacity, improve reliability,
                               and reduce emissions on a highly-utilized segment of its ANR Pipeline system.
                               The Wisconsin Access Project involves meter station upgrades, and compressor
                               station modifications for enhanced operational flexibility and emissions-cutting
                               horsepower replacements.
                               The project is targeted to be brought in service in the second half of 2022.2

Source: 1) Enbridge website,
        2) TC Energy website                                                                                      Page 9
Industry Overview
Select M&A Transactions

                                                                 • Artera Services, LLC provides construction and
                                   Announced     Aug 26, 2020      maintenance services to energy utilities,
                                                                   infrastructure companies, municipalities, and
                                   TEV           Not disclosed     cooperatives in the United States.
      acquired
                                   TEV/EBITDA    Not disclosed
                                                                 • Otis Eastern Service, LLC provides oil and gas field
                                                                   services and pipeline construction services. The
                                   TEV/Revenue   Not disclosed     company operates as a constructor of gathering
                                                                   systems for producers and for pipelines of
                                                                   midstream and transmission companies.

                                                                 • THRC Holdings, LP is an affiliate of Wilks Brothers,
                                   Announced     Sept 1, 2020      LLC, owned by Texas-based investors Dan and Farris
THRC Holdings, LP                                                  Wilks.
                                   TEV           $972.6MM
      acquired                                                   • Calfrac Well Services Ltd. offers hydraulic fracturing,
                                   TEV/EBITDA    35.32x
                                                                   coiled tubing, cementing, other well stimulation, and
                                                                   pressure pumping services to oil and natural gas
                                   TEV/Revenue   0.80x             industries.

                                                                 • Liberty Oilfield Services Inc. provides hydraulic
                                   Announced     Sept 1, 2020      fracturing services to onshore oil and natural gas
                                                                   E&P companies in North America.
                                   TEV           $558.1MM
      acquired                                                   • OneStim Business, previously owned by
                                   TEV/EBITDA    1.54x
                                                                   Schlumberger Technology Corporation, comprises
                                                                   onshore hydraulic fracturing business in the United
                                   TEV/Revenue   0.13x             States and Canada, including: pressure pumping,
OneStim Business                                                   pumpdown perforating, and Permian fracturing sand
                                                                   businesses.

                                                                 • LineStar Integrity Services, LLC provides integrated
                                   Announced     Sept 2, 2020      solution for all pipeline and facility maintenance.
                                                                   LineStar Integrity Services, LLC was formerly known
                                   TEV           Not disclosed     as EMS Energy Services, LLC.
      acquired
                                   TEV/EBITDA    Not disclosed
                                                                 • Energy Project Solutions LLC offers compliance
                                                                   management services that includes program
                                   TEV/Revenue   Not disclosed     development, jurisdictional analysis, audit support,
                                                                   operator qualification training, permitting, O&M field
                                                                   tasks, and ILI management.
Source: Capital IQ.
All figures are in CAD millions.                                                                                    Page 10
Industry Overview
Natural Gas Performance
Natural Gas Prices: Henry Hub vs. AECO
6
5
4
CAD/MMBtu
3
2
1
0
Henry Hub AECO Spread
Canadian Natural Gas Storage
30,000
25,000
Cubic Meters (Millions)
20,000
15,000
10,000
5,000
-
Natural Gas Storage 5 Year Max 5 Year Min
Sources: GLJ Petroleum Consultants Commodity Price Forecasts as at Oct 27, 2020.
Canadian Gas Association as at Oct 27, 2020
Note: September natural gas storage data is not available. Page 11Industry Overview
Rig Count & Land Sales
Total Rig Count: Canada vs. United States
Q3
1,200
1,000
800
Total Rigs
600
400
200
0
Canada USA
Oil & Gas Land Sales - Alberta, BC, And Saskatchewan
2,500 $3,000
Land sales have incurred
delays and postponements due
to the COVID-19 pandemic $2,500
2,000
$2,000
In 000s Hectares Sold
1,500
$1,500 Avg$/Ha
1,000
$1,000
500
$500
0 $-
2013 2014 2015 2016 2017 2018 2019 Q3 2020 YTD
British Columbia Saskatchewan Alberta
BC Avg$/Ha Sask Avg$/Ha AB Avg$/Ha
Sources: Government of Alberta, B.C., and Saskatchewan; Data as of September 30, 2020.
Baker Hughes rig count report as at September 30, 2020. Page 12Public Comparable Analysis
Performance Analysis
40%
Oilfield Service Group Share Prices
20%
0%
-22.20%
-20% -22.17%
-38.16%
-40% -50.31%
-54.87%
-60%
-59.61%
-80%
-60.59%
-100%
Oil and Gas Drilling Oil and Gas Field Services Oil and Gas Machinery and Equipment
Oil and Gas Storage and Transportation Integrated Oilfield Services Camp Accomodations
Oil and Gas Software Solutions
16.00x
Oilfield Service Group EBITDA Multiples
14.00x
12.00x 11.97x
10.00x
8.86x
8.00x
6.00x 6.31x
5.16x
5.04x
4.00x 4.33x
3.33x
2.00x
0.00x
Oil and Gas Machinery and Equipment Oil and Gas Field Services Oil and Gas Drilling
Camp Accomodations Oil and Gas Software Solutions Oil and Gas Storage and Transportation
Integrated Oilfield Services
Source: Capital IQ. Data as of September 30, 2020.
Above noted oilfield service peer groups are market capitalization weighted indexes. Page 13Public Comparable Analysis
Growth, Margins & Multiples
Median Revenue Growth (LTM) Median Revenue Growth (NTM)
-15% -20%
Software Solutions -21% Software Solutions -21%
Camp Accomodation 0% Camp Accomodation -4%
Storage and Transportation -10% Storage and Transportation 4%
Integrated Oilfield Services -27% Integrated Oilfield Services -33%
Machinery and Equipment -14% Machinery and Equipment -38%
Field Services -10% Field Services -19%
Drilling -24% Drilling -29%
-30% -25% -20% -15% -10% -5% 0% 5% -40% -30% -20% -10% 0% 10%
Median EBITDA Margin (LTM) Median EBITDA Margin (NTM)
19% 17%
Software Solutions 36% Software Solutions 30%
Camp Accomodation 20% Camp Accomodation 17%
Storage and Transportation 31% Storage and Transportation 32%
Integrated Oilfield Services 8% Integrated Oilfield Services 8%
Machinery and Equipment 15% Machinery and Equipment 13%
Field Services 9% Field Services 9%
Drilling 15% Drilling 14%
0% 5% 10% 15% 20% 25% 30% 35% 40% 0% 5% 10% 15% 20% 25% 30% 35%
Median EV/EBITDA (LTM) Median EV/EBITDA (NTM)
6.3x 8.5x
Software Solutions 3.5x Software Solutions 10.9x
Camp Accomodation 5.6x Camp Accomodation 6.4x
Storage and Transportation 11.2x Storage and Transportation 9.7x
Integrated Oilfield Services 8.0x Integrated Oilfield Services 9.2x
Machinery and Equipment 3.3x Machinery and Equipment 7.0x
Field Services 7.6x Field Services 4.8x
Drilling 4.9x Drilling 11.7x
0x 5x 10x 15x 0x 2x 4x 6x 8x 10x 12x 14x
Source: Capital IQ. Data as of September 30, 2020.
Above noted oilfield service peer groups are market capitalization weighted indexes.
LTM refers to last twelve months. NTM refers to next twelve months. Figures above are based on median peer group metrics. Page 14Public Comparable Analysis
Trading Multiples & Operating Statistics
(Figures in $CAD Millions, except percentages and ratios)
LTM Operating Figures NTM Consensus Estimates Valuation
Market Enterprise Revenue EBITDA Revenue EBITDA NTM LTM LTM
Company Capitalization Value Revenue Growth EBITDA Margin Growth Margin EV/EBITDA EV/EBITDA EV/REV
Oil and Gas Drilling
Precision Drilling Corporation $228 $1,570 $1,106 (30.7%) $307 27.7% (26.5%) 23.8% 8.6x 4.4x 1.2x
Ensign Energy Services Inc. $94 $1,570 $1,348 (7.5%) $287 21.3% (42.0%) 23.1% 9.2x 5.5x 1.2x
Stampede Drilling Inc. $12 $21 $24 17.9% $4 15.1% N/A N/A - 5.9x 0.9x
AKITA Drilling Ltd. $12 $86 $141 (24.2%) $18 12.8% (18.9%) 16.2% 9.0x 4.0x 0.5x
PHX Energy Services Corp. $80 $106 $337 (4.5%) $48 14.3% (53.5%) 9.1% 8.5x 2.2x 0.3x
Western Energy Services Corp. $25 $240 $122 (43.0%) $22 17.8% (4.9%) 10.9% 85.8x 9.9x 1.5x
Cathedral Energy Services Ltd. $5 $27 $79 (49.4%) ($6) (7.5%) (32.3%) 2.7% 54.0x NM 0.3x
Median $25 $106 $141 (24.2%) $22 15.1% (29.4%) 13.6% 9.1x 4.9x 0.9x
Mean $65 $517 $451 (20.2%) $97 14.5% (29.7%) 14.3% 29.2x 5.3x 0.9x
Oil and Gas Field Services
Mullen Group Ltd. $880 $1,397 $1,181 (8.9%) $218 18.4% 3.0% 17.7% 6.9x 6.7x 1.1x
Calfrac Well Services Ltd. $23 $877 $1,113 (45.3%) $25 2.3% (46.6%) 5.4% NM 34.7x 0.8x
STEP Energy Services Ltd. $35 $239 $540 (30.1%) $42 7.9% (43.0%) 2.4% 25.1x 5.6x 0.4x
Macro Enterprises Inc. $71 $75 $285 (28.2%) $30 10.6% (18.7%) 12.9% 2.5x 2.5x 0.3x
Essential Energy Services Ltd. $19 $29 $119 (28.5%) $10 8.3% (31.1%) 8.7% 4.6x 2.9x 0.2x
Vertex Resource Group Ltd. $18 $108 $151 (12.1%) $20 13.5% 9.4% 15.7% 4.2x 5.3x 0.7x
ENTREC Corporation $3 $251 $180 4.1% $27 15.1% N/A N/A - 9.2x 1.4x
ClearStream Energy Services Inc. $3 $318 $484 37.8% $16 3.3% N/A N/A - 19.9x 0.7x
Cordy Oilfield Services Inc. $3 $20 $17 7.1% $2 13.4% N/A N/A - 8.6x 1.1x
Wolverine Energy and Infrastructure Inc. $42 $160 $228 188.0% $17 7.4% 72.6% 7.3% 5.0x 9.5x 0.7x
Median $21 $200 $257 (10.5%) $23 9.4% (18.7%) 8.7% 4.8x 7.6x 0.7x
Mean $110 $347 $430 8.4% $41 10.0% (7.8%) 10.0% 8.0x 10.5x 0.7x
Oil and Gas Machinery and Equipment
Enerflex Ltd. $414 $865 $1,672 (13.8%) $306 18.3% (39.7%) 12.7% 6.4x 2.8x 0.5x
CES Energy Solutions Corp. $207 $534 $1,140 (14.4%) $135 11.9% (37.9%) 7.3% 10.7x 4.0x 0.5x
Total Energy Services Inc. $102 $349 $528 (40.5%) $99 18.7% (31.9%) 14.6% 7.0x 3.5x 0.7x
McCoy Global Inc. $12 $17 $49 (9.2%) $6 11.8% N/A N/A - 3.0x 0.4x
Median $155 $442 $834 (14.1%) $117 15.1% (37.9%) 12.7% 7.0x 3.3x 0.5x
Mean $184 $441 $847 (19.5%) $136 15.2% (36.5%) 11.5% 8.0x 3.3x 0.5x
Integrated Oilfield Services
Secure Energy Services Inc. $217 $735 $2,116 (29.2%) $138 6.5% (8.0%) 6.4% 6.3x 5.2x 0.3x
Trican Well Service Ltd. $303 $295 $513 (29.5%) $20 4.0% (51.4%) 4.3% 39.3x 14.5x 0.6x
High Arctic Energy Services Inc $32 $19 $148 (24.3%) $14 9.4% (39.9%) 10.1% 2.1x 1.4x 0.1x
CWC Energy Services Corp. $71 $97 $96 (22.4%) $9 9.4% (27.0%) 9.3% 12.1x 10.8x 1.0x
Median $144 $196 $331 (26.7%) $17 7.9% (33.5%) 7.9% 9.2x 8.0x 0.4x
Mean $156 $286 $718 (26.3%) $45 7.3% (31.6%) 7.5% 15.0x 8.0x 0.5x
Oil and Gas Storage and Transportation
Enbridge Inc. $78,780 $157,749 $43,919 (10.4%) $12,482 28.4% (1.4%) 31.7% 11.4x 12.6x 3.6x
TC Energy Corporation $52,541 $106,840 $13,204 (9.5%) $9,501 72.0% 3.7% 70.2% 11.2x 11.2x 8.3x
Pembina Pipeline Corporation $15,538 $30,051 $6,393 (15.3%) $2,737 42.8% 13.0% 45.7% 9.1x 11.0x 4.7x
Inter Pipeline Ltd. $5,610 $12,821 $2,378 (9.1%) $1,004 42.2% (8.2%) 43.1% 13.6x 12.8x 5.4x
Keyera Corp. $4,443 $7,565 $3,410 (16.8%) $1,045 30.7% (2.8%) 24.3% 9.2x 7.2x 2.2x
Gibson Energy Inc. $3,156 $4,477 $5,913 (17.0%) $482 8.1% 26.1% 6.1% 9.7x 9.3x 0.8x
Tidewater Midstream and Infrastructure Ltd. $267 $1,310 $844 87.7% $89 10.5% 54.1% 14.9% 6.8x 14.8x 1.6x
Median $5,610 $12,821 $5,913 (10.4%) $1,045 30.7% 3.7% 31.7% 9.7x 11.2x 3.6x
Mean $22,905 $45,830 $10,866 1.4% $3,906 33.5% 12.1% 33.7% 10.1x 11.3x 3.8x
Camp Accomodations
Civeo Corporation $153 $645 $749 18.2% $151 20.2% (4.1%) 17.4% 6.4x 4.3x 0.9x
Horizon North Logistics Inc. $331 $482 $277 - $34 12.4% 119.9% 10.7% 7.3x 14.1x 1.7x
Black Diamond Group Limited $82 $215 $176 0.3% $38 21.8% (4.1%) 22.9% 5.5x 5.6x 1.2x
Median $153 $482 $277 0.3% $38 20.2% (4.1%) 17.4% 6.4x 5.6x 1.2x
Mean $189 $448 $400 6.2% $75 18.1% 37.2% 17.0% 6.4x 8.0x 1.3x
Oil and Gas Software Solutions
Pason Systems Inc. $445 $275 $241 (24.4%) $78 32.5% (39.3%) 4.6% 35.9x 3.5x 1.1x
Computer Modelling Group Ltd. $414 $405 $74 (2.5%) $35 46.8% (8.6%) 46.3% 12.9x 11.6x 5.4x
ION Geophysical Corporation $30 $204 $238 (12.7%) $85 35.7% (33.9%) 14.7% 8.9x 2.5x 0.9x
Dawson Geophysical Company $55 $23 $148 (20.8%) $11 7.3% N/A N/A - 1.0x 0.1x
Pulse Seismic Inc. $39 $69 $12 (45.0%) $7 60.5% 52.0% 75.7% 4.6x 9.4x 5.7x
Median $55 $204 $148 (20.8%) $35 35.7% (21.3%) 30.5% 10.9x 3.5x 1.1x
Mean $197 $195 $143 (21.1%) $43 36.5% (7.5%) 35.3% 15.6x 5.6x 2.7x
Source: Capital IQ. Data as of September 30, 2020.
LTM refers to last twelve months. NTM refers to next twelve months. Page 15About Us
MNP Corporate Finance (MNPCF) has a dedicated team of over 50 Recently Closed Deals
merger, acquisition, and transaction professionals across Canada.
MNPCF works with clients in virtually all industries as they prepare, (National)
plan and execute transactions.
Our typical transactions range in value between $3 million and
$300 million.
Local and International Reach
MNP is a participating firm within Praxity, a unique global alliance of
independent accounting/advisory firms created to answer global
business needs. As a member of Praxity, we are able to offer access
to corporate finance, accounting and tax advisory services
worldwide. We are also affiliated with Corporate Finance Cross
Border, which consists of 150+ M&A professionals in more than 25
countries.
Services
• Divestitures • Due Diligence
• Acquisitions • Transaction Advisory
• Debt Financing Services
Page 16About Us
Deal Experience Recently Closed Deals
(National)
Since our inception, our team has advised on hundreds of
transactions, in a wide range of industries with diverse enterprise
values. In the past five years alone we have completed over 120
transactions worth over $2 billion (not including due diligence
engagements).
Industry Experience
• Food & Beverage • Transportation
• Retail & Distribution • Construction
• Manufacturing • Software
• Agriculture • Financial Services
• Automotive • Technology
• Materials • Energy
• Health Care • Oilfield Services
• Pharmaceutical • Real Estate
Hands-on Approach
Current M&A transactions require a hands-on approach from start
to finish including the active engagement of senior resources. Our
senior resources are dedicated to our clients and are available as
necessary and appropriate. We keep our clients regularly informed
of the engagement status, issues we are encountering, successes,
and overall progress.
Integrated Service Offering
We draw on the vast experience and deep specialist knowledge
network of our partners locally, nationally and internationally as
specialty issues arise, such as pre-transaction tax planning,
transaction structuring, estate planning, valuation, due diligence,
performance improvement, and risk management.
Page 17Leadership Team
Transaction Leadership
Brett Franklin Aleem Bandali Dale Antonsen Mike Reynolds
President Managing Director Managing Director Managing Director
Brett.Franklin@mnp.ca Aleem.Bandali@mnp.ca Dale.Antonsen@mnp.ca Mike.Reynolds@mnp.ca
204.336.6190 778.374.2140 250.979.2578 587.702.5909
Mark Regehr Erik St-Hilaire Stephen Shaw Dan Porter
Managing Director Managing Director Managing Director Managing Director
Mark.Regehr@mnp.ca Erik.St-Hilaire@mnp.ca Stephen.Shaw@mnp.ca Dan.Porter@mnp.ca
780.969.1404 204.336.6200 416.515.3883 416.515.3877
Kevin Tremblay Jon Edgett Patrick Khouzam Craig Maloney
Managing Director Managing Director Managing Director Managing Director
Kevin.Tremblay@mnp.ca Jon.Edgett@mnp.ca Patrick.Khouzam@mnp.ca Craig.Maloney@mnp.ca
647.943.4051 519.772.7460 514.228.7874 902.493.5430
Due Diligence Leadership
Johnny Earl John Caggianiello
Managing Director Managing Director
Johnny.Earl@mnp.ca John.Caggianiello@mnp.ca
604.637.1514 416.513.4177
MNPCF.ca
Page 18You can also read