Reliability Outlook An adequacy assessment of Ontario's electricity system April 2021 to September 2022
←
→
Page content transcription
If your browser does not render page correctly, please read the page content below

2.

Reliability Outlook
An adequacy assessment of Ontario’s
electricity system

April 2021 to September 2022
Executive Summary
More than 12 months have now elapsed since the COVID-19 pandemic was declared, and Ontario’s
economy has started to rebound, which has increased demand for electricity. By the end of 2020,
energy consumption in most sectors – including manufacturing – had returned to pre-COVID levels.
However, this recovery has not been universal, and the economic disruption in some sectors will
continue a little longer.
Electricity demand will increase over the forecast horizon, but the rate of recovery remains hard to
predict. Demand in 2021 is expected to reach 133.5 terawatt-hours (TWh), representing a 1.0%
increase over 2020 but still less than the total for 2019 (134.2 TWh). Increasing vaccination levels
are expected to prompt many companies to call for a return to office, but a significant portion of
Ontario’s workforce is likely to continue working from home for the remainder of 2021. The outcome
of these higher residential loads is a power system that is more weather sensitive than it was before
COVID.
Under normal weather conditions, Ontario will have sufficient capacity throughout the entire Outlook
period, including the summer of 2021, when 992.1 megawatts (MW) of capacity that was acquired in
the December 2020 capacity auction is available.
Supply will also be adequate to meet needs in winter 2021/2022. Under extreme weather conditions,
however, reserves may fall short for 10 weeks in the summer of 2022. This potential shortfall is
partially attributed to planned generator outages scheduled during those weeks, and generators are
advised not to schedule routine outages during this period. Any remaining shortfalls in reserves will
be addressed by acquiring resources in the December 2021 Capacity Auction. If extreme weather
conditions materialize, the IESO may reject some generator maintenance outage requests to ensure
that Ontario demand is met during the summer peak periods. Looking ahead, the IESO will continue
to use capacity auctions as the primary tool to meet capacity needs arising in Ontario in the short
term.
The province’s transmission system also plays a critical role in ensuring reliability. For the next 18
months, Ontario’s transmission system is expected to continue operating reliably despite occasional,
normal contingencies. That said, some combinations of transmission and/or generation outages may
pose operating challenges. A number of high-priority transmission projects are underway in different
regions with a view to enhancing existing service or accommodating growth.

Reliability Outlook | March 2021| Public                                                                 1
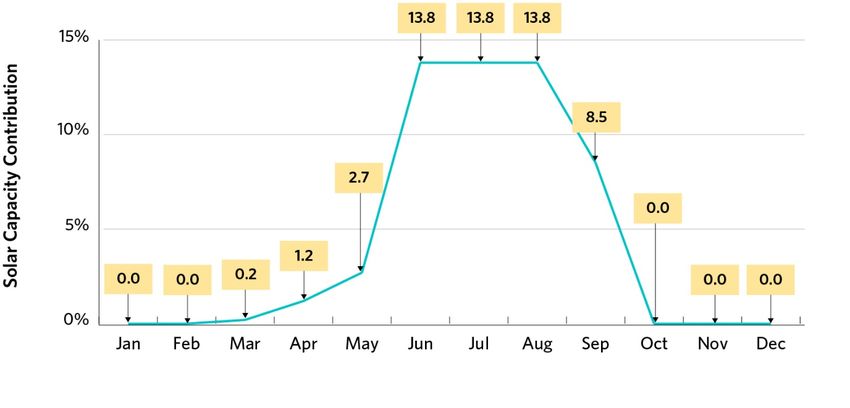
Table of Contents
Executive Summary                                                                               1

1.         Introduction                                                                         5

2.         Updates to this Outlook                                                              6
     2.1       Updates to the Demand Forecast                                                   6
     2.2       Updates to Resources                                                             6
     2.3       Updates to the Transmission Outlook                                              6

     2.4       Updates to the Operability Outlook                                               6

3.         Demand Forecast                                                                      7

4.         Resource Adequacy                                                                   12
     4.1       Assessment Assumptions                                                          13
           4.1.1      Generation Resources                                                     13
           4.1.2      Generation Capability                                                    15
           4.1.3      Demand Measures                                                          17
           4.1.4      Firm Transactions                                                        17

           4.1.5      Summary of Scenario Assumptions                                          18
     4.2       Capacity Adequacy Assessment                                                    20
           4.2.1      Firm Scenario with Normal and Extreme Weather                            20
           4.2.2      Planned Scenario with Normal and Extreme Weather                         21
           4.2.3 Comparison of the Current and Previous Weekly Adequacy Assessments for the Firm
           Extreme Weather Scenario                                                             22
     4.3       Energy Adequacy Assessment                                                      23

           4.3.1      Summary of Energy Adequacy Assumptions                                   23
           4.3.2      Results – Firm Scenario with Normal Weather                              24
           4.3.3      Findings and Conclusions                                                 24

5.         Transmission Reliability Assessment                                                 27
     5.1       Transmission Projects                                                           27

Reliability Outlook | March 2021| Public                                                         2
5.2       Transmission Outages                                                                                                 27
     5.3       Transmission Considerations                                                                                          27

6.         Operability                                                                                                              30
     6.1       Surplus Baseload Generation                                                                                          30

7.         Resources Referenced in This Report                                                                                      33

8.         List of Acronyms                                                                                                         34

List of Figures
Figure 4-1 | Monthly Wind Capacity Contribution Values .................................................. 16

Figure 4-2 | Monthly Solar Capacity Contribution Values .................................................. 17

Figure 4-3 | Comparison of Normal and Extreme Weather: Firm Scenario Reserve Above
Requirement ......................................................................................................................... 21

Figure 4-4 | Comparison of Normal and Extreme Weather: Planned Scenario Reserve
Above Requirement.............................................................................................................. 22

Figure 4-5 | Comparison of Current and Previous Outlook: Firm Scenario Extreme
Weather Reserve Above Requirement ................................................................................ 23

Figure 4-6 | Forecast Energy Production by Fuel Type ...................................................... 25

Figure 4-7 | Forecast Monthly Energy Production by Fuel Type ........................................ 25

Figure 6-1 | Minimum Ontario Demand and Baseload Generation .................................... 30

Figure 6-2 | Minimum Ontario Demand and Baseload Generation .................................... 31

Figure 6-3 | Monthly Off-Peak Wind Capacity Contribution Values .................................. 32

Reliability Outlook | March 2021| Public                                                                                              3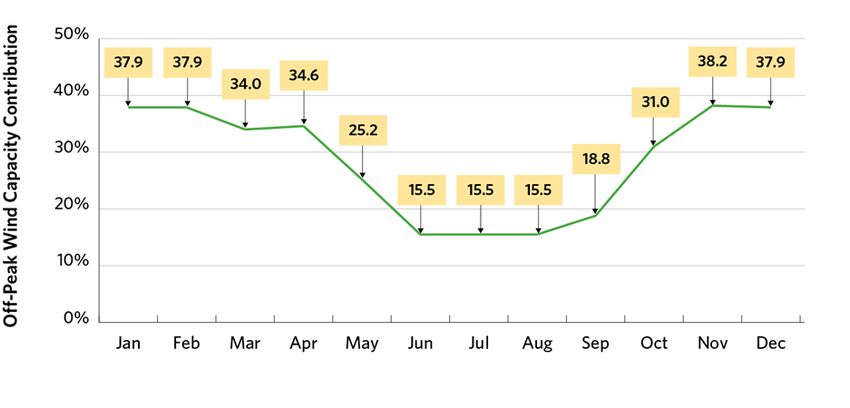
List of Tables
Table 3-1 | Forecast Energy Demand Summary ................................................................... 8

Table 3-2 | Forecast Seasonal Peaks .................................................................................... 8

Table 3-3 | Weekly Energy and Peak Demand Forecast ...................................................... 8

Table 4-1 | Existing Grid-Connected Resource Capacity ................................................... 13

Table 4-2 | Committed Generation Resources Status ........................................................ 14

Table 4-3 | Monthly Historical Hydroelectric Median Values for Normal Weather
Conditions............................................................................................................................. 15

Table 4-4 | Summary of Available Resources under Normal Weather .............................. 19

Table 4-5 | Summary of Zonal Energy for Firm Scenario Normal Weather ....................... 24

Table 4-6 | Energy Production by Fuel Type for the Firm Scenario Normal Weather ....... 26

Table 7-1 | Additional Resources ........................................................................................ 33

Reliability Outlook | March 2021| Public                                                                                                4
1. Introduction
This Outlook covers the 18 months from April 2021 to September 2022, and supersedes the Outlook
released on December 16, 2020.
The purpose of the 18-month horizon in the Reliability Outlook is to:
•    Advise market participants of the resource and transmission reliability of the Ontario electricity
     system
•    Assess potentially adverse conditions that might be avoided by adjusting or coordinating
     maintenance plans for generation and transmission equipment
•    Report on initiatives being implemented to improve reliability within this time frame
This Outlook assesses resource and transmission adequacy based on the stated assumptions,
following the Methodology to Perform the Reliability Outlook. Due to uncertainties associated with
various assumptions, readers are encouraged to use their judgment in considering possible future
scenarios.
Additional supporting documents are located on the IESO website.
Security and adequacy assessments are published on the IESO website on a daily basis and
progressively supersede information presented in this report.
For questions or comments on this Outlook, please contact us at 905-403-6900 (toll-free 1-888-448-
7777) or customer.relations@ieso.ca.

Reliability Outlook | March 2021| Public                                                                  5
2. Updates to this Outlook
2.1 Updates to the Demand Forecast
The demand forecast used in this Outlook is informed by actual demand, weather and economic data
through to the end of January 2021, and has been updated to reflect the most recent economic
projections. Actual weather and demand data for February 2021 are included in the tables.
2.2 Updates to Resources
This Reliability Outlook considers planned generator outages over the 18-month period, submitted by
market participants to the IESO’s outage management system as of March 8, 2021. Market
participants are required annually to submit information to enable the IESO to conduct reliability
assessments. This information, provided to the IESO through Form 1230, was submitted by April 1,
2020.
The following resources completed market registration since the last Outlook:
• Henvey Inlet Wind Energy Centre – 300 MW
• Capacity Auction (various resources; summer 2021 commitment period) – 992.1 MW 1
2.3 Updates to the Transmission Outlook
This Outlook also considers transmission outage plans that were submitted to the IESO’s outage
management system by February 3, 2021.
2.4 Updates to the Operability Outlook
The outlook for surplus baseload generation (SBG) conditions over the next 18 months is based on
generator outage plans submitted by market participants to the IESO’s outage management system
as of March 8, 2021.
1
More information about the Capacity Auction can be found on the IESO’s website, including details on resources that cleared the auction,
in the post-auction report
Reliability Outlook | March 2021| Public 63. Demand Forecast Electricity demand is expected to increase moderately over the forecast period, but remain below 2019 levels through 2021. Given the current state of the COVID-19 pandemic, significant uncertainty remains in the forecast. The IESO is responsible for forecasting electricity demand on the IESO-controlled grid. This demand forecast covers the period April 2021 to September 2022 and supersedes the previous forecast released in December 2020. Tables of supporting information are contained in the 2021 Q1 Outlook Tables The outlook for the remainder of 2021 is very similar to what was included in the previous Outlook and the IESO expects to see increased electricity demand over the forecast horizon. There remains significant uncertainty in the forecast due to the fluid nature of the on-going COVID-19 pandemic, and questions remain remain regarding its long-term impacts on Ontario’s economy and, thus, electricity consumption. Energy demand finished 2020 on an upswing with most sectors returning to pre-COVID levels. The manufacturing sector has continued to strengthen since the spring 2020 lockdown was lifted and has returned to pre-COVID levels. As the brunt of the economic disruption has been concentrated in sectors that are not particularly electrically intensive, there remains a divergence between economic conditions and electricity demand. Demand in 2021 is expected to top 133.5 terawatt-hours (TWh), representing a 1.0% increase over 2020 but still below the value for 2019 (134.2 TWh). In spite of accelerating access to COVID vaccines, a significant portion of Ontario’s workforce is likely to continue working from home over the remainder of 2021. The power system will continue to be more weather sensitive than it was before COVID due to higher residential loads. The summer 2021 peaks are expected to be slightly lower than those experienced in 2020 due to the resumption of the Industrial Conservation Initiative (ICI) program. With the start of the school year in September, many elementary and high school students will be returning to in class learning. At the same time, more workers are expected to be returning to their offices. Although there will likely be some structural shifts in work arrangements due to the pandemic, the majority of those currently working from home are expected to transition back to the office in the later part of the outlook period. This will increase the commercial sector’s loads while residential loads decline. Given how quickly the COVID situation is changing, there remains a significant amount of uncertainty regarding the demand forecast. The outlook for electricity demand is still fairly dependent on the pace and extent of Ontario’s economic recovery. Our modelling reflects some generic stimulus as indicated by the federal government but we will integrate more details into future outlooks as they are announced. Finally, the Ontario economy is closely integrated with that of the United States; a strong U.S. recovery would be expected to help boost Ontario’s economy. Reliability Outlook | March 2021| Public 7
Table 3-1 | Forecast Energy Demand Summary

Year                                                Normal Weather Energy (TWh)                  % Growth in Energy

2021                                                                     133.5                             1.23%

2022                                                                     135.1                             1.13%

Table 3-2 | Forecast Seasonal Peaks

Season                                                Normal Weather Peak (MW)            Extreme Weather Peak (MW)

Summer 2021                                                             22,500                             24,518

Winter 2021-22                                                          21,033                             22,200

Summer 2022                                                             22,580                             24,762

Table 3-3 | Weekly Energy and Peak Demand Forecast

                                   Normal Peak          Extreme Peak            Load Forecast        Normal Energy
Week Ending                              (MW)                  (MW)          Uncertainty (MW)        Demand (GWh)

04-Apr-21                                  17,449            18,652                     567                  2,437

11-Apr-21                                  17,070            17,844                     471                  2,420

18-Apr-21                                  17,057            17,892                     496                  2,404

25-Apr-21                                  16,771            17,392                     531                  2,357

02-May-21                                  16,750            18,769                     721                  2,348

09-May-21                                  16,635            19,138                     849                  2,308

16-May-21                                  17,243            20,615                     845                  2,317

23-May-21                                  16,992            20,544                   1,175                  2,301

30-May-21                                  18,055            21,032                   1,330                  2,281

06-Jun-21                                  19,504            22,137                   1,292                  2,377

13-Jun-21                                  20,823            23,259                   1,055                  2,447

20-Jun-21                                  21,297            23,785                     835                  2,498

Reliability Outlook | March 2021| Public                                                                       8
Normal Peak Extreme Peak Load Forecast Normal Energy Week Ending (MW) (MW) Uncertainty (MW) Demand (GWh) 27-Jun-21 22,162 23,786 754 2,573 04-Jul-21 21,691 23,443 1,016 2,541 11-Jul-21 22,373 24,417 814 2,648 18-Jul-21 22,410 24,421 838 2,690 25-Jul-21 22,483 24,217 1,035 2,717 01-Aug-21 22,500 24,228 841 2,721 08-Aug-21 21,978 24,361 958 2,662 15-Aug-21 22,141 24,329 985 2,687 22-Aug-21 22,332 24,518 1,362 2,669 29-Aug-21 21,783 23,270 1,413 2,617 05-Sep-21 21,096 23,268 1,370 2,560 12-Sep-21 21,307 23,395 680 2,462 19-Sep-21 20,052 22,886 781 2,420 26-Sep-21 18,944 21,277 420 2,382 03-Oct-21 18,176 19,152 554 2,359 10-Oct-21 16,793 18,165 786 2,350 17-Oct-21 16,939 17,545 507 2,321 24-Oct-21 17,139 18,625 392 2,396 31-Oct-21 17,200 18,811 318 2,418 07-Nov-21 17,594 18,836 416 2,431 14-Nov-21 18,490 18,962 601 2,498 21-Nov-21 19,105 19,544 342 2,569 28-Nov-21 19,368 20,201 607 2,632 05-Dec-21 19,756 20,732 409 2,670 Reliability Outlook | March 2021| Public 9
Normal Peak      Extreme Peak      Load Forecast   Normal Energy
Week Ending                              (MW)              (MW)    Uncertainty (MW)   Demand (GWh)

12-Dec-21                                  19,918       21,631                555            2,701

19-Dec-21                                  20,064       21,589                690            2,732

26-Dec-21                                  20,179       21,778                362            2,739

02-Jan-22                                  19,415       20,858                528            2,625

09-Jan-22                                  20,314       21,992                570            2,770

16-Jan-22                                  20,713       22,200                547            2,874

23-Jan-22                                  21,029       22,117                483            2,888

30-Jan-22                                  21,033       21,942                404            2,890

06-Feb-22                                  20,371       21,468                734            2,845

13-Feb-22                                  20,284       21,342                635            2,831

20-Feb-22                                  19,909       21,398                581            2,820

27-Feb-22                                  19,903       21,376                501            2,763

06-Mar-22                                  19,487       20,941                531            2,732

13-Mar-22                                  18,996       20,492                649            2,676

20-Mar-22                                  18,220       19,638                611            2,599

27-Mar-22                                  17,988       19,073                569            2,553

03-Apr-22                                  17,637       18,738                567            2,471

10-Apr-22                                  17,204       17,896                471            2,443

17-Apr-22                                  17,193       17,943                496            2,388

24-Apr-22                                  16,909       17,431                531            2,370

01-May-22                                  16,887       18,809                721            2,375

08-May-22                                  16,817       19,233                849            2,338

15-May-22                                  17,430       20,699                845            2,354

22-May-22                                  17,453       20,638              1,175            2,331

Reliability Outlook | March 2021| Public                                                       10
Normal Peak      Extreme Peak      Load Forecast   Normal Energy
Week Ending                              (MW)              (MW)    Uncertainty (MW)   Demand (GWh)

29-May-22                                  18,149       21,131              1,330            2,311

05-Jun-22                                  19,501       21,801              1,292            2,399

12-Jun-22                                  20,821       22,155              1,055            2,480

19-Jun-22                                  21,383       22,850                835            2,531

26-Jun-22                                  22,262       23,892                754            2,606

03-Jul-22                                  21,846       23,613              1,016            2,596

10-Jul-22                                  22,449       24,222                814            2,680

17-Jul-22                                  22,492       24,509                838            2,722

24-Jul-22                                  22,568       24,762              1,035            2,750

31-Jul-22                                  22,580       24,701                841            2,753

07-Aug-22                                  22,087       24,471                958            2,700

14-Aug-22                                  22,260       24,449                985            2,725

21-Aug-22                                  22,448       24,635              1,362            2,706

28-Aug-22                                  21,893       23,379              1,413            2,653

04-Sep-22                                  21,433       23,068              1,370            2,592

11-Sep-22                                  21,361       22,383                680            2,489

18-Sep-22                                  20,111       21,389                781            2,447

25-Sep-22                                  19,006       20,379                420            2,410

02-Oct-22                                  17,866       18,995                554            2,387

Reliability Outlook | March 2021| Public                                                       11
4. Resource Adequacy

   The IESO expects to have sufficient generation supply for summer 2021 and winter 2021/2022,
   accounting for zonal transmission constraints. Capacity acquired in the IESO’s December 2020
   capacity auction has added 992.1 MW of firm capacity for the summer of 2021.
   Potential risks in summer 2022 are expected to be mitigated through outage reschedulling and
   resources to be acquired in the 2021 Capacity Auction.

This section assesses the adequacy of resources to meet the forecast demand. Resource adequacy is
one of the reliability considerations used for approving generation and transmission outages. When
reserves are below required levels, with potentially adverse effects on the reliability of the grid, the
IESO will reject outage requests based on their order of precedence. Conversely, when reserves are
above required levels, additional outages can be contemplated, provided other factors – such as local
considerations, operability or transmission security – do not pose a reliability concern. In those cases,
the IESO may place an outage at risk, signaling to the facility owner to consider rescheduling the
outage.
Ontario’s existing installed generation capacity is summarized in Table 4-1. This includes capacity
from new facilities that have completed the IESO’s market registration process since the previous
Outlook, which includes Henvey Inlet Wind Energy Centre. The forecast capability at the Outlook
peak is based on the firm resource scenario, which includes resources currently in commercial
operation, and takes into account deratings, planned outages and an allowance for capability levels
below rated installed capacity.

Reliability Outlook | March 2021| Public                                                               12
Table 4-1 | Existing Grid-Connected Resource Capacity

                                                Forecast Capability Forecast Capability
                             Total Installed at 2021 Summer Peak at 2021 Summer Peak                Number Change in          Change in
                                   Capacity       Normal Weather      Extreme Weather                     of Number of         Installed
Fuel Type                             (MW)                  (MW)                (MW)                Stations   Stations        Capacity

Nuclear                              13,009                  10,495                     10,469              5             0               0

Hydroelectric                         9,060                    5,285                     4,267            76              0               0

Gas/Oil                              11,317                    9,442                     9,052            32              0               0

Wind                                  4,786                       676                       676           40              1         300

Biofuel                                    295                    254                       254             7             0               0

Solar                                      478                     64                         64          10              0               0

Demand Measures                              -                    621                       621             -             -               -

Firm Imports (+) /                           -                     80                          0            -             -               -
Exports (-) (MW)2

Total                                38,944                  26,918                     25,404          170               1         300

4.1 Assessment Assumptions

4.1.1 Generation Resources
All generation resources scheduled to come into service, be upgraded or be shut down within the
Outlook period are summarized in Table 4-2. This includes generation projects in the IESO’s
connection assessment and approval (CAA) process, those under construction, and contracted
resources. Details regarding the IESO’s CAA process and the status of these projects can be found on
the Application Status section of the IESO website.
The estimated effective date column in Table 4-2 indicates when the market registration process is
expected to be complete for each generation resource, based on information available to the IESO as
of March 8, 2021. Two scenarios are used to describe project risks:

2
 80 MW of firm imports shown here in the normal weather scenario were acquired in the 2020 Capacity Auction. The IESO’s outage
management process using the extreme weather scenario, as outlined in the Reliability Outlook methodology, assumes the availability of
2,000 MW of import capacity. This is assumed to inclusive of firm import capacity acquired through the Capacity Auction.

Reliability Outlook | March 2021| Public                                                                                                 13
• The planned scenario assumes that all resources scheduled to come into service are available
over the assessment period.
• The firm scenario assumes only resources that have reached commercial operation status at the
time this assessment was completed are available.
Planned shutdowns or retirements of generators that have a high likelihood of occurring are
considered for both scenarios.
Table 4-2 | Committed Generation Resources Status
Estimated Firm Planned
Project Name Zone Fuel Type Effective Date Project Status (MW) (MW)
Romney Wind Energy West Wind 2021-Q1 Commissioning 0 60
Centre
Nation Rise Ottawa Wind 2021-Q2 Commissioning 0 100
Calstock 3 Northeast Biofuel 2021-Q4 Expiring -38 -38
Contract
Iroquois Falls Northeast Gas 2021-Q4 Expiring -131 -131
Contract
Total -169 -9
Notes on Table 4-2:
The total may not add up due to rounding and does not include in-service facilities. Project status
provides an indication of the project progress, using the following terminology:
• Under Development – projects in approvals and permitting stages (e.g., environmental
assessment, municipal approvals, IESO connection assessment approvals) and projects under
construction
• Commissioning – projects undergoing commissioning tests with the IESO
• Commercial Operation – projects that have achieved commercial operation status under the
contract criteria, but have not met all of the IESO’s market registration requirements
3
On January 15, 2021, the Ministry of Energy, Northern Development and Mines requested the IESO enter into preliminary discussions with
Atlantic Power regarding a Power Purchase Agreement for Calstock. Further details
Reliability Outlook | March 2021| Public 14• Expiring Contract – contracts that will expire during the Outlook period are included in both
scenarios only up to their contract expiry date. Generators (including non-utility generators) that
continue to provide forecast output data are also included in the planned scenario for the rest of
the 18-month period.
4.1.2 Generation Capability
Hydroelectric
A monthly forecast of hydroelectric generation output is calculated based on median historical values
of hydroelectric production and contribution to operating reserve during weekday peak demand
hours. Through this method, routine maintenance and actual forced outages of the generating units
are implicitly accounted for in the historical data (see the first row in Table 4-3). To reflect the impact
of hydroelectric outages on the reserve above requirement (RAR) and allow the assessment of
hydroelectric outages as per the outage approval criteria, the hydroelectric capability is also
calculated, without accounting for historical outages (see the second row of Table 4-3). Table 4-3
uses data from May 2002 to March 2020, which are updated annually to coincide with the release of
the Q2 Outlook.
Table 4-3 | Monthly Historical Hydroelectric Median Values for Normal Weather
Conditions
Month Jan Feb Mar Apr May Jun Jul Aug Sep Oct Nov Dec
Historical
Hydroelectric
Median 6,327 6,266 6,068 6,021 6,116 5,940 5,790 5,431 5,227 5,600 5,851 6,312
Contribution
(MW)
Historical
Hydroelectric
Median
Contribution 6,835 6,854 6,593 6,542 6,561 6,427 6,238 5,998 6,068 6,430 6,601 6,815
without
Outages
(MW)
Thermal Generators
Thermal generators’ capacity, planned outages and deratings are based on market participant
submissions. Forced outage rates on demand are calculated by the IESO based on actual operational
data. The IESO will continue to rely on market participant-submitted forced outage rates for
comparison purposes.
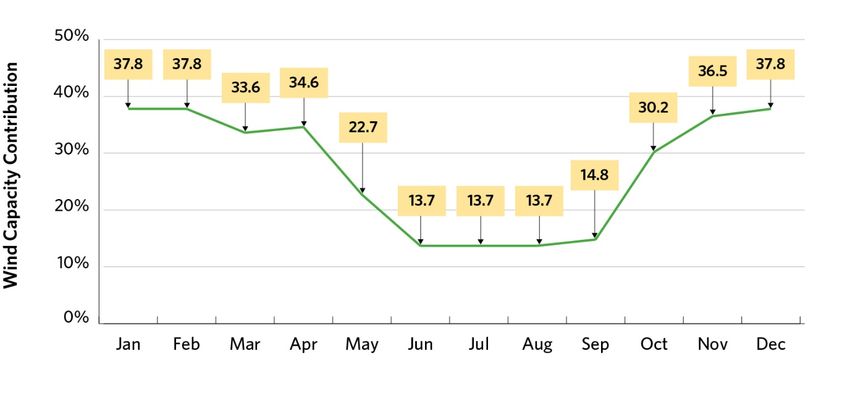
Reliability Outlook | March 2021| Public 15Wind For wind generation, monthly wind capacity contribution (WCC) values from the weekday peak hour are used. The process for determining wind contribution can be found in the Methodology to Perform the Reliability Outlook. Figure 4-1 shows the monthly WCC values, which are updated annually with the release of the Q2 Outlook. Figure 4-1 | Monthly Wind Capacity Contribution Values Solar For solar generation, monthly solar capacity contribution (SCC) values are used from the weekday peak hour. Information on how the solar contribution is calculated can be found in the Methodology to Perform the Reliability Outlook. Figure 4-2 shows the monthly SCC values, which are updated annually for the release of the Q2 Outlook. The grid demand profile has been changing, due in part to the penetration of embedded solar generation, which is pushing summer peaks to later in the day. As a result, the contribution from grid-connected solar resources has declined at the time of peak Ontario demand. Reliability Outlook | March 2021| Public 16
Figure 4-2 | Monthly Solar Capacity Contribution Values

4.1.3 Demand Measures
Both demand measures and load modifiers can impact demand, but differ in how they are treated
within the Outlook. Demand measures 4, such as dispatchable loads and demand response procured
through the IESO’s capacity auction, are not incorporated into the demand forecast and are instead
treated as resources. Load modifiers are incorporated into the demand forecast. The impacts of
activated demand measures are added back into the demand history prior to forecasting demand for
future periods.

4.1.4 Firm Transactions

Capacity-Backed Exports

The IESO allows Ontario resources to compete in the capacity auctions held by certain neighbouring
jurisdictions, but only if Ontario has adequate supply. New York Independent System Operator
(NYISO) auction results for capacity-backed exports for delivery between May andOctober 2021 will
be known in April 2021.
System-Backed Exports
As part of the electricity trade agreement between Ontario and Quebec, Ontario will supply 500 MW
of capacity to Quebec each winter from December to March until 2023. In addition, Ontario will
receive up to 2.3 TWh of clean energy annually, scheduled economically via Ontario’s real-time
markets. The imported energy will target peak hours to help reduce greenhouse gas emissions in
Ontario. The agreement includes the opportunity to cycle energy.

4
  Note that 1.7 MW of storage capacity that cleared the 2020 Capacity Auction are included in the “demand measures” totals throughout
this report, as well as in the accompanying data tables, given that it is an embedded resource that is a market participant.

Reliability Outlook | March 2021| Public                                                                                                17
As part of this capacity exchange agreement, Ontario can call on 500 MW of capacity during summer
before September 2030, based on the province’s needs. Ontario does not expect to call on this
capacity during this 18-month period.
System-Backed Imports

The IESO’s December, 2020 Capacity Auction cleared 80 MW of system-backed imports from Hydro
Quebec.

4.1.5 Summary of Scenario Assumptions
To assess future resource adequacy, the IESO must make assumptions about the amount of available
resources. The Outlook considers two scenarios: a firm scenario and a planned scenario.
The starting point for both scenarios is the existing installed resources shown in Table 4-1. The
planned scenario assumes that all resources scheduled to come into service are available over the
assessment period. The firm scenario considers only those resources that have reached commercial
operation status as of the time of this assessment. Generator-planned shutdowns or retirements that
have a high likelihood of occurring are considered for both scenarios. They also both reflect planned
outages submitted by generators. Table 4-4 shows the available resources that are forecast for the
18 months, under the two scenarios in normal weather conditions, at the time of the summer and
winter peak demands during the Outlook.

Reliability Outlook | March 2021| Public                                                            18
Table 4-4 | Summary of Available Resources under Normal Weather

                                             Summer      Summer Winter Peak Winter Peak     Summer      Summer
                                           Peak 2021   Peak 2021 2021/2022 2021/2022      Peak 2022   Peak 2022
Notes       Description
                                                Firm     Planned       Firm    Planned         Firm     Planned
                                            Scenario    Scenario   Scenario    Scenario    Scenario    Scenario

1           Installed Resources (MW)        38,944      39,104      38,944     39,104      38,944      39,104

2           Total Reductions in             12,727      12,865      13,026     13,146      12,854      12,991
            Resources (MW)

3           Demand Measures (MW)                621         621        137        137           63          63

4           Firm Imports (+) / Exports           80          80       -500        -500           0           0
            (-) (MW)

5           Available Resources (MW)        26,918      26,940      25,555     25,595      26,153      26,176

6           Bottling                              0            0       474        498            0           0

7           Available Resources without     26,918      26,940      26,028     26,092      26,153      26,176
            Bottling (MW)

Notes on Table 4-4:
1. Installed Resources: The total generation capacity assumed to be installed at the time of the
   summer and winter peaks.
2. Total Reductions in Resources: The sum of deratings, planned outages, limitations due to
   transmission constraints and allowances for capability levels below rated installed capacity.
3. Demand Measures: The amount of demand expected to be available for reduction at the time of
   peak.
4. Firm Imports/Exports: The amount of expected firm imports and exports at the time of summer
   and winter peaks.
5. Available Resources: Installed Resources (line 1) minus Total Reductions in Resources (line 2)
   plus Demand Measures (line 3) and Firm Imports/Exports (line 4). This differs from the Forecast
   Capability at System Peak shown in Table 4-1 due to the impacts of generation bottling
   (transmission limitations).

6. Available Resources without Bottling: Available resources after they are reduced due to bottling.

Reliability Outlook | March 2021| Public                                                                     19
4.2 Capacity Adequacy Assessment The capacity adequacy assessment accounts for zonal transmission constraints resulting from planned transmission outages assessed as of February 3, 2021. The generation planned outages occurring during this Outlook period have been assessed as of March 8, 2021. As already noted, the outbreak of COVID-19 has added some uncertainty to our forecasts. The IESO will continue to provide timely updates to these assessments as information becomes available. 4.2.1 Firm Scenario with Normal and Extreme Weather The firm scenario incorporates all capacity that had achieved commercial operation status as of March 8, 2021. Figure 4-3 shows Reserve Above Requirement (RAR) levels, which represent the difference between available resources and required resources. The required resources equals demand plus the required reserve. The IESO successfully ran its December 2020 Capacity Auction between December 2 and December 3, 2020, clearing 992.1 MW for the summer 2021 obligation period. The reserve requirement in the firm scenario under normal weather conditions is met throughout the entire Outlook period. In the firm scenario under extreme weather conditions, the reserve is lower than the requirement for 10 weeks in the summer of 2022. Under the current outage schedule, the RAR is below the -2,000 MW threshold for four weeks in June, three weeks in July, and three weeks in August of 2022. This potential shortfall is partially attributed to planned generator outages scheduled during those weeks, and generators are advised not to schedule outages during this period. Any remaining shortfalls in reserves will be addressed by acquiring additional resources in the December 2021 Capacity Auction. If extreme weather conditions materialize, the IESO may reject some generator maintenance outage requests to ensure that Ontario demand is met during the summer peak periods. The IESO will continue to work with generators to ensure outages are optimally scheduled. Reliability Outlook | March 2021| Public 20
Figure 4-3 | Comparison of Normal and Extreme Weather: Firm Scenario Reserve Above
Requirement

4.2.2 Planned Scenario with Normal and Extreme Weather
The planned scenario incorporates all existing capacity, as well as all capacity expected to come into
service. Approximately 160 MW of new generation capacity is expected to connect to Ontario’s grid
over this Outlook period, while 169 MW of generation capacity contracts will expire, and these
resources will no longer be available to meet demand for electricity.
Figure 4-4 shows RAR levels under the planned scenario. As observed, the reserve requirement will
be met throughout the Outlook period under normal weather conditions. Under the extreme weather
scenario, sufficient reserves exist throughout 2021. However, reserves fall short during the summer
of 2022 under the extreme scenario.

Reliability Outlook | March 2021| Public                                                             21
Figure 4-4 | Comparison of Normal and Extreme Weather: Planned Scenario Reserve
Above Requirement

4.2.3 Comparison of the Current and Previous Weekly Adequacy Assessments for the
      Firm Extreme Weather Scenario
Figure 4-5 compares forecast RAR values in the current Outlook with those in the previous Outlook,
which was published on December 16, 2020. The difference is primarily the result of changes in
planned outages and, for summer 2021, capacity that cleared the December 2020 capacity auction.

Reliability Outlook | March 2021| Public                                                             22
Figure 4-5 | Comparison of Current and Previous Outlook: Firm Scenario Extreme Weather Reserve Above Requirement Resource adequacy assumptions and risks are discussed in detail in the Methodology to Perform the Reliability Outlook. 4.3 Energy Adequacy Assessment This section assesses energy adequacy to determine whether Ontario has sufficient supply to meet its forecast energy demands, while highlighting potential adequacy concerns during the Outlook time frame. At the same time, the assessment estimates the aggregate production by resource category to meet the projected demand based on assumed resource availability. 4.3.1 Summary of Energy Adequacy Assumptions The energy adequacy assessment (EAA) uses the same set of assumptions as the capacity assessment, as outlined in Table 4-1 and Table 4-2, which indicate the total capacity of committed resources and when they are expected to be available over the next 18 months. The monthly forecast of energy production capability, based on energy modelling results, is included in the 2021 Q1 Outlook Tables. For the EAA, only the firm scenario in Table 4-5 with normal weather demand is assessed. The key assumptions specific to this assessment are described in the Methodology to Perform the Reliability Outlook. Reliability Outlook | March 2021| Public 23
4.3.2 Results – Firm Scenario with Normal Weather
Table 4-5 summarizes the energy simulation results over the next 18 months for the firm scenario
with normal weather demand both for Ontario and for each transmission zone.

Table 4-5 | Summary of Zonal Energy for Firm Scenario Normal Weather

                                                                                        Zonal Energy
                    18-Month        18-Month 18-Month        18-Month    Net  Inter- Demand  on Peak Available Energy
                      Energy           Energy   Energy          Energy Zonal Energy  Day of 18-Month   on Peak Day of
                     Demand           Demand Production     Production     Transfer            Period 18-Month Period
Zone                    TWh       Average MW      TWh      Average MW          TWh              GWh              GWh

Bruce                     1.0                73     55.7        4,231          54.7             1.5           131.4

East                     12.0               915     18.1        1,374           6.1            25.4             98.1

Essa                     12.7               968      3.7          281          -9.0            27.9             15.0

Niagara                   5.8               441     20.5        1,561          14.7            14.1             54.1

Northeast                15.3              1,164    14.5        1,104          -0.8            26.3             30.6

Northwest                 5.3               403      6.8          519           1.5             9.0             21.1

Ottawa                   12.8               970      0.2           15         -12.6            29.3              1.2

Southwest                40.8              3,100     6.5          492         -34.3            92.8             21.3

Toronto                  73.5              5,585    60.0        4,562         -13.5           173.4           141.8

West                     20.8              1,578    13.4        1,017          -7.4            49.7             75.8

Ontario               199.9           15,196       199.3     15,156           -0.5           449.4           590.4

4.3.3 Findings and Conclusions
As noted in section 4.2.1, Ontario is expected to have adequate reserves for the duration of the
outlook in the firm resource, normal weather scenario. The EAA indicates that Ontario is also
expected to have sufficient supply to meet its forecast energy needs throughout the outlook period
for the firm scenario with normal weather demand, without having to rely on support from external
jurisdictions.
The figures and tables in this section are based on a simulation of the province’s power system, using
the assumptions presented within the Outlook to confirm that Ontario will be energy adequate.
Figure 4-6 breaks down projected production by fuel type to meet Ontario’s energy demand for the
next 18 months, while Figure 4-7 shows the production by fuel type for each month. The province’s
energy exports and imports are not considered in this assessment. Table 4-6 summarizes these
simulated production results by fuel type, for each year.

Reliability Outlook | March 2021| Public                                                                            24
Figure 4-6 | Forecast Energy Production by Fuel Type Figure 4-7 | Forecast Monthly Energy Production by Fuel Type Reliability Outlook | March 2021| Public 25
Table 4-6 | Energy Production by Fuel Type for the Firm Scenario Normal Weather

Fuel Type                                             2021               2022
                                                              (Jan 1 – Sep 30)       Total
(Grid-Connected)                           (Apr 1 – Dec 31)
                                                                                    (GWh)
                                                     (GWh)             (GWh)

Nuclear                                           57,357             54,558       111,914

Hydro                                             27,059             27,853        54,912

Gas & Oil                                           7,858            11,165        19,023

Wind                                                5,423              6,832       12,256

Biofuel                                               159                164          322

Other (Solar & DR)                                    605                829        1,434

Total                                            98,460           101,401         199,861

Reliability Outlook | March 2021| Public                                              26
5. Transmission Reliability Assessment Ontario’s transmission system is expected to continue to reliably supply province-wide demand, while experiencing normal contingencies defined by planning criteria for the next 18 months. However, some combinations of transmission and/or generation outages could create operating challenges. The IESO assesses transmission adequacy using a methodology based on conformance to established criteria, including the Ontario Resource and Transmission Assessment Criteria (ORTAC), NERC transmission planning standard TPL 001-4 and NPCC Directory #1 as applicable. Planned system enhancements and projects, and known transmission outages are also considered in the studies. Ontario’s transmission system is expected to continue to reliably supply province-wide demand while experiencing normal contingencies defined by planning criteria for the next 18 months. 5.1 Transmission Projects This section considers the information transmitters have provided with respect to transmission projects that are planned for completion within the next 18 months. The list of transmission projects can be found in Appendix B1. Note that the planned in-service dates in this table and throughout this document are as of December 2020. These dates are subject to change as the COVID-19 pandemic may impact project logistics. Any changes will be communicated through subsequent Reliability Outlooks. 5.2 Transmission Outages The IESO’s assessment of transmission outage plans is shown in Appendix C, Tables C1 to C11. The methodology used to assess the transmission outage plans is described in the Methodology to Perform the Reliability Outlook. This Outlook reflects transmission outage plans submitted to the IESO as of February 3, 2021. 5.3 Transmission Considerations The purpose of this section of the report is to highlight projects and outages that may affect reliability and/or the scheduling of other outages, and to consolidate these considerations by zone. Reliability Outlook | March 2021| Public 27
Bruce, Southwest, and West Zones
Hydro One has begun replacing some of the aging infrastructure at the Bruce 230 kV switchyard,
which requires careful coordination of transmission and generation outages. This project is scheduled
to be completed by Q4 2021. There is a one-week outage of circuit B502M starting October 18, 2021
that will impact the transfer capability out of Bruce zone. There is a one-week outage of circuits
B569B, M585M, and N581M starting April 17, 2021 that will impact the transfer capability into the
West zone and out of Bruce zone. Significant growth in the greenhouse sector has led to a number of
customer connection requests in the Windsor-Essex region that are expected to exceed the capacity
of the existing transmission system in the area. A new switching station at the Leamington Junction
is proceeding toward a Q2 2022 in-service date. Outages may be more challenging to accommodate
as new load connections are made and required transmission reinforcements are being implemented.

Toronto, East, and Ottawa Zones
Operational challenges due to high voltages in eastern Ontario and the Greater Toronto Area
continue to occur during low-demand periods. High voltages are the result of lower minimum
demand for electricity, which has been exacerbated by the impacts of COVID-19. The IESO and
Hydro One are currently managing this situation by removing from service certain 500 kV circuits
mainly in eastern Ontario and occasionally in the Bruce area during those periods. Up to three 500 kV
circuits were removed from service during the lowest demand periods in Ontario. To address this
issue on a longer-term basis, two 500 kV line-connected shunt reactors will be installed at Lennox TS
with a target in-service date of Q3 2021 for the first reactor and Q4 2021 for the second reactor.
Aging circuit breakers in the Richview 230 kV switchyard are scheduled to be replaced by Q2 2021.
Hydro One and the IESO will coordinate the outages required to reduce the impact on the Flow East
Toward Toronto transfer capabilities.
There is a one-and-a-half-week outage of circuit B5D starting August 16, 2021 that will impact the
transfer capability into the Ottawa zone.
Northwest, Northeast, and Essa Zones
A three-and-a-half-week outage of circuit X503E starting May 31, 2021 and an one-month outage of
circuit X504E starting October 4, 2021 will reduce transfer capability of the North-South Tie.
Studies in the Kirkland Lake area have indicated the need for transmission reinforcements due to
potential load growth and limited transfer capabilities, as well as load security violations under
planning scenarios. Until these reinforcements are finalized and put in service, the addition of new
loads may be difficult and subject to requirements such as pre-contingency load curtailment and
post-contingency load rejection.

Reliability Outlook | March 2021| Public                                                               28
Interconnections
The failure of the phase angle regulator (PAR) connected to the Ontario-New York 230-kV circuit
L33P in early 2018 continues to hinder the province’s ability to import electricity from New York
through the New York-St. Lawrence interconnection and from Quebec through the Beauharnois
interconnection. This has required enhanced coordination with affected parties and more focused
management of St. Lawrence-area resources in real-time. Careful coordination of transmission and
generation outages will continue to be required in the area.
PARs are unique pieces of equipment and replacements are not readily available. Replacement
options for the unit are being investigated by the IESO, in conjunction with Hydro One, the NYISO
and the New York Power Authority. The replacement will provide greater flexibility to control both
current and future intertie flows with New York. The return-to-service date is expected to be between
March 2022 and March 2023.
A planned one-and-a-half-month outage of circuit J5D starting April 9, 2021 will reduce import and
export transfer capability between Ontario and Michigan.
A planned six-month outage of circuit BP76 starting July 15, 2021 will reduce import and export
transfer capability between Ontario and New York.

Reliability Outlook | March 2021| Public                                                             29
6. Operability

   During the Outlook period, Ontario will continue to experience potential surplus baseload
   generation conditions, much of which can be managed with existing market mechanisms, such
   as exports and curtailment of variable generation.

This section highlights existing or emerging operability issues that could impact the reliability of
Ontario’s power system.

6.1 Surplus Baseload Generation
Baseload generation comprises nuclear, run-of-the-river hydroelectric and variable generation, such
as wind and solar. When baseload supply is expected to exceed Ontario demand, market signals
reflect such conditions through lower prices, and resources in Ontario and at the interties respond
accordingly. The resulting market outcomes may include higher export volumes, dispatching down of
hydroelectric generation and grid-connected renewable resources, and nuclear manoeuvring or
shutdowns. For severe surplus conditions that could affect the reliability of the system, the IESO may
take out-of-market actions, such as manually curtailing resources and/or imports.
Ontario is expected to experience potential surplus baseload conditions during the shoulder periods
throughout the Outlook. Figure 6-1 highlights the periods during which expected baseload generation
may exceed forecast demand.

Figure 6-1 | Minimum Ontario Demand and Baseload Generation

Reliability Outlook | March 2021| Public                                                               30
Surplus baseload conditions can be managed with existing market mechanisms signaling for exports,
and by curtailing variable and nuclear generation. Going forward, as shown in Figure 6-2, existing
mechanisms will be sufficient for managing SBG.

Figure 6-2 | Minimum Ontario Demand and Baseload Generation

The baseload generation assumptions include expected exports and run-of-river hydroelectric
production, the latest planned outage information and in-service dates for new or refurbished
generation. The expected contribution from self-scheduling and intermittent generation has been
updated to reflect the latest data. Information on the dispatch order of wind, solar and flexible
nuclear resources can be found in Market Manual 4 Part 4.2. Output from commissioning units is
explicitly excluded from this analysis due to uncertainty and the highly variable nature of
commissioning schedules. Figure 6-3 shows the monthly off-peak wind capacity contribution values
calculated from actual wind output up to March 31, 2020. These values are updated annually to
coincide with the release of the Q2 Outlook.

Reliability Outlook | March 2021| Public                                                            31
Figure 6-3 | Monthly Off-Peak Wind Capacity Contribution Values

Reliability Outlook | March 2021| Public                          32
7. Resources Referenced in This Report
The table below lists additional resources in the order they appear in the report.

Table 7-1 | Additional Resources

Resource                    URL                                                                       Location in This Report

Reliability Outlook          http://www.ieso.ca/en/Sector-Participants/Planning-and-
                                                                                                        Introduction
Webpage                      Forecasting/Reliability-Outlook

Security and Adequacy
                             http://www.ieso.ca/power-data/data-directory                               Introduction
Assessments

                             http://www.ieso.ca/-/media/files/ieso/document-library/planning-
2021 Q1 Outlook Tables                                                                                  Throughout
                             forecasts/reliability-outlook/ReliabilityOutlookTables_2021Mar.xls

Connection Assessments       http://www.ieso.ca/en/sector-participants/connection-
                                                                                                        Assessment Assumptions
and Approval Process         assessments/application-status

Methodology to Perform       http://www.ieso.ca/-/media/files/ieso/document-library/planning-
                                                                                                        Throughout
the Reliability Outlook      forecasts/reliability-outlook/ReliabilityOutlookMethodology2021Mar.pdf

                             http://www.ieso.ca/en/Sector-Participants/Market-Operations/Markets-
Capacity Auction                                                                                        Demand Measures
                             and-Related-Programs/Capacity-Auction

                             http://www.ieso.ca/en/Sector-Participants/Market-Renewal/Capacity-
Enabling Capacity Exports                                                                               Firm Transactions
                             Exports

Ontario Resource and         http://www.ieso.ca/-/media/files/ieso/Document%20Library/Market-
Transmission Assessment      Rules-and-Manuals-Library/market-manuals/market-administration/IMO-        Transmission Considerations
Criteria                     REQ-0041-TransmissionAssessmentCriteria.pdf

NERC Transmission
Planning Standard TPL-       http://www.nerc.com/pa/Stand/Reliability%20Standards/TPL-001-4.pdf         Transmission Considerations
001-4

                             https://www.npcc.org/Standards/Directories/Directory_1_TFCP_rev_201
NPCC Directory #1                                                                                       Transmission Considerations
                             51001_GJD.pdf

                             http://www.ieso.ca/-/media/Files/IESO/Document-Library/Market-Rules-
Market Manual 4 Part 4.2     and-Manuals-Library/market-manuals/market-operations/mo-                   Surplus Baseload Generation
                             dispatchdatartm.pdf?la=en

                             http://www.ieso.ca/Sector-Participants/Engagement-
Grid-LDC Interoperability
                             Initiatives/Standing-Committees/Grid-LDC-Interoperability-Standing-        Distributed Energy Resources
Standing Committee
                             Committee

Reliability Outlook | March 2021| Public                                                                                               33
8. List of Acronyms Acronym Definition CAA Connection Assessment and Approval CROW Control Room Operations Window DER Distributed Energy Resource DR Demand Response EAA Energy Adequacy Assessment ESAG Energy Storage Advisory Group FETT Flow East Toward Toronto GS Generating Station GTA Greater Toronto Area ICI Industrial Conservation Initiative IESO Independent Electricity System Operator IRRP Integrated Regional Resource Plan kV Kilovolt LDC Local Distribution Company MW Megawatt(s) NERC North American Electric Reliability Corporation NPCC Northeast Power Coordinating Council NYISO New York Independent System Operator ORTAC Ontario Resource and Transmission Criteria PAR Phase Angle Regulator RAR Reserve Above Requirement RAS Remedial Action Scheme SBG Surplus Baseload Generation SCC Solar Capacity Contribution TS Transmission/Transformer Station TWh Terawatt-hour(s) WCC Wind Capacity Contribution Reliability Outlook | March 2021| Public 34
Independent Electricity
System Operator
1600-120 Adelaide Street West
Toronto, Ontario M5H 1T1

Phone: 905.403.6900
Toll-free: 1.888.448.7777
E-mail: customer.relations@ieso.ca

ieso.ca

    @IESO_Tweets
   facebook.com/OntarioIESO
   linkedin.com/company/IESO
You can also read