Reliability Outlook An adequacy assessment of Ontario's electricity system January 2021 to June 2022
←
→
Page content transcription
If your browser does not render page correctly, please read the page content below

2.

Reliability Outlook
An adequacy assessment of Ontario’s
electricity system

January 2021 to June 2022
Executive Summary
The COVID-19 pandemic continues to impact Ontario’s economy as well as its energy usage and
patterns, but with a vaccine on the horizon, prospects for a solid recovery look more promising than
in the last Outlook. The pandemic has affected different industry sectors in different ways, but overall
energy consumption has increased over the second half of 2020. However, with a significant portion
of the workforce continuing to work from home, the system will remain more weather-sensitive than
it was before COVID due to higher residential loads.
Although there are still some uncertainties with the forecast, the IESO expects demand in 2021 to
increase over 2020 by 1.0%. Nevertheless, 2021 demand (133.3 TWh) will still be less than it was in
2019 (134.2 TWh).
The IESO expects to have sufficient generation supply for both winter 2020/2021 and winter
2021/2022, but there are periods in the summer of 2021 when reserve margins may fall short of
requirements, resulting in deferred outages. However, this outlook does not include 992.1 megawatts
of capacity that was acquired in the December capacity auction for a commitment period of May 1 to
October 31, 2021.

In a milestone for Ontario’s electricity system, the capacity auction included participation from a
broad range of eligible resources. Resources that were successful in the auction include industrial and
commercial consumers providing demand response, imports, generation and energy storage. Having
a flexible and competitive mechanism that can respond to changing system needs delivers significant
value to ratepayers and ensures cost-effective reliability while balancing consumer/supplier risks. The
full auction results can be found on the IESO website but given time constraints, this new capacity
has not been included in the modelling for this Outlook.
During the shoulder seasons, Ontario will continue to experience potential surplus baseload
generation conditions, but they can be managed with existing market mechanisms such as exports
and curtailment of variable generation.
And finally, Ontario’s transmission system is expected to continue to reliably supply province-wide
demand, while experiencing normal contingencies defined by planning criteria for the next 18
months.

Reliability Outlook | December, 2020 | Public                                                          1
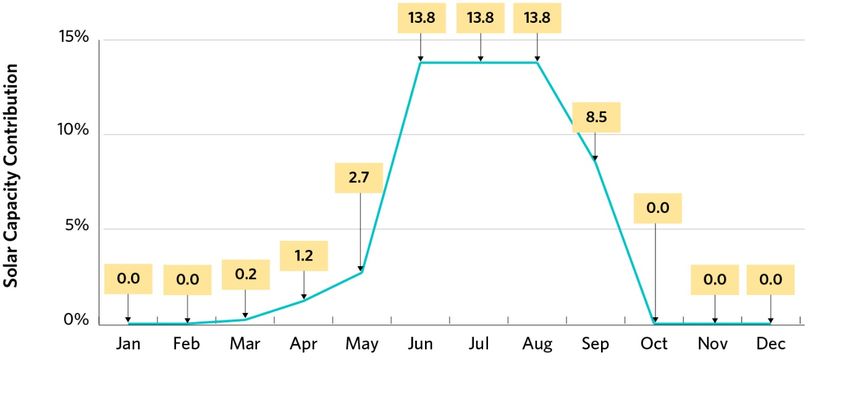
Table of Contents
Executive Summary                                                                               1

1.         Introduction                                                                         5

2.         Updates to this Outlook                                                              6
     2.1       Updates to the Demand Forecast                                                   6
     2.2       Updates to Resources                                                             6
     2.3       Updates to the Transmission Outlook                                              6

     2.4       Updates to the Operability Outlook                                               6

3.         Demand Forecast                                                                      7

4.         Resource Adequacy                                                                   12
     4.1       Assessment Assumptions                                                          13
           4.1.1     Generation Resources                                                      13
           4.1.2     Generation Capability                                                     15
           4.1.3     Demand Measures                                                           17
           4.1.4     Firm Transactions                                                         17

           4.1.5     Summary of Scenario Assumptions                                           17
     4.2       Capacity Adequacy Assessment                                                    19
           4.2.1     Firm Scenario with Normal and Extreme Weather                             19
           4.2.2     Planned Scenario with Normal and Extreme Weather                          20
           4.2.3 Comparison of the Current and Previous Weekly Adequacy Assessments for the Firm
           Extreme Weather Scenario                                                             21
     4.3       Energy Adequacy Assessment                                                      22

           4.3.1     Summary of Energy Adequacy Assumptions                                    22
           4.3.2     Results – Firm Scenario with Normal Weather                               23
           4.3.3     Findings and Conclusions                                                  23

5.         Transmission Reliability Assessment                                                 26
     5.1       Transmission Projects                                                           26

Reliability Outlook | December, 2020 | Public                                                    2
5.2       Transmission Outages                                                                                                 26
     5.3       Transmission Considerations                                                                                          26

6.         Operability                                                                                                              29
     6.1       Seasonal Readiness                                                                                                   29

     6.2       Surplus Baseload Generation                                                                                          29

7.         Resources Referenced in This Report                                                                                      33

8.         List of Acronyms                                                                                                         34

List of Figures
Figure 4-1 | Monthly Wind Capacity Contribution Values Solar ........................................ 16

Figure 4-2 | Monthly Solar Capacity Contribution Values .................................................. 16

Figure 4-3 | Comparison of Normal and Extreme Weather: Firm Scenario Reserve Above
Requirement ......................................................................................................................... 20

Figure 4-4 | Comparison of Normal and Extreme Weather: Planned Scenario Reserve
Above Requirement.............................................................................................................. 21

Figure 4-5 | Comparison of Current and Previous Outlook: Firm Scenario Extreme
Weather Reserve Above Requirement ................................................................................ 22

Figure 4-6 | Forecast Energy Production by Fuel Type ...................................................... 24

Figure 4-7 | Forecast Monthly Energy Production by Fuel Type ........................................ 24

Figure 6-1 | Minimum Ontario Demand and Baseload Generation ...... Error! Bookmark not
defined.

Figure 6-2 | Minimum Ontario Demand and Baseload Generation .................................... 31

Figure 6-3 | Monthly Off-Peak Wind Capacity Contribution Values .................................. 32

Reliability Outlook | December, 2020 | Public                                                                                         3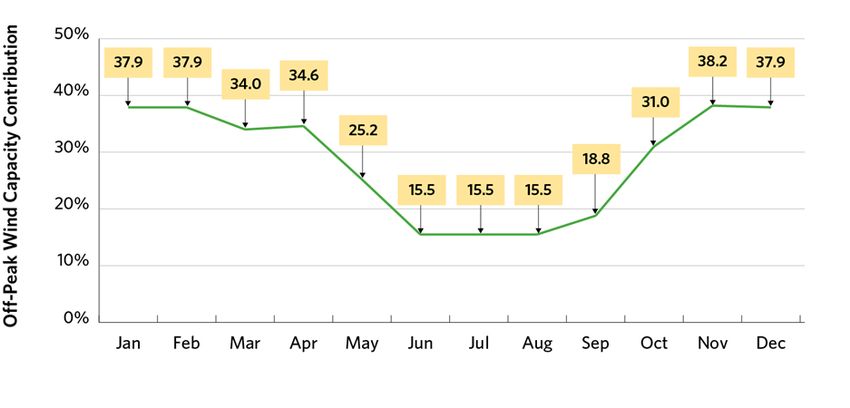
List of Tables
Table 3-1 | Forecast Energy Summary.................................................................................. 8

Table 3-2 | Forecast Seasonal Peaks .................................................................................... 8

Table 3-3 | Weekly Energy and Peak Demand Forecast ...................................................... 8

Table 4-1 | Existing Grid-Connected Resource Capacity ................................................... 13

Table 4-2 | Committed Generation Resources Status ........................................................ 14

Table 4-3 | Monthly Historical Hydroelectric Median Values for Normal Weather
Conditions............................................................................................................................. 15

Table 4-4 | Summary of Available Resources under Normal Weather .............................. 18

Table 4-5 | Summary of Zonal Energy for Firm Scenario Normal Weather ....................... 23

Table 4-6 | Ontario Energy Production by Fuel Type for the Firm Scenario Normal
Weather ................................................................................................................................ 25

Table 7-1 | Additional Resources ........................................................................................ 33

Reliability Outlook | December, 2020 | Public                                                                                            4
1. Introduction
This Outlook covers the 18 months from January 2021 to June 2022, and supersedes the Outlook
released on September 22, 2020.
The purpose of the 18-month horizon in the Reliability Outlook is to:
•    Advise market participants of the resource and transmission reliability of the Ontario electricity
     system
•    Assess potentially adverse conditions that might be avoided by adjusting or coordinating
     maintenance plans for generation and transmission equipment
•    Report on initiatives being implemented to improve reliability within this time frame
This Outlook assesses resource and transmission adequacy based on the stated assumptions,
following the Methodology to Perform the Reliability Outlook. Due to uncertainties associated with
various assumptions, readers are encouraged to use their judgment in considering possible future
scenarios.
Additional supporting documents are located on the IESO website.
Security and adequacy assessments are published on the IESO website on a daily basis and
progressively supersede information presented in this report.
For questions or comments on this Outlook, please contact us at 905-403-6900 (toll-free 1-888-448-
7777) or customer.relations@ieso.ca.

Reliability Outlook | December, 2020 | Public                                                             5
2. Updates to this Outlook 2.1 Updates to the Demand Forecast The demand forecast used in this Outlook is informed by actual demand, weather and economic data through to the end of October 2020, and has been updated to reflect the most recent economic projections. Actual weather and demand data for November 2020 are included in the tables. 2.2 Updates to Resources This Reliability Outlook considers planned generator outages over the 18-month period, submitted by market participants to the IESO’s outage management system as of December 2, 2020. Market participants are required annually to submit information to enable the IESO to conduct reliability assessments. This information, provided to the IESO through Form 1230, was submitted by April 1, 2020. 2.3 Updates to the Transmission Outlook This Outlook also considers transmission outage plans that were submitted to the IESO’s outage management system by October 27, 2020. 2.4 Updates to the Operability Outlook The outlook for surplus baseload generation (SBG) conditions over the next 18 months is based on generator outage plans submitted by market participants to the IESO’s outage management system as of December 2, 2020. Reliability Outlook | December, 2020 | Public 6
3. Demand Forecast

   Electricity demand is expected to increase moderately over the forecast period, but remain
   below 2019 levels through 2021. Given the current state of the COVID-19 pandemic, significant
   uncertainty remains in the forecast.

The IESO is responsible for forecasting electricity demand on the IESO-controlled grid. This demand
forecast covers the period January 2021 to June 2022 and supersedes the previous forecast released
in September 2020. Tables of supporting information are contained in the 2020 Q4 Outlook Tables
The outlook for 2021 shows a small improvement when compared to 2020. However, the forecast
remains uncertain given the continuing health crisis and the resulting economic impacts. Significant
questions remain, especially with respect to the speed and scope of Ontario’s economic recovery,
which will affect electricity demand and consumption patterns. Energy demand has increased over
the second half of 2020 but different parts of the economy are experiencing different recovery rates.
For example, the pandemic has had a disproportionate impact on the service sector. The
manufacturing sector, by contrast, has been generally robust since the lifting of the spring lockdown.
The brunt of the economic disruption has been borne by the accommodation, hospitality and
entertainment sectors which are not electrically intensive.
With the overall growth in demand and a vaccine on the horizon, which will drive a return to
“normal” life, including energy usage, the IESO expects demand in 2021 to increase over 2020 by
1.0%. However, 2021 demand (133.3 TWh) will still be less than the value for 2019 (134.2 TWh).
With the onset of the second wave and a significant portion of the workforce continuing to work from
home, the system will continue to be more weather-sensitive than pre-COVID due to higher
residential loads. The 2020-21 winter peaks are expected to be slightly higher for the same reason.
With the anticipated deployment of a vaccine in the spring and summer of 2021, employees across
many sectors of the economy will begin returning to the office. Fewer people working from home will
reduce the weather sensitivity of the system as the year progresses. This, in conjunction with the
resumption of the Industrial Conservation Initiative (ICI) will act to keep put downward pressure on
summer peaks as compared to the peaks experienced in the summer of 2020, which was
characterized by extended periods of hot weather.
There remains a significant amount of uncertainty regarding the demand forecast. As the vaccine is
deployed and restrictions are lifted, it will become clear how much of the reduced employment and
economic activity was temporary and how much has become permanent. Stimulus measures have
been an important factor over the course of the pandemic. The post-pandemic recovery, including its
trajectory, will also be shaped by government policies and actions. For the purposes of this Outlook,
the IESO has assumed some generic stimulus funding as indicated by the federal government but will
reflect details as they are announced.

Reliability Outlook | December, 2020 | Public                                                        7
Finally, the Ontario economy is closely integrated with that of the United States. The U.S. response to
COVID and its post-pandemic recovery will have longer term impacts on Ontario that extend far
beyond just the timing of the re-opening of the border. A strong U.S. recovery will help boost
Ontario’s economy. Conversely, should the U.S. economy struggle in 2021, that would act as a drag
on Ontario’s economy.

Table 3-1 | Forecast Energy Summary

Year                                             Normal Weather Energy (TWh)                  % Growth in Energy

2020                                                                  132.0                             -1.63%

2021                                                                  133.3                             1.02%

2022                                                                  134.1                             0.60%

Table 3-2 | Forecast Seasonal Peaks

Season                                             Normal Weather Peak (MW)            Extreme Weather Peak (MW)

Winter 2020-21                                                       21,176                             22,612

Summer 2021                                                          22,592                             24,438

Winter 2021-22                                                       20,959                             22,154

Table 3-3 | Weekly Energy and Peak Demand Forecast

                                   Normal Peak       Extreme Peak            Load Forecast        Normal Energy
Week Ending                              (MW)               (MW)          Uncertainty (MW)        Demand (GWh)

03-Jan-21                               19,943            21,462                     528                  2,649

10-Jan-21                               20,959            22,612                     570                  2,850

17-Jan-21                               20,922            22,400                     547                  2,854

24-Jan-21                               21,154            22,390                     483                  2,869

31-Jan-21                               21,176            22,408                     404                  2,870

07-Feb-21                               20,760            21,801                     734                  2,795

14-Feb-21                               20,306            21,437                     635                  2,786

Reliability Outlook | December, 2020 | Public                                                               8
Normal Peak Extreme Peak Load Forecast Normal Energy Week Ending (MW) (MW) Uncertainty (MW) Demand (GWh) 21-Feb-21 19,674 21,605 581 2,741 28-Feb-21 19,659 21,295 501 2,751 07-Mar-21 19,384 20,671 531 2,683 14-Mar-21 18,621 20,227 649 2,634 21-Mar-21 18,090 19,406 611 2,560 28-Mar-21 18,046 18,895 569 2,515 04-Apr-21 17,468 18,545 567 2,418 11-Apr-21 16,953 17,642 471 2,393 18-Apr-21 16,886 17,633 496 2,377 25-Apr-21 16,845 17,139 531 2,330 02-May-21 16,823 18,603 721 2,328 09-May-21 16,656 19,264 849 2,308 16-May-21 17,266 20,534 845 2,319 23-May-21 17,286 20,474 1,175 2,301 30-May-21 17,941 20,989 1,330 2,281 06-Jun-21 19,440 22,076 1,292 2,379 13-Jun-21 20,765 23,199 1,055 2,451 20-Jun-21 21,342 23,724 835 2,502 27-Jun-21 22,213 23,767 754 2,577 04-Jul-21 21,738 23,296 1,016 2,558 11-Jul-21 22,463 24,438 814 2,677 18-Jul-21 22,501 24,237 838 2,718 25-Jul-21 22,574 24,361 1,035 2,746 01-Aug-21 22,592 24,372 841 2,746 08-Aug-21 21,954 24,217 958 2,659 Reliability Outlook | December, 2020 | Public 9
Normal Peak   Extreme Peak      Load Forecast   Normal Energy
Week Ending                              (MW)           (MW)    Uncertainty (MW)   Demand (GWh)

15-Aug-21                               22,117       24,186                985            2,684

22-Aug-21                               22,308       24,374              1,362            2,666

29-Aug-21                               21,758       23,131              1,413            2,614

05-Sep-21                               21,038       23,095              1,370            2,553

12-Sep-21                               21,248       23,222                680            2,460

19-Sep-21                               19,992       22,715                781            2,411

26-Sep-21                               18,884       21,113                420            2,373

03-Oct-21                               18,116       19,060                554            2,344

10-Oct-21                               16,845       17,911                786            2,326

17-Oct-21                               16,840       17,296                507            2,298

24-Oct-21                               17,007       18,398                392            2,372

31-Oct-21                               17,081       18,618                318            2,394

07-Nov-21                               17,326       18,728                416            2,412

14-Nov-21                               18,515       18,768                601            2,479

21-Nov-21                               18,846       19,342                342            2,551

28-Nov-21                               19,236       20,012                607            2,614

05-Dec-21                               19,599       21,011                409            2,662

12-Dec-21                               20,006       21,513                555            2,696

19-Dec-21                               19,966       21,471                690            2,727

26-Dec-21                               19,937       21,661                362            2,735

02-Jan-22                               19,503       20,740                528            2,623

09-Jan-22                               20,263       21,939                570            2,766

16-Jan-22                               20,794       22,147                547            2,871

23-Jan-22                               20,948       22,134                483            2,885

30-Jan-22                               20,959       22,154                404            2,887

Reliability Outlook | December, 2020 | Public                                               10
Normal Peak   Extreme Peak      Load Forecast   Normal Energy
Week Ending                              (MW)           (MW)    Uncertainty (MW)   Demand (GWh)

06-Feb-22                               20,335       21,544                734            2,819

13-Feb-22                               20,143       21,165                635            2,801

20-Feb-22                               19,718       21,192                581            2,791

27-Feb-22                               19,699       21,133                501            2,734

06-Mar-22                               19,486       20,771                531            2,711

13-Mar-22                               18,699       20,324                649            2,657

20-Mar-22                               18,157       19,474                611            2,580

27-Mar-22                               18,100       18,956                569            2,535

03-Apr-22                               17,553       18,621                567            2,449

10-Apr-22                               17,043       17,734                471            2,416

17-Apr-22                               16,985       17,730                496            2,361

24-Apr-22                               16,935       17,225                531            2,343

01-May-22                               16,913       18,690                721            2,351

08-May-22                               16,751       19,354                849            2,332

15-May-22                               17,364       20,631                845            2,348

22-May-22                               17,386       20,574              1,175            2,325

29-May-22                               18,038       21,085              1,330            2,305

05-Jun-22                               19,447       21,580              1,292            2,395

12-Jun-22                               20,767       21,902              1,055            2,475

19-Jun-22                               21,330       22,625                835            2,527

26-Jun-22                               22,208       23,661                754            2,602

03-Jul-22                               21,793       23,400              1,016            2,604

Reliability Outlook | December, 2020 | Public                                               11
4. Resource Adequacy

   The IESO expects to have sufficient generation supply for both winter 2020/2021 and winter
   2021/2022, accounting for zonal transmission constraints. Potential risks in summer 2021 and
   early summer 2022 are expected to be mitigated by outage rescheduling.

This section assesses the adequacy of resources to meet the forecast demand. Resource adequacy is
one of the reliability considerations used for approving outages. When reserves are below required
levels, with potentially adverse effects on the reliability of the grid, the IESO will reject outage
requests based on their order of precedence. Conversely, when reserves are above required levels,
additional outages can be contemplated, provided other factors – such as local considerations,
operability or transmission security – do not pose a reliability concern. In those cases, the IESO may
place an outage at risk, signaling to the facility owner to consider rescheduling the outage.
The existing installed generation capacity is summarized in Table 4-1. This includes capacity from
new facilities that have completed the IESO’s market registration process since the previous Outlook.
The forecast capability at the Outlook peak is based on the firm resource scenario, which includes
resources currently in commercial operation, and takes into account deratings, planned outages and
an allowance for capability levels below rated installed capacity.

Reliability Outlook | December, 2020 | Public                                                       12
Table 4-1 | Existing Grid-Connected Resource Capacity

                                                    Forecast Capability   Forecast Capability
                               Total Installed         at Outlook Peak       at Outlook Peak    Number Change in      Change in
                                     Capacity         Normal Weather               [Extreme]          of Number of     Installed
Fuel Type                               (MW)                     (MW)                  (MW)     Stations   Stations    Capacity

Nuclear                                13,009                 10,504                  9,988           5          0            0

Hydroelectric                           9,060                   5,133                 4,509         76           0            0

Gas/Oil                                11,317                   9,339                 8,914         32           0            0

Wind                                    4,486                     634                   634         39           0            0

Biofuel                                    295                    254                   254           7          0            0

Solar                                      478                      64                    64        10           0            0

Demand Measures                                 -                   28                    28          -           -           -

Firm Imports (+) /                              -                    0                     0          -           -           -
Exports (-) (MW)

Total                                38,644                  25,956                24,391         169            0            0

4.1 Assessment Assumptions

4.1.1 Generation Resources
All generation resources scheduled to come into service, be upgraded or be shut down within the
Outlook period are summarized in Table 4-2. This includes generation projects in the IESO’s
connection assessment and approval (CAA) process, those under construction, and contracted
resources. Details regarding the IESO’s CAA process and the status of these projects can be found on
the Application Status section of the IESO website.
The estimated effective date column in Table 4-2 indicates when the market registration process is
expected to be complete for each generation resource, based on information available to the IESO as
of December 2, 2020. Two scenarios are used to describe project risks:
•    The planned scenario assumes that all resources scheduled to come into service are available
     over the assessment period.
•    The firm scenario assumes only resources that have reached commercial operation status at the
     time this assessment was completed are available.

Reliability Outlook | December, 2020 | Public                                                                                13
Planned shutdowns or retirements of generators that have a high likelihood of occurring are
considered for both scenarios.
Table 4-2 | Committed Generation Resources Status
Estimated Firm Planned
Project Name Zone Fuel Type Effective Date Project Status (MW) (MW)
Henvey Inlet Wind Farm Essa Wind 2020-Q4 Commissioning 300
Romney Wind Energy West Wind 2021-Q1 Commissioning 60
Centre
Nation Rise Ottawa Wind 2021-Q2 Commissioning 100
Calstock 1 Northeast Biofuel 2021-Q4 Expiring -38 -38
Contract
Iroquois Falls Northeast Gas 2021-Q4 Expiring -131 -131
Contract
Total -169 291
Notes on Table 4-2:
The total may not add up due to rounding and does not include in-service facilities. Project status
provides an indication of the project progress, using the following terminology:
• Under Development – projects in approvals and permitting stages (e.g., environmental
assessment, municipal approvals, IESO connection assessment approvals) and projects under
construction
• Commissioning – projects undergoing commissioning tests with the IESO
• Commercial Operation – projects that have achieved commercial operation status under the
contract criteria, but have not met all of the IESO’s market registration requirements
• Expiring Contract – contracts that will expire during the Outlook period are included in both
scenarios only up to their contract expiry date. Generators (including non-utility generators) that
continue to provide forecast output data are also included in the planned scenario for the rest of
the 18-month period.
1
Atlantic Power recently announced a 1-year extension to its Calstock Power Purchase Agreement, to December 2021; Table 4-2 reflects
this change. However, the analysis in this report assumes the prior expiry date of December 2020. This will be updated in the Q1 2021
Outlook.
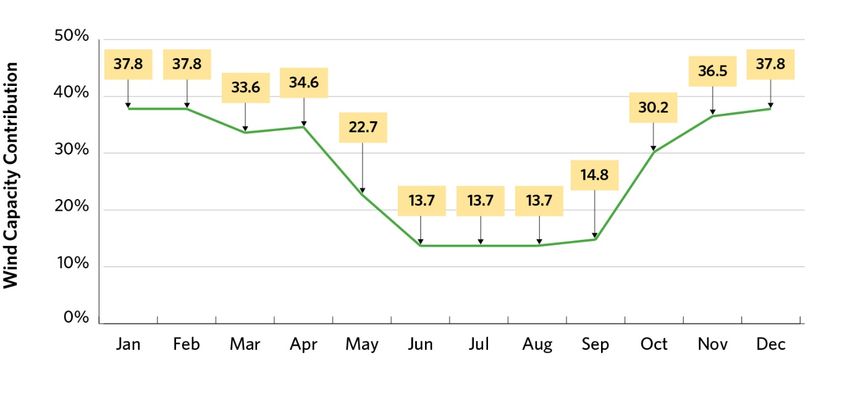
Reliability Outlook | December, 2020 | Public 144.1.2 Generation Capability Hydroelectric A monthly forecast of hydroelectric generation output is calculated based on median historical values of hydroelectric production and contribution to operating reserve during weekday peak demand hours. Through this method, routine maintenance and actual forced outages of the generating units are implicitly accounted for in the historical data (see the first row in Table 4-3). To reflect the impact of hydroelectric outages on the reserve above requirement (RAR) and allow the assessment of hydroelectric outages as per the outage approval criteria, the hydroelectric capability is also calculated, without accounting for historical outages (see the second row of Table 4-3). Table 4-3 uses data from May 2002 to March 2020, which are updated annually to coincide with the release of the Q2 Outlook. Table 4-3 | Monthly Historical Hydroelectric Median Values for Normal Weather Conditions Month Jan Feb Mar Apr May Jun Jul Aug Sep Oct Nov Dec Historical Hydroelectric Median 6,327 6,266 6,068 6,021 6,116 5,940 5,790 5,431 5,227 5,600 5,851 6,312 Contribution (MW) Historical Hydroelectric Median Contribution 6,835 6,854 6,593 6,542 6,561 6,427 6,238 5,998 6,068 6,430 6,601 6,815 without Outages (MW) Thermal Generators Thermal generators’ capacity, planned outages and deratings are based on market participant submissions. Forced outage rates on demand are calculated by the IESO based on actual operational data. The IESO will continue to rely on market participant-submitted forced outage rates for comparison purposes. Wind For wind generation, monthly wind capacity contribution (WCC) values from the weekday peak hour are used. The process for determining wind contribution can be found in the Methodology to Perform the Reliability Outlook. Figure 4-1 shows the monthly WCC values, which are updated annually with the release of the Q2 Outlook. Reliability Outlook | December, 2020 | Public 15
Figure 4-1 | Monthly Wind Capacity Contribution Values

Solar

For solar generation, monthly solar capacity contribution (SCC) values are used from the weekday
peak hour. Information on how the solar contribution is calculated can be found in the Methodology
to Perform the Reliability Outlook. Figure 4-2 shows the monthly SCC values, which are updated
annually for the release of the Q2 Outlook.

The grid demand profile has been changing, due in part to the penetration of embedded solar
generation, which is pushing summer peaks to later in the day. As a result, the contribution from
grid-connected solar resources has declined at the time of peak Ontario demand.

Figure 4-2 | Monthly Solar Capacity Contribution Values

Reliability Outlook | December, 2020 | Public                                                        16
4.1.3 Demand Measures
Both demand measures and load modifiers can impact demand, but differ in how they are treated
within the Outlook. Demand measures, such as dispatchable loads and demand response procured
through the IESO’s capacity auction, are not incorporated into the demand forecast and are instead
treated as resources. Load modifiers are incorporated into the demand forecast. The impacts of
activated demand measures are added back into the demand history prior to forecasting demand for
future periods.

4.1.4 Firm Transactions

Capacity-Backed Exports

The IESO allows Ontario resources to compete in the capacity auctions held by certain neighbouring
jurisdictions, but only if Ontario has adequate supply. No capacity-backed exports were successful in
the New York Independent System Operator (NYISO) auctions for delivery between November 2020
to April 2021.
System-Backed Exports
As part of the electricity trade agreement between Ontario and Quebec, Ontario will supply 500 MW
of capacity to Quebec each winter from December to March until 2023. In addition, Ontario will
receive up to 2.3 TWh of clean energy annually, scheduled economically via Ontario’s real-time
markets. The imported energy will target peak hours to help reduce greenhouse gas emissions in
Ontario. The agreement includes the opportunity to cycle energy.
As part of this capacity exchange agreement, Ontario can call on 500 MW of capacity during summer
before September 2030, based on the province’s needs. Ontario does not expect to call on this
capacity during this 18-month period.

4.1.5 Summary of Scenario Assumptions
To assess future resource adequacy, the IESO must make assumptions about the amount of available
resources. The Outlook considers two scenarios: a firm scenario and a planned scenario.

The starting point for both scenarios is the existing installed resources shown in Table 4-1. The
planned scenario assumes that all resources scheduled to come into service are available over the
assessment period. The firm scenario considers only those resources that have reached commercial
operation status as of the time of this assessment. Generator-planned shutdowns or retirements that
have a high likelihood of occurring are considered for both scenarios. They also both reflect planned
outages submitted by generators. Table 4-4 shows the available resources that are forecast for the
18 months, under the two scenarios in normal weather conditions, at the time of the summer and
winter peak demands during the Outlook.

Reliability Outlook | December, 2020 | Public                                                       17
Table 4-4 | Summary of Available Resources under Normal Weather

                                                Winter Peak Winter Peak     Summer      Summer Winter Peak Winter Peak
                                                2020/2021 2020/2021       Peak 2021   Peak 2021 2021/2022 2021/2022
Notes       Description
                                                      Firm     Planned         Firm     Planned       Firm    Planned
                                                   Scenario    Scenario    Scenario    Scenario   Scenario    Scenario

1           Installed Resources (MW)               38,644      38,944      38,644      39,104      38,644     38,944

            Total Reductions in                    11,529      11,708      12,744      13,139      12,326     12,505
2
            Resources (MW)

3           Demand Measures (MW)                       702        702           28          28        702        702

            Firm Imports (+) / Exports                -500       -500            0            0      -500        -500
4
            (-) (MW)

5           Available Resources (MW)               27,317      27,438      25,928      25,993      26,520     26,641

6           Bottling                                   479        479           29          29        597        597

            Available Resources without            27,795      27,916      25,957      26,022      27,117     27,238
7
            Bottling (MW)

Notes on Table 4-4:
1. Installed Resources: The total generation capacity assumed to be installed at the time of the
   summer and winter peaks.
2. Total Reductions in Resources: The sum of deratings, planned outages, limitations due to
   transmission constraints and allowances for capability levels below rated installed capacity.
3. Demand Measures: The amount of demand expected to be available for reduction at the time of
   peak.
4. Firm Imports/Exports: The amount of expected firm imports and exports at the time of summer
   and winter peaks.
5. Available Resources: Installed Resources (line 1) minus Total Reductions in Resources (line 2)
   plus Demand Measures (line 3) and Firm Imports/Exports (line 4). This differs from the Forecast
   Capability at System Peak shown in Table 4-1 due to the impacts of generation bottling
   (transmission limitations).

6. Available Resources without Bottling: Available resources after they are reduced due to bottling.

Reliability Outlook | December, 2020 | Public                                                                       18
4.2 Capacity Adequacy Assessment The capacity adequacy assessment accounts for zonal transmission constraints resulting from planned transmission outages assessed as of October 27, 2020. The generation planned outages occurring during this Outlook period have been assessed as of December 2, 2020. As already noted, the outbreak of COVID-19 has added some uncertainty to our forecasts. The IESO will continue to provide timely updates to these assessments as information becomes available. 4.2.1 Firm Scenario with Normal and Extreme Weather The firm scenario incorporates all capacity that had achieved commercial operation status as of December 2, 2020. Figure 4-3 shows Reserve Above Requirement (RAR) levels, which represent the difference between available resources and required resources. The required resources equals demand plus the required reserve. The IESO successfully ran its December 2020 Capacity Auction between December 2 and December 3, 2020, clearing 992.1 MW for the summer 2021 obligation period. Given the timing of the auction, this capacity has not been accounted for in this Outlook; it will be included in the resource adequacy assessment in the Q1 2021 Reliabilty Outlook. The reserve requirement in the firm scenario under normal weather conditions is met throughout the entire Outlook period. In the firm scenario under extreme weather conditions, the reserve is lower than the requirement for a total of eight weeks in 2021 and three weeks in the first half of 2022. Under the current outage schedule, the RAR is below the -2,000 MW threshold for one week in June, three weeks in July, three weeks in August and one week in September of 2021, as well as three weeks in June of 2022. This potential shortfall is largely attributed to planned generator outages scheduled during those weeks. If extreme weather conditions materialize, the IESO may reject some generator maintenance outage requests to ensure that Ontario demand is met during the summer peak periods. At this time, the brief period of low reserves in June, 2022 is forecast to be particularly difficult, and generators are advised to consider moving outages planned for this period. The IESO will continue to work with generators to ensure outages are optimally scheduled. Reliability Outlook | December, 2020 | Public 19
Figure 4-3 | Comparison of Normal and Extreme Weather: Firm Scenario Reserve Above
Requirement

4.2.2 Planned Scenario with Normal and Extreme Weather
The planned scenario incorporates all existing capacity, as well as all capacity expected to come into
service. Approximately 460 MW of new generation capacity is expected to connect to Ontario’s grid
over this Outlook period, while 169 MW of generation capacity contracts will expire, and these
resources will no longer be available to meet demand for electricity.
Figure 4-4 shows RAR levels under the planned scenario. As observed, the reserve requirement will
be met throughout the Outlook period under normal weather conditions.

Reliability Outlook | December, 2020 | Public                                                        20
Figure 4-4 | Comparison of Normal and Extreme Weather: Planned Scenario Reserve
Above Requirement

4.2.3 Comparison of the Current and Previous Weekly Adequacy Assessments for the
      Firm Extreme Weather Scenario
Figure 4-5 compares forecast RAR values in the current Outlook with those in the previous Outlook,
which was published on September 22, 2020. The difference is primarily the result of changes in
planned outages.

Reliability Outlook | December, 2020 | Public                                                        21
Figure 4-5 | Comparison of Current and Previous Outlook: Firm Scenario Extreme Weather Reserve Above Requirement Resource adequacy assumptions and risks are discussed in detail in the Methodology to Perform the Reliability Outlook. 4.3 Energy Adequacy Assessment This section assesses energy adequacy to determine whether Ontario has sufficient supply to meet its forecast energy demands, while highlighting potential adequacy concerns during the Outlook time frame. At the same time, the assessment estimates the aggregate production by resource category to meet the projected demand based on assumed resource availability. 4.3.1 Summary of Energy Adequacy Assumptions The energy adequacy assessment (EAA) uses the same set of assumptions as the capacity assessment, as outlined in Table 4-1 and Table 4-2, which indicate the total capacity of committed resources and when they are expected to be available over the next 18 months. The monthly forecast of energy production capability, based on energy modelling results, is included in the 2020 Q4 Outlook Tables. For the EAA, only the firm scenario in Table 4-5 with normal weather demand is assessed. The key assumptions specific to this assessment are described in the Methodology to Perform the Reliability Outlook. Reliability Outlook | December, 2020 | Public 22
4.3.2 Results – Firm Scenario with Normal Weather
Table 4-5 summarizes the energy simulation results over the next 18 months for the firm scenario
with normal weather demand both for Ontario and for each transmission zone.

Table 4-5 | Summary of Zonal Energy for Firm Scenario Normal Weather

                                                                                         Zonal Energy
                   18-Month         18-Month 18-Month          18-Month    Net Inter- Demand on Peak Available Energy
                     Energy            Energy   Energy            Energy Zonal Energy Day of 18-Month on Peak Day of
                    Demand            Demand Production       Production     Transfer           Period 18-Month Period
Zone                   TWh        Average MW      TWh        Average MW          TWh             GWh             GWh

Bruce                     0.9                   65    55.4        4,227         54.5              1.4          110.9

East                    12.5               952        18.0        1,373           5.5           26.0           104.2

Essa                    12.6               963         3.9          300          -8.7           27.0             15.7

Niagara                   5.7              436        20.6        1,575         14.9            14.1             52.9

Northeast               15.3            1,171         15.1        1,155          -0.2           27.1             34.0

Northwest                 5.8              439         7.0          532           1.2             9.3            21.8

Ottawa                  13.6            1,041          0.2           16        -13.4            30.8              1.2

Southwest               40.6            3,099          7.0          537        -33.6            92.6             25.5

Toronto                 72.6            5,539         58.8        4,490        -13.8           172.9           159.4

West                    20.3            1,553         13.8        1,053          -6.5           49.3             75.5

Ontario               199.9          15,257          199.9     15,257            0.0          450.5           601.0

4.3.3 Findings and Conclusions
As noted in section 4.2.1, Ontario is expected to have adequate reserves for the duration of the
outlook in the firm resource, normal weather scenario. The EAA indicates that Ontario is also
expected to have sufficient supply to meet its forecast energy needs throughout the outlook period
for the firm scenario with normal weather demand, without having to rely on support from external
jurisdictions.
The figures and tables in this section are based on a simulation of the province’s power system, using
the assumptions presented within the Outlook to confirm that Ontario will be energy adequate.
Figure 4-6 breaks down projected production by fuel type to meet Ontario’s energy demand for the
next 18 months, while Figure 4-7 shows the production by fuel type for each month. The province’s
energy exports and imports are not considered in this assessment. Table 4-6 summarizes these
simulated production results by fuel type, for each year.

Reliability Outlook | December, 2020 | Public                                                                        23
Figure 4-6 | Forecast Energy Production by Fuel Type Figure 4-7 | Forecast Monthly Energy Production by Fuel Type Reliability Outlook | December, 2020 | Public 24
Table 4-6 | Ontario Energy Production by Fuel Type for the Firm Scenario Normal
Weather

Fuel Type                                                  2021               2022
                                                                                         Total
(Grid-Connected)                                (Jan 1 – Dec 31)   (Jan 1 – Jun 30)
                                                                                        (GWh)
                                                          (GWh)              (GWh)

Nuclear                                                75,919             34,398      110,318

Hydro                                                  36,605             19,469       56,074

Gas & Oil                                              11,667               7,007      18,674

Wind                                                     8,390              5,306      13,696

Biofuel                                                    211                  99        310

Other (Solar & DR)                                         522                334         856

Total                                               133,315              66,612       199,927

Reliability Outlook | December, 2020 | Public                                             25
5. Transmission Reliability Assessment Ontario’s transmission system is expected to continue to reliably supply province-wide demand, while experiencing normal contingencies defined by planning criteria for the next 18 months. However, some combinations of transmission and/or generation outages could create operating challenges. The IESO assesses transmission adequacy using a methodology based on conformance to established criteria, including the Ontario Resource and Transmission Assessment Criteria (ORTAC), NERC transmission planning standard TPL 001-4 and NPCC Directory #1 as applicable. Planned system enhancements and projects, and known transmission outages are also considered in the studies. Ontario’s transmission system is expected to continue to reliably supply province-wide demand while experiencing normal contingencies defined by planning criteria for the next 18 months. 5.1 Transmission Projects This section considers the information transmitters provide with respect to transmission projects that are planned for completion within the next 18 months. The list of transmission projects is provided in Appendix B1. Note that the planned in-service dates in this table and throughout this document are as of October 2020. These dates are subject to change as the COVID-19 pandemic may impact project logistics. Any changes will be communicated through subsequent Reliability Outlooks. 5.2 Transmission Outages The IESO’s assessment of transmission outage plans is shown in Appendix C, Tables C1 to C11. The methodology used to assess the transmission outage plans is described in the Methodology to Perform the Reliability Outlook. This Outlook reflects transmission outage plans submitted to the IESO as of October 27, 2020. 5.3 Transmission Considerations The purpose of this section of the report is to highlight projects and outages that may affect reliability and/or the scheduling of other outages, and to consolidate these considerations by zone. Reliability Outlook | December, 2020 | Public 26
Bruce, Southwest, and West Zones
Hydro One has begun replacing some of the aging infrastructure at the Bruce 230 kV switchyard,
which requires careful coordination of transmission and generation outages. This project is scheduled
to be completed by Q2 2021. A series of non-contiguous planned outages on 500 kV circuits in
southern Ontario will impact the flow out of Bruce and the transfer capability from and to the West
zone from January to June 2021.

Significant growth in the greenhouse sector has led to a number of customer connection requests in
the Windsor-Essex region that are expected to exceed the capacity of the existing transmission
system in the area. A new switching station at the Leamington Junction is proceeding toward a Q4
2022 in-service date. Outages may be more challenging to facilitate as new load connections are
made and required transmission reinforcements are being implemented.
Toronto, East, and Ottawa Zones
Operational challenges due to high voltages in eastern Ontario and the Greater Toronto Area
continue to occur during low-demand periods. High voltages are the result of lower minimum
demand for electricity, which has been exacerbated by the impacts of COVID-19. The IESO and
Hydro One are currently managing this situation by removing from service certain 500 kV circuits
mainly in eastern Ontario and occasionally in the Bruce area during those periods. Up to three 500 kV
circuits were removed from service during instances of the lowest demand periods in Ontario. To
address this issue on a longer-term basis, two 500 kV line-connected shunt reactors will be installed
at Lennox TS with a target in-service date of Q1 2021 for the first reactor and Q4 2021 for the
second reactor.

Aging circuit breakers in the Richview 230 kV switchyard are to be replaced by Q1 2021. Hydro One
and the IESO will coordinate the outages required to reduce the impact on the Flow East Toward
Toronto transfer capabilities.
There is a one-and-a-half-week outage of circuit B5D starting January 18, 2021 that will impact the
transfer capability into the Ottawa zone.
Northwest, Northeast, and Essa Zones
A three-and-a-half-week outage of circuit X503E starting May 31, 2021 will reduce transfer capability
of the North-South Tie.
Studies in the Kirkland Lake area have indicated the need for transmission reinforcements due to
potential load growth and limited transfer capabilities, as well as load security violations under
planning scenarios. Until these reinforcements are finalized and put in service, the addition of new
loads may be difficult and subject to requirements such as pre-contingency load curtailment and
post-contingency load rejection.

Reliability Outlook | December, 2020 | Public                                                          27
Interconnections
The failure of the phase angle regulator (PAR) connected to the Ontario-New York 230-kV circuit
L33P in early 2018 continues to hinder the province’s ability to import electricity from New York
through the New York-St. Lawrence interconnection and from Quebec through the Beauharnois
interconnection. This has required enhanced coordination with affected parties and more focused
management of St. Lawrence-area resources in real-time. Careful coordination of transmission and
generation outages will continue to be required in the area.
PARs are unique pieces of equipment and replacements are not readily available. Replacement
options for the unit are being investigated by the IESO, in conjunction with Hydro One, the NYISO
and the New York Power Authority. The replacement will provide greater flexibility to control both
current and future intertie flows with New York. The return-to-service date is expected to be between
March 2022 and March 2023.
A planned two-month outage of circuit J5D starting March 29, 2021 will reduce import and export
transfer capability between Ontario and Michigan.

Reliability Outlook | December, 2020 | Public                                                       28
6. Operability

   During the Outlook period, Ontario will continue to experience potential surplus baseload
   generation conditions, much of which can be managed with existing market mechanisms, such
   as exports and curtailment of variable generation.

This section highlights existing or emerging operability issues that could impact the reliability of
Ontario’s power system.

6.1 Seasonal Readiness
The IESO continues to use its existing programs to test the readiness of the generation fleet for the
upcoming winter season. The IESO also continues to track industry developments, utility best
practices and programs implemented by other jurisdictions for winter readiness and, where
appropriate, will share the relevant information with market participants to facilitate the development
and enhancement of their winter readiness programs. More information and guidance on cold
weather preparedness can be found in the IESO’s winterization guideline.

6.2 Surplus Baseload Generation
Baseload generation is made up of nuclear, run-of-the-river hydroelectric and variable generation,
such as wind and solar. When baseload supply is expected to exceed Ontario demand, market signals
reflect such conditions through lower prices, and resources in Ontario and at the interties respond
accordingly. The resulting market outcomes may include higher export volumes, dispatching down of
hydroelectric generation and grid-connected renewable resources, and nuclear manoeuvring or
shutdowns. For severe surplus conditions that could affect the reliability of the system, the IESO may
take out-of-market actions, such as manually curtailing resources and/or imports.
Ontario is expected to experience potential surplus baseload conditions during the shoulder periods
throughout the Outlook. Figure 6-1 highlights the periods during which expected baseload generation
may exceed forecast demand.

Reliability Outlook | December, 2020 | Public                                                          29
Figure 6-1 | Minimum Ontario Demand and Baseload Generation

Surplus baseload conditions can be managed with existing market mechanisms signaling for exports,
and by curtailing variable and nuclear generation. Going forward, as shown in Figure 6-2, existing
mechanisms will be sufficient for managing SBG.

Reliability Outlook | December, 2020 | Public                                                    30
Figure 6-2 | Minimum Ontario Demand and Baseload Generation

The baseload generation assumptions include expected exports and run-of-river hydroelectric
production, the latest planned outage information and in-service dates for new or refurbished
generation. The expected contribution from self-scheduling and intermittent generation has been
updated to reflect the latest data. Information on the dispatch order of wind, solar and flexible
nuclear resources can be found in Market Manual 4 Part 4.2. Output from commissioning units is
explicitly excluded from this analysis due to uncertainty and the highly variable nature of
commissioning schedules. Figure 6-3 shows the monthly off-peak wind capacity contribution values
calculated from actual wind output up to March 31, 2020. These values are updated annually to
coincide with the release of the Q2 Outlook.

Reliability Outlook | December, 2020 | Public                                                       31
Figure 6-3 | Monthly Off-Peak Wind Capacity Contribution Values

Reliability Outlook | December, 2020 | Public                     32
7. Resources Referenced in This Report
The table below lists additional resources in the order they appear in the report.

Table 7-1 | Additional Resources

Resource                    URL                                                                       Location in This Report

   Reliability Outlook       http://www.ieso.ca/en/Sector-Participants/Planning-and-
                                                                                                                  Introduction
        Webpage              Forecasting/Reliability-Outlook

 Security and Adequacy
                             http://www.ieso.ca/power-data/data-directory                                         Introduction
     Assessments

                             http://www.ieso.ca/-/media/files/ieso/document-library/planning-
2020 Q4 Outlook Tables                                                                                           Throughout
                             forecasts/reliability-outlook/ReliabilityOutlookTables_2020Dec.xls

Connection Assessments       http://www.ieso.ca/en/sector-participants/connection-
                                                                                                          Assessment Assumptions
 and Approval Process        assessments/application-status

Methodology to Perform       http://www.ieso.ca/-/media/files/ieso/document-library/planning-
                                                                                                                 Throughout
 the Reliability Outlook     forecasts/reliability-outlook/ReliabilityOutlookMethodology2020Dec.pdf

                             http://www.ieso.ca/en/Sector-Participants/Market-Operations/Markets-
    Capacity Auction                                                                                         Demand Measures
                             and-Related-Programs/Capacity-Auction

                             http://www.ieso.ca/en/Sector-Participants/Market-Renewal/Capacity-
Enabling Capacity Exports                                                                                     Firm Transactions
                             Exports

  Ontario Resource and       http://www.ieso.ca/-/media/files/ieso/Document%20Library/Market-
Transmission Assessment      Rules-and-Manuals-Library/market-manuals/market-administration/IMO-         Transmission Considerations
         Criteria            REQ-0041-TransmissionAssessmentCriteria.pdf

   NERC Transmission
 Planning Standard TPL-      http://www.nerc.com/pa/Stand/Reliability%20Standards/TPL-001-4.pdf          Transmission Considerations
         001-4

                             https://www.npcc.org/Standards/Directories/Directory_1_TFCP_rev_201
   NPCC Directory #1                                                                                     Transmission Considerations
                             51001_GJD.pdf

Winterization Guidelines     https://www.ieso.ca/-/media/Files/IESO/Document-
                                                                                                             Seasonal Readiness
                             Library/training/IESO-Winterization-Guidelines.ashx

                             http://www.ieso.ca/-/media/Files/IESO/Document-Library/Market-Rules-
Market Manual 4 Part 4.2     and-Manuals-Library/market-manuals/market-operations/mo-                    Surplus Baseload Generation
                             dispatchdatartm.pdf?la=en

                             http://www.ieso.ca/Sector-Participants/Engagement-
Grid-LDC Interoperability
                             Initiatives/Standing-Committees/Grid-LDC-Interoperability-Standing-        Distributed Energy Resources
  Standing Committee
                             Committee

Reliability Outlook | December, 2020 | Public                                                                                          33
8. List of Acronyms Acronym Definition CAA Connection Assessment and Approval CROW Control Room Operations Window DER Distributed Energy Resource DR Demand Response EAA Energy Adequacy Assessment ESAG Energy Storage Advisory Group FETT Flow East Toward Toronto GS Generating Station GTA Greater Toronto Area ICI Industrial Conservation Initiative IESO Independent Electricity System Operator IRRP Integrated Regional Resource Plan kV Kilovolt LDC Local Distribution Company MW Megawatt(s) NERC North American Electric Reliability Corporation NPCC Northeast Power Coordinating Council NYISO New York Independent System Operator ORTAC Ontario Resource and Transmission Criteria PAR Phase Angle Regulator RAR Reserve Above Requirement RAS Remedial Action Scheme SBG Surplus Baseload Generation SCC Solar Capacity Contribution TS Transmission/Transformer Station TWh Terawatt-hour(s) WCC Wind Capacity Contribution Reliability Outlook | December, 2020 | Public 34
Independent Electricity
System Operator
1600-120 Adelaide Street West
Toronto, Ontario M5H 1T1

Phone: 905.403.6900
Toll-free: 1.888.448.7777
E-mail: customer.relations@ieso.ca

ieso.ca

    @IESO_Tweets
   facebook.com/OntarioIESO
   linkedin.com/company/IESO
You can also read